Download to read offline
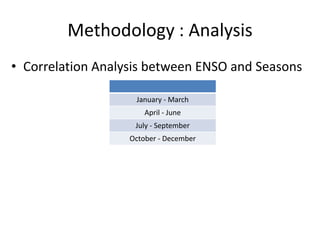
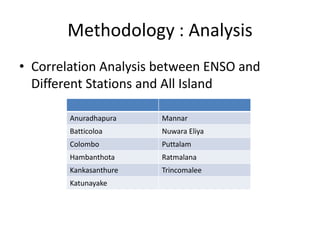
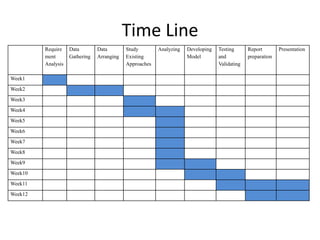

This document outlines a proposed study to predict extreme precipitation in Sri Lanka through analysis of the relationship with El Niño Southern Oscillation (ENSO). The objectives are to identify the relationship between extreme precipitation and ENSO, develop a predictive model, and validate it with recent data. The methodology will include collecting rainfall and ENSO data, defining a threshold for extreme precipitation, distribution and correlation analysis between stations and seasons, and time series analysis. The results are expected to show whether extreme precipitation days are more or less frequent during El Niño versus La Niña phases. The study will be conducted over 12 months with the support of Sri Lankan government agencies and universities.


![D1 06 ca_climate_change-bd_ashraf_06feb2013 [compatibility mode]](https://cdn.slidesharecdn.com/ss_thumbnails/d106caclimatechange-bdashraf06feb2013compatibilitymode-130211012421-phpapp01-thumbnail.jpg?width=640&height=640&fit=bounds)


![Empowering women and children through the usage of ict[1]](https://cdn.slidesharecdn.com/ss_thumbnails/empoweringwomenandchildrenthroughtheusageofict1-120310094633-phpapp02-thumbnail.jpg?width=640&height=640&fit=bounds)


