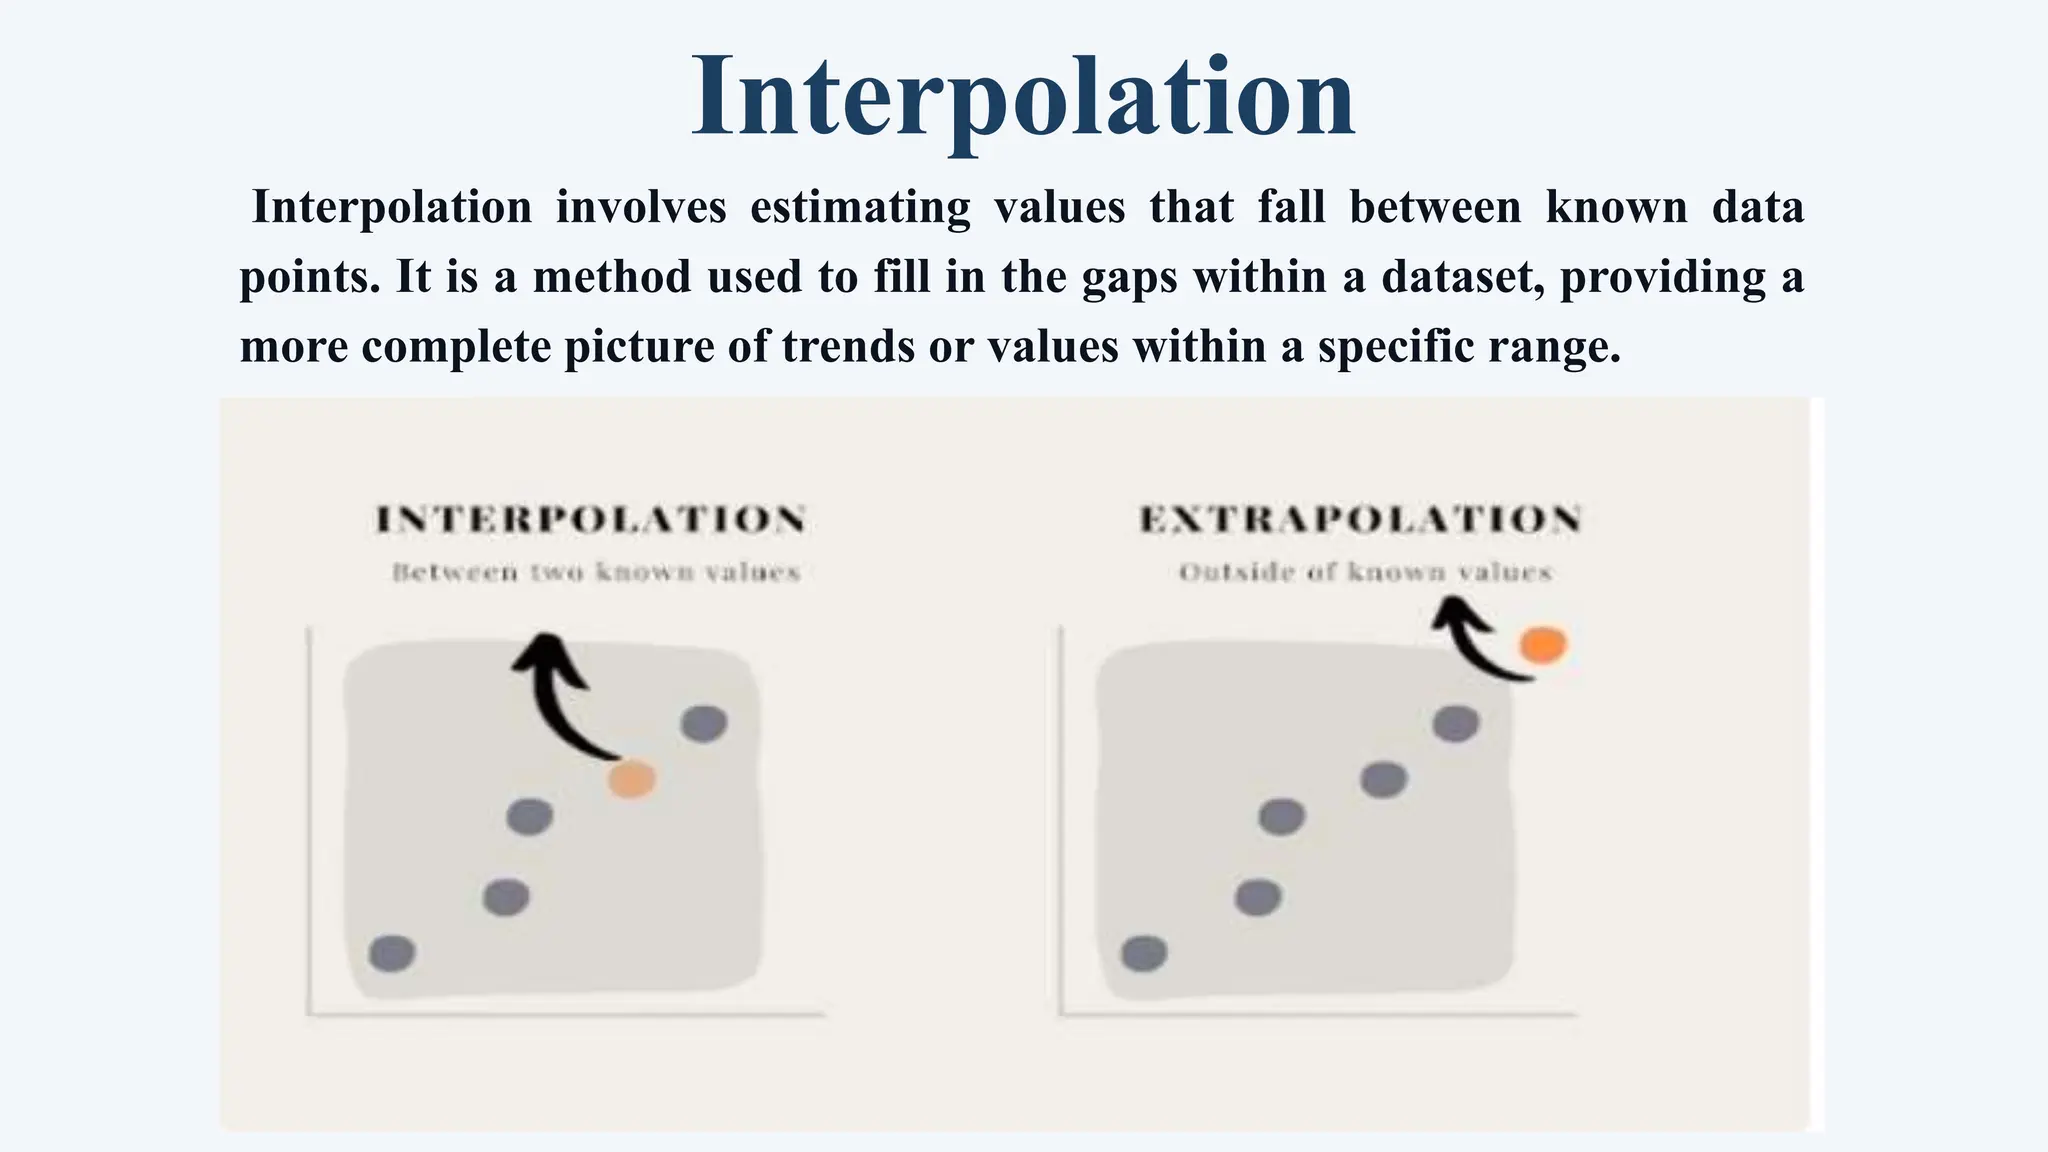
Extrapolation & Interpolation
Dr.Hafiz Kosar
• An extrapolation is similar to an educated guess or a hypothesis, involving
the use of facts and observations about a present or known situation to
predict future outcomes.
• In data science, extrapolation is a statistical technique employed to
estimate values of data points beyond the range covered by the known
values in a dataset.
• It is a mathematical approach used to project or extend existing trends,
patterns, or relationships in data, making predictions or estimates for
values outside the original set of data points.
Extrapolation
• Extrapolation assumes that observed patterns or trends in known data
will persist in unobserved or future data points.
• Despite its utility in making predictions, extrapolation has certain
assumptions and limitations.
• Caution is required when using extrapolation techniques, as extending
too far beyond the observed data range can result in inaccurate or
unreliable predictions.
• Changes in underlying factors that influence the data, not considered in
the extrapolation, can affect the accuracy of predictions.
• Careful consideration of the context is essential when employing
extrapolation to ensure its reliability and relevance.
Extrapolation
"Extrapolation is derived from the word 'extra,' which means 'outside,'
and a shortened form of the term 'interpolation.' While 'interpolation' may
sound unfamiliar, it refers to the insertion between two points. Therefore,
extrapolation involves inserting points outside of any existing data points.
For instance, consider if you have information about Monday and Tuesday.
In such a scenario, you could potentially make an extrapolation about
Wednesday."
Etymology
Extrapolation Methods
Management | 2025
Various extrapolation methods are employed to predict and analyze
trends in data. Among these, two widely used methods are:
Extrapolation is the process of estimating or predicting values outside
the range of known or observed data. It involves extending a trend or
pattern identified in existing data to make predictions about future or
unseen values. There are various methods of extrapolation, each with
its own assumptions, advantages, and limitations. Here are some
common extrapolation methods:
Linear Extrapolation
Management | 2025
Assumes a constant rate of change between data points. Uses a straight
line to extend the trend observed in the existing data. In the case of
linear extrapolation, the data points are plotted on a graph and a linear
equation is used to best represent the data. Then to extrapolate for a
value close to the existing data, the line is extended and the concerned
value of the dependent variable is calculated for the concerned
independent variable. A tangent line can be drawn at the last data point
of the given data and extended beyond for extrapolation.
Consider the following graph that represents the fuel required by a
certain car as a function of the distance traveled by that car:
Linear Extrapolation
Management | 2025
As can be noticed from the figure, the data is best represented by the linear
equation
Now if we want to have an estimate of the amount of the fuel the car
will consume for traveling 70 kilometers, we need to substitute
by 70 in the equation
= 3.2
So, the estimated amount of fuel the car will consume for traveling 70
kilometers will be 3.2 kilometers.
Linear Extrapolation
Management | 2025
Polynomial Extrapolation
Management | 2025
Polynomial extrapolation is typically done by means of
Lagrange interpolation or using Newton's method of finite
differences to create a Newton series that fits the data. The
resulting polynomial may be used to extrapolate the data.
High-order polynomial extrapolation must be used with
due care.
Polynomial Extrapolation
Management | 2025
Management | 2025
Exponential Extrapolation:
Assumes that the data follows an exponential growth or decay pattern.
Useful for situations where the rate of change is proportional to the
current value.
Logarithmic Extrapolation:
Assumes that the relationship between variables follows a logarithmic
pattern. Suitable when the rate of change slows down as the variable
increases.
Moving Averages: Calculates the average of a specific
number of consecutive data points. Simple or weighted moving averages
can be used to smooth out fluctuations and identify trends for
extrapolation
Management | 2025
Time Series Analysis:
Examines historical data over time to identify patterns and trends. Methods like
autoregressive integrated moving average (ARIMA) and seasonal decomposition of
time series (STL) can be used for more sophisticated time series extrapolation
Curve Fitting:
Involves fitting a mathematical curve or function to the existing data. Least squares
regression is a common technique for finding the curve that minimizes the sum of
squared differences between observed and predicted values.
Machine Learning Models:
Regression models, such as linear regression or polynomial regression, can be trained
on existing data to learn patterns and make predictions. Neural networks and other
advanced machine learning algorithms can be powerful tools for extrapolation but
require careful training and validation.
Expert Opinion and Judgment
In some cases, expert judgment and domain
knowledge can be used to make qualitative
extrapolations. This method is subjective
and should be used cautiously, especially in
situations where data is limited.
Extrapolation is a statistical and mathematical technique used to predict or
estimate values beyond the range of observed data. It involves extending or
projecting existing trends, patterns, or relationships in data to make
predictions about future or unseen values. While extrapolation can be a useful
tool, it comes with certain assumptions and limitations that need to be
considered.
How Extrapolation Works
Analyze the existing data to identify any
patterns, trends, or relationships that can be
represented mathematically. This often involves
using techniques such as regression analysis to
find a mathematical equation that describes the
observed data.
Identifying Patterns or Trends
How Extrapolation Works
Extrapolation starts with a thorough
understanding of existing data. This data can
be in the form of measurements, observations,
or historical records. The data should display a
discernible trend or pattern that can be used to
make predictions.
Understanding Existing Data
Once the mathematical model is established, use
it to predict values beyond the range of the
observed data. Extrapolation involves extending
the curve or line established by the model into
the future or beyond the range of available data.
Extrapolation
How Extrapolation Works
Develop a mathematical model based on the
identified patterns or trends. This model can
be a linear equation, a polynomial equation, an
exponential function, or another suitable form.
The goal is to create a formula that represents
the relationship between the independent
variable (input) and the dependent variable
(output).
Mathematical Model
Extrapolation comes with a risk of inaccuracy,
especially when predicting far into the future or
outside the observed range. Small errors in the
model or unforeseen events can lead to
significant inaccuracies in predictions.
Risk of Inaccuracy
How Extrapolation Works
Extrapolation assumes that the patterns
observed in the existing data will continue into
the extrapolated range. However, this
assumption may not always hold true,
especially if unforeseen factors or changes
occur that disrupt the established patterns.
Assumptions and Limitations:
How Extrapolation Works
Validate the extrapolation by comparing predicted values with
actual data when it becomes available. Continuous monitoring and
adjustments to the model may be necessary as new data becomes
available or as conditions change.
Validation and Monitoring
Benefits of Extrapolation:
Extrapolation is the process of estimating, projecting, or
extending data or trends beyond the range of known values.
While it can be a useful tool in various fields, it's important to
recognize its limitations and potential risks. Here are some
potential benefits of extrapolation:
Overview
Benefits of Extrapolation:
Extrapolation allows for the estimation of future trends based on
existing data. This can be particularly valuable in fields such as
finance, economics, and market research.
Prediction of Future Trends
Proponents
Prediction of Future Trends
Businesses and organizations can use extrapolation to plan for
future resource needs. For example, anticipating future demand
for a product or service can help in making decisions about
production levels, staffing, and inventory.
Resource Planning
Benefits of Extrapolation:
In scientific research, extrapolation can be used to extend the
results of experiments or studies beyond the observed range. This
can be helpful when it is not feasible or practical to conduct
experiments over a broader range of conditions.
Scientific Research
Proponents
Prediction of Future Trends
Extrapolation can save time and resources by providing estimates
without the need for additional data collection. This is particularly
relevant in situations where collecting new data would be time
consuming or expensive.
Time and Cost Savings
Benefits of Extrapolation:
Governments and policymakers may use extrapolation to forecast
future population growth, economic indicators, and other factors
to inform policy decisions.
Policy Planning
Proponents
Prediction of Future Trends
Extrapolation is often used in conjunction with interpolation to
fill in missing data points between observed values. This is
common in various data analysis and visualization tasks.
Interpolation and Data Filling
Interpolation and Data Filling:
Proponents
Prediction of Future Trends
Despite these benefits, it's important to be cautious with extrapolation due to several
potential pitfalls:
Assumption of Linearity:
Extrapolation assumes that trends observed in the existing data will
continue in a linear manner. However, this may not always be the case, especially if there are
underlying nonlinear relationships.
Data Limitations:
Extrapolation is only as reliable as the data it is based on. If the underlying data
is flawed, incomplete, or not representative, the extrapolated results may be inaccurate.
Changing Conditions:
Extrapolation assumes that the conditions influencing the data will remain
constant. Changes in economic, environmental, or other factors can significantly impact the
accuracy of extrapolated predictions.
Risk of Overconfidence:
Relying too heavily on extrapolation without considering uncertainties and
potential variations can lead to overconfidence in predictions.
Interpolation
Interpolation involves estimating values that fall between known data
points. It is a method used to fill in the gaps within a dataset, providing a
more complete picture of trends or values within a specific range.
Interpolation
Interpolation is the act of estimating or determining an unknown value
within the range of two known values. This method is frequently applied
in the context of defined piecewise functions in mathematics, particularly
those characterized by discontinuous graphs.
Interpolation Formula
The procedure of interpolation entails constructing a seamless curve
between two given data points. This curve is formed by plotting a point
on the graph where the distance between two points is equivalent to half
of their disparity in coordinates. This process holds significance as it
guarantees that data points are evenly distributed along the line.
Interpolation Formula
Interpolation serves as a tool within the realm of machine learning, although its
frequent necessity is relatively low. This is attributed to the ability to input data into
computers, allowing them to make informed predictions, particularly in scenarios
involving extensive datasets. This application proves valuable across various fields,
ranging from medical research to weather forecasting.
In theory, interpolation can aid in extrapolating information from known situations to
expand knowledge into uncharted territories, a concept often referred to as
extrapolation.
Types of Interpolation
Several key types of interpolation are employed to establish smooth transitions
between two points:
Interpolation Formula
Interpolation serves as a tool within the realm of machine learning, although
its frequent necessity is relatively low. This is attributed to the ability to input
data into computers, allowing them to make informed predictions,
particularly in scenarios involving extensive datasets. This application proves
valuable across various fields, ranging from medical research to weather
forecasting.
In theory, interpolation can aid in extrapolating information from known
situations to expand knowledge into uncharted territories, a concept often
referred to as extrapolation.
Types of Interpolation
Several key types of interpolation are employed to establish smooth
Interpolation Formula
Cubic Spline Interpolation: This technique forms a curved line, also known as "quadratic spline
interpolation" or "quadratic smoothing," to connect two points on a graph.
Lagrange Basis Interpolation:
Similar to cubic spline interpolation, this method creates a curved line between two points but
differs in how it selects potential curves. Lagrange basis interpolation considers various curves and
chooses the one that best fits the dataset.
Linear Interpolation:
This method involves a straight line or curve between two points, applied when an exact
relationship exists between values, but no specific data points are available.
Nearest Neighbor Interpolation:
Using the closest known value to predict the value between two known values, this method is useful
when there is a limited number of data points.
Spline Interpolation:
Employing a curve that passes through as many data points as possible, this technique eliminates
gaps in the dataset, enhancing robustness against errors in measurement or sampling.
Uses of Interpolation
Interpolation is a mathematical and computational
technique used to estimate values that fall between
known values. It involves constructing a function
that passes through a set of given data points.
Interpolation has various applications across
different fields:
Uses of Interpolation
1.Computer Graphics:
Interpolation is widely used in computer graphics to generate
smooth curves and surfaces. For example, in 3D graphics, interpolation can be
used to create smooth animations between keyframes.
2. Geographic Information Systems (GIS):
In GIS applications, interpolation is used to estimate values
of geographic features at unobserved locations based on the values at known
locations. This is commonly used in terrain modeling and mapping.
3. Numerical Analysis:
Interpolation is a fundamental tool in numerical analysis for approximating
functions and solving mathematical problems. It is used in numerical methods
such as finite element analysis and finite difference methods.
Uses of Interpolation
4. Signal Processing:
Interpolation is employed in signal processing to reconstruct signals that
have been sampled at discrete points. It helps in reducing aliasing effects
and can improve the accuracy of signal representation.
5. Image Processing:
In image processing, interpolation is used to resize images, especially when
enlarging or reducing the size. Algorithms like bilinear interpolation or
bicubic interpolation help generate smooth and visually pleasing results.
6. Physics and Engineering:
Interpolation is applied in experimental data analysis, where it helps to
estimate values between measured data points. This is common in physics
experiments, engineering simulations, and other scientific studies
Uses of Interpolation
7. Finance:
Financial analysts use interpolation to estimate values of financial
instruments at intermediate points in time. It is often used in the pricing of
financial derivatives.
8. Animation and Computer Aided Design (CAD):
Interpolation is crucial in animation to create fluid motion between
keyframes. In CAD applications, it is used to create smooth transitions
between different design states.
9. Weather Prediction:
Meteorologists use interpolation to estimate weather conditions at
unobserved locations based on available data from weather stations. This is
essential for creating weather models and forecasting.
10. Machine Learning and Data Analysis:
Interpolation is used to fill in missing
data points in datasets, especially in timeseries data. This helps in
preprocessing data for machine learning algorithms and statistical analysis.
11. Audio Processing:
Interpolation is used in audio processing to up sample or
down sample signals. This is essential for converting between different
sampling rates while maintaining the integrity of the audio signal.
Uses of Interpolation
Thank You
Lars Peeters
Management | 2025
Contact us:
hafeezkausar.hashmi@gmail.com
https://www.facebook.com/kausar0791
https://www.linkedin.com/in/dr-hafiz-kosar-284484186/
+92-314-3205571

Extrapolation & Interpolation.pptx

  • 1.
  • 2.
    • An extrapolationis similar to an educated guess or a hypothesis, involving the use of facts and observations about a present or known situation to predict future outcomes. • In data science, extrapolation is a statistical technique employed to estimate values of data points beyond the range covered by the known values in a dataset. • It is a mathematical approach used to project or extend existing trends, patterns, or relationships in data, making predictions or estimates for values outside the original set of data points. Extrapolation
  • 3.
    • Extrapolation assumesthat observed patterns or trends in known data will persist in unobserved or future data points. • Despite its utility in making predictions, extrapolation has certain assumptions and limitations. • Caution is required when using extrapolation techniques, as extending too far beyond the observed data range can result in inaccurate or unreliable predictions. • Changes in underlying factors that influence the data, not considered in the extrapolation, can affect the accuracy of predictions. • Careful consideration of the context is essential when employing extrapolation to ensure its reliability and relevance. Extrapolation
  • 4.
    "Extrapolation is derivedfrom the word 'extra,' which means 'outside,' and a shortened form of the term 'interpolation.' While 'interpolation' may sound unfamiliar, it refers to the insertion between two points. Therefore, extrapolation involves inserting points outside of any existing data points. For instance, consider if you have information about Monday and Tuesday. In such a scenario, you could potentially make an extrapolation about Wednesday." Etymology
  • 5.
    Extrapolation Methods Management |2025 Various extrapolation methods are employed to predict and analyze trends in data. Among these, two widely used methods are: Extrapolation is the process of estimating or predicting values outside the range of known or observed data. It involves extending a trend or pattern identified in existing data to make predictions about future or unseen values. There are various methods of extrapolation, each with its own assumptions, advantages, and limitations. Here are some common extrapolation methods:
  • 6.
    Linear Extrapolation Management |2025 Assumes a constant rate of change between data points. Uses a straight line to extend the trend observed in the existing data. In the case of linear extrapolation, the data points are plotted on a graph and a linear equation is used to best represent the data. Then to extrapolate for a value close to the existing data, the line is extended and the concerned value of the dependent variable is calculated for the concerned independent variable. A tangent line can be drawn at the last data point of the given data and extended beyond for extrapolation. Consider the following graph that represents the fuel required by a certain car as a function of the distance traveled by that car:
  • 7.
    Linear Extrapolation Management |2025 As can be noticed from the figure, the data is best represented by the linear equation Now if we want to have an estimate of the amount of the fuel the car will consume for traveling 70 kilometers, we need to substitute by 70 in the equation = 3.2 So, the estimated amount of fuel the car will consume for traveling 70 kilometers will be 3.2 kilometers.
  • 8.
  • 9.
    Polynomial Extrapolation Management |2025 Polynomial extrapolation is typically done by means of Lagrange interpolation or using Newton's method of finite differences to create a Newton series that fits the data. The resulting polynomial may be used to extrapolate the data. High-order polynomial extrapolation must be used with due care.
  • 10.
  • 11.
    Management | 2025 ExponentialExtrapolation: Assumes that the data follows an exponential growth or decay pattern. Useful for situations where the rate of change is proportional to the current value. Logarithmic Extrapolation: Assumes that the relationship between variables follows a logarithmic pattern. Suitable when the rate of change slows down as the variable increases. Moving Averages: Calculates the average of a specific number of consecutive data points. Simple or weighted moving averages can be used to smooth out fluctuations and identify trends for extrapolation
  • 12.
    Management | 2025 TimeSeries Analysis: Examines historical data over time to identify patterns and trends. Methods like autoregressive integrated moving average (ARIMA) and seasonal decomposition of time series (STL) can be used for more sophisticated time series extrapolation Curve Fitting: Involves fitting a mathematical curve or function to the existing data. Least squares regression is a common technique for finding the curve that minimizes the sum of squared differences between observed and predicted values. Machine Learning Models: Regression models, such as linear regression or polynomial regression, can be trained on existing data to learn patterns and make predictions. Neural networks and other advanced machine learning algorithms can be powerful tools for extrapolation but require careful training and validation.
  • 13.
    Expert Opinion andJudgment In some cases, expert judgment and domain knowledge can be used to make qualitative extrapolations. This method is subjective and should be used cautiously, especially in situations where data is limited.
  • 14.
    Extrapolation is astatistical and mathematical technique used to predict or estimate values beyond the range of observed data. It involves extending or projecting existing trends, patterns, or relationships in data to make predictions about future or unseen values. While extrapolation can be a useful tool, it comes with certain assumptions and limitations that need to be considered. How Extrapolation Works
  • 15.
    Analyze the existingdata to identify any patterns, trends, or relationships that can be represented mathematically. This often involves using techniques such as regression analysis to find a mathematical equation that describes the observed data. Identifying Patterns or Trends How Extrapolation Works Extrapolation starts with a thorough understanding of existing data. This data can be in the form of measurements, observations, or historical records. The data should display a discernible trend or pattern that can be used to make predictions. Understanding Existing Data
  • 16.
    Once the mathematicalmodel is established, use it to predict values beyond the range of the observed data. Extrapolation involves extending the curve or line established by the model into the future or beyond the range of available data. Extrapolation How Extrapolation Works Develop a mathematical model based on the identified patterns or trends. This model can be a linear equation, a polynomial equation, an exponential function, or another suitable form. The goal is to create a formula that represents the relationship between the independent variable (input) and the dependent variable (output). Mathematical Model
  • 17.
    Extrapolation comes witha risk of inaccuracy, especially when predicting far into the future or outside the observed range. Small errors in the model or unforeseen events can lead to significant inaccuracies in predictions. Risk of Inaccuracy How Extrapolation Works Extrapolation assumes that the patterns observed in the existing data will continue into the extrapolated range. However, this assumption may not always hold true, especially if unforeseen factors or changes occur that disrupt the established patterns. Assumptions and Limitations:
  • 18.
    How Extrapolation Works Validatethe extrapolation by comparing predicted values with actual data when it becomes available. Continuous monitoring and adjustments to the model may be necessary as new data becomes available or as conditions change. Validation and Monitoring
  • 19.
    Benefits of Extrapolation: Extrapolationis the process of estimating, projecting, or extending data or trends beyond the range of known values. While it can be a useful tool in various fields, it's important to recognize its limitations and potential risks. Here are some potential benefits of extrapolation: Overview
  • 20.
    Benefits of Extrapolation: Extrapolationallows for the estimation of future trends based on existing data. This can be particularly valuable in fields such as finance, economics, and market research. Prediction of Future Trends Proponents Prediction of Future Trends Businesses and organizations can use extrapolation to plan for future resource needs. For example, anticipating future demand for a product or service can help in making decisions about production levels, staffing, and inventory. Resource Planning
  • 21.
    Benefits of Extrapolation: Inscientific research, extrapolation can be used to extend the results of experiments or studies beyond the observed range. This can be helpful when it is not feasible or practical to conduct experiments over a broader range of conditions. Scientific Research Proponents Prediction of Future Trends Extrapolation can save time and resources by providing estimates without the need for additional data collection. This is particularly relevant in situations where collecting new data would be time consuming or expensive. Time and Cost Savings
  • 22.
    Benefits of Extrapolation: Governmentsand policymakers may use extrapolation to forecast future population growth, economic indicators, and other factors to inform policy decisions. Policy Planning Proponents Prediction of Future Trends Extrapolation is often used in conjunction with interpolation to fill in missing data points between observed values. This is common in various data analysis and visualization tasks. Interpolation and Data Filling
  • 23.
    Interpolation and DataFilling: Proponents Prediction of Future Trends Despite these benefits, it's important to be cautious with extrapolation due to several potential pitfalls: Assumption of Linearity: Extrapolation assumes that trends observed in the existing data will continue in a linear manner. However, this may not always be the case, especially if there are underlying nonlinear relationships. Data Limitations: Extrapolation is only as reliable as the data it is based on. If the underlying data is flawed, incomplete, or not representative, the extrapolated results may be inaccurate. Changing Conditions: Extrapolation assumes that the conditions influencing the data will remain constant. Changes in economic, environmental, or other factors can significantly impact the accuracy of extrapolated predictions. Risk of Overconfidence: Relying too heavily on extrapolation without considering uncertainties and potential variations can lead to overconfidence in predictions.
  • 24.
    Interpolation Interpolation involves estimatingvalues that fall between known data points. It is a method used to fill in the gaps within a dataset, providing a more complete picture of trends or values within a specific range.
  • 25.
    Interpolation Interpolation is theact of estimating or determining an unknown value within the range of two known values. This method is frequently applied in the context of defined piecewise functions in mathematics, particularly those characterized by discontinuous graphs. Interpolation Formula The procedure of interpolation entails constructing a seamless curve between two given data points. This curve is formed by plotting a point on the graph where the distance between two points is equivalent to half of their disparity in coordinates. This process holds significance as it guarantees that data points are evenly distributed along the line.
  • 26.
    Interpolation Formula Interpolation servesas a tool within the realm of machine learning, although its frequent necessity is relatively low. This is attributed to the ability to input data into computers, allowing them to make informed predictions, particularly in scenarios involving extensive datasets. This application proves valuable across various fields, ranging from medical research to weather forecasting. In theory, interpolation can aid in extrapolating information from known situations to expand knowledge into uncharted territories, a concept often referred to as extrapolation. Types of Interpolation Several key types of interpolation are employed to establish smooth transitions between two points:
  • 27.
    Interpolation Formula Interpolation servesas a tool within the realm of machine learning, although its frequent necessity is relatively low. This is attributed to the ability to input data into computers, allowing them to make informed predictions, particularly in scenarios involving extensive datasets. This application proves valuable across various fields, ranging from medical research to weather forecasting. In theory, interpolation can aid in extrapolating information from known situations to expand knowledge into uncharted territories, a concept often referred to as extrapolation. Types of Interpolation Several key types of interpolation are employed to establish smooth
  • 28.
    Interpolation Formula Cubic SplineInterpolation: This technique forms a curved line, also known as "quadratic spline interpolation" or "quadratic smoothing," to connect two points on a graph. Lagrange Basis Interpolation: Similar to cubic spline interpolation, this method creates a curved line between two points but differs in how it selects potential curves. Lagrange basis interpolation considers various curves and chooses the one that best fits the dataset. Linear Interpolation: This method involves a straight line or curve between two points, applied when an exact relationship exists between values, but no specific data points are available. Nearest Neighbor Interpolation: Using the closest known value to predict the value between two known values, this method is useful when there is a limited number of data points. Spline Interpolation: Employing a curve that passes through as many data points as possible, this technique eliminates gaps in the dataset, enhancing robustness against errors in measurement or sampling.
  • 29.
    Interpolation Formula Cubic SplineInterpolation: This technique forms a curved line, also known as "quadratic spline interpolation" or "quadratic smoothing," to connect two points on a graph. Lagrange Basis Interpolation: Similar to cubic spline interpolation, this method creates a curved line between two points but differs in how it selects potential curves. Lagrange basis interpolation considers various curves and chooses the one that best fits the dataset. Linear Interpolation: This method involves a straight line or curve between two points, applied when an exact relationship exists between values, but no specific data points are available. Nearest Neighbor Interpolation: Using the closest known value to predict the value between two known values, this method is useful when there is a limited number of data points. Spline Interpolation: Employing a curve that passes through as many data points as possible, this technique eliminates gaps in the dataset, enhancing robustness against errors in measurement or sampling.
  • 30.
    Uses of Interpolation Interpolationis a mathematical and computational technique used to estimate values that fall between known values. It involves constructing a function that passes through a set of given data points. Interpolation has various applications across different fields:
  • 31.
    Uses of Interpolation 1.ComputerGraphics: Interpolation is widely used in computer graphics to generate smooth curves and surfaces. For example, in 3D graphics, interpolation can be used to create smooth animations between keyframes. 2. Geographic Information Systems (GIS): In GIS applications, interpolation is used to estimate values of geographic features at unobserved locations based on the values at known locations. This is commonly used in terrain modeling and mapping. 3. Numerical Analysis: Interpolation is a fundamental tool in numerical analysis for approximating functions and solving mathematical problems. It is used in numerical methods such as finite element analysis and finite difference methods.
  • 32.
    Uses of Interpolation 4.Signal Processing: Interpolation is employed in signal processing to reconstruct signals that have been sampled at discrete points. It helps in reducing aliasing effects and can improve the accuracy of signal representation. 5. Image Processing: In image processing, interpolation is used to resize images, especially when enlarging or reducing the size. Algorithms like bilinear interpolation or bicubic interpolation help generate smooth and visually pleasing results. 6. Physics and Engineering: Interpolation is applied in experimental data analysis, where it helps to estimate values between measured data points. This is common in physics experiments, engineering simulations, and other scientific studies
  • 33.
    Uses of Interpolation 7.Finance: Financial analysts use interpolation to estimate values of financial instruments at intermediate points in time. It is often used in the pricing of financial derivatives. 8. Animation and Computer Aided Design (CAD): Interpolation is crucial in animation to create fluid motion between keyframes. In CAD applications, it is used to create smooth transitions between different design states. 9. Weather Prediction: Meteorologists use interpolation to estimate weather conditions at unobserved locations based on available data from weather stations. This is essential for creating weather models and forecasting.
  • 34.
    10. Machine Learningand Data Analysis: Interpolation is used to fill in missing data points in datasets, especially in timeseries data. This helps in preprocessing data for machine learning algorithms and statistical analysis. 11. Audio Processing: Interpolation is used in audio processing to up sample or down sample signals. This is essential for converting between different sampling rates while maintaining the integrity of the audio signal. Uses of Interpolation
  • 35.
    Thank You Lars Peeters Management| 2025 Contact us: hafeezkausar.hashmi@gmail.com https://www.facebook.com/kausar0791 https://www.linkedin.com/in/dr-hafiz-kosar-284484186/ +92-314-3205571