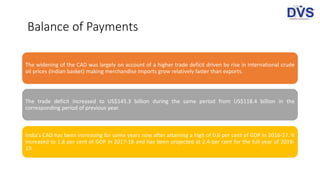
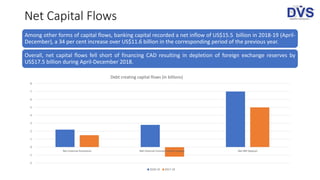
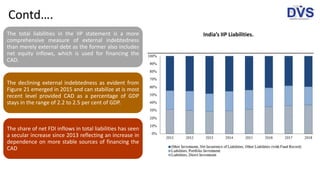
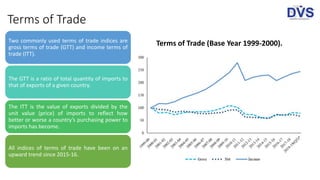
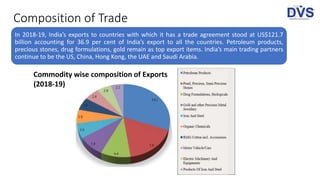
SlideShare a Scribd company logo
External Sector
CA. Divakar Vijayasarathy
DVS Advisors LLP
India-Singapore-London-Dubai-Malaysia-Africa
www.dvsca.com
Credits and Acknowledgments
Subash R
Presentation Schema
Introduction
Global Economic
Environment
Balance of
Payments
External Debt
Nominal and
Real Exchange
Rate
Terms of Trade
Composition of
Trade
Trade Policy
Trade Related
Logistics
Anti-Dumping
and Safeguard
Measures
Conclusion
Introduction
India’s macroeconomic situation on the external side continues to be stable.
Though the current account deficit is projected at 2.4 per cent of GDP in 2018-19, up from 1.8 per cent in 2017-
18, this is within reasonable levels.
The widening of the current account deficit has been driven by a deterioration of trade deficit from 6.0 per
cent of GDP to 6.7 per cent across the two years.
Rise in crude prices in Q4 of 2018-19 and a decline in the growth of merchandize exports have led to the
deterioration of trade deficit.
The income terms of trade, a metric that measures the purchasing power to import, has been on a rising trend,
possibly because the growth of crude prices has still not exceeded the growth of India’s export prices.
The exchange rate in 2018-19 has been more volatile than in the previous year, mainly due to volatility in crude
prices, but not much due to net portfolio flows.
Global Economic Environment
Heightened US-China trade tensions has been stated as one of the reasons behind the global
slowdown that has spilled into other economies including India through the channel of exports.
The WEO further states that growing trade protectionism in the world, of which US-China trade
tensions is the most recent manifestation, places at risk the low relative price of machinery and
equipment that over the years has declined, partly due to increasing trade integration.
World commercial services on the other hand recorded a strong growth of 7.7 per cent in 2018 but
was still lower than 8.4 per cent in 2017.
However, goods related services growth shot up to 10.6 per cent in 2018, up from 8.3 per cent in
the previous year.
In its April 2019 Press Release, WTO has stated that apart from
trade tensions, trade and output were also influenced by
temporary shocks, including the federal government shutdown
in the United States and production problems in the automotive
sector in Germany toward the end of the year.
Along with the slowing down of world trade seen in 2018 there
has been a spatial shift in the nature of BoP balances as well in
the last few years.
Advanced economies had a current account deficit of US$28.1
billion in 2011, which has been reducing consistently since then
and turned into current account surplus of US$444.7 billion in
2017. Emerging and developing economies on the other hand
slipped from their current account surplus position of US$379.0
billion in 2011 to US$0.1 billion in 2017.
Contd…
Balance of Payments
The widening of the CAD was largely on account of a higher trade deficit driven by rise in international crude
oil prices (Indian basket) making merchandise imports grow relatively faster than exports.
The trade deficit increased to US$145.3 billion during the same period from US$118.4 billion in the
corresponding period of previous year.
India’s CAD has been increasing for some years now after attaining a high of 0.6 per cent of GDP in 2016-17. It
increased to 1.8 per cent of GDP in 2017-18 and has been projected at 2.4 per cent for the full year of 2018-
19.
Current Account Deficit and Trade Deficit as per
cent of GDP
FDI Inflow
During 2018-19, net foreign investment
declined to US$31.3 billion as compared to
US$52.4 billion in the corresponding period of
2017-18.
As a proportion of GDP, net FDI fell from 1.6 per
cent in 2016-17 to 1.1 per cent in 2017-18,
before rising to 1.2 per cent in 2018-19
Robust foreign direct investment (FDI) inflows,
were more than outweighed by withdrawals
under portfolio investment reflecting an
escalation of global risk aversion.
Foreign Direct Investment as a per cent of GDP
Net Capital Flows
Among other forms of capital flows, banking capital recorded a net inflow of US$15.5 billion in 2018-19 (April-
December), a 34 per cent increase over US$11.6 billion in the corresponding period of the previous year.
Overall, net capital flows fell short of financing CAD resulting in depletion of foreign exchange reserves by
US$17.5 billion during April-December 2018.
-2
-1
0
1
2
3
4
5
6
7
8
Net External Assistance Net External Commercial Borrowings Net NRI Deposit
Debt creating capital flows (in billions)
2018-19 2017-18
Net Foreign Portfolio Investment
In 2009-14 net portfolio investment funded
45.6 per cent of current account deficit but
declined to 17.1 per cent in 2014-19.
The financing of the current account deficit in
2014-19 thus became less vulnerable to
capital flight as compared to the previous
period.
The reduced dependency on FPIs to fund CAD
in recent times is also reflected in the fact
that growth of forex reserves in the country
bears no correlation with movements in net
FPI.
Monthly Movement in Net FPI and Foreign Exchange Reserves.
Foreign Exchange Reserves
India’s foreign exchange reserves stood at US$422.2 billion as on June 14, 2019.
The foreign exchange reserves in nominal terms (including the valuation effects)
decreased by US $29.0 billion during April-December 2018 as against an increase of
US$39.1 billion during the same period of the preceding year.
However, on a balance of payments basis (i.e., excluding valuation effects), the foreign
exchange reserves decreased by US$17.5 billion during April-December 2018 as against
an increase of US$30.3 billion during the corresponding period of the same year.
External Debt
India’s External Debt was
US$521.1 billion at December
2018, 1.6 per cent lower than its
level at March 2018.
The long-term debt declined by
2.4 per cent to US$417.3 billion at
December 2018 over March 2018.
Short term debt grew by 1.7 per
cent in December 2018 compared
to March 2018, primarily due to
increase in trade related credits.
Foreign Exchange and External Debt
Foreign Exchange cover to total external debt deteriorated to 75.5 per cent at end-
December 2018 from 80.2 per cent at end-March 2018, with the ratio of short term
debt by original maturity to foreign exchange reserves rising to 26.4 per cent in end-
December 2018 from 24.1 per cent at end-March 2018.
The share of short term debt by residual maturity in total external debt, which is
useful in assessing liquidity requirements to service contractual obligations within a
year, was 43.5 per cent at end-December 2018 as against 42.0 per cent at end-
March 2018 reflecting increase in liquid conditions.
Foreign Exchange Reserves and Debt.
External Debt to Key Indicators.
Debt-Service Ratio
Debt Service ratio indicates the claim that
servicing of external debt makes on
current receipts and is, therefore, a
measure of strain on BoP due to servicing
of debt service obligations.
Debt Service ratio increased till 2016 and
then declined continuously since 2016
from 8.8 per cent to 8.3 per cent in 2017 to
7.5 per cent in 2018 (end-March).
The declining ratios of debt service, total
external debt to exports and debt service
to exports in 201617 and 2017-18 may be
seen as favourable for India.
Indicators of Debt Sustainability.
Net International Investment Position
The International Investment Position (IIP) is a statistical statement that shows at a point in time the value of
financial assets of residents of an economy that are claims on non-residents or are gold bullion held as reserve
assets; and the liabilities of residents of an economy to non-residents.
The difference between the assets and liabilities is the net position in the IIP and represents either a net claim
on or a net liability to the rest of the world.
A positive NIIP value indicates a nation is a creditor nation, while a negative value indicates it is a debtor
nation.
Top Ten Economies Having Net IIP Deficit
Among the top ten economies having Net IIP
deficit in 2018, United States is ranked first with
net IIP deficit of US$9.7 trillion, followed by
Spain (US$1.1 trillion) and Australia (US$0.7
trillion).
In comparison to previous year 2017, India’s
net IIP deficit increased by 2.8 per cent from
US$426.6 billion in 2017 to US$438.4 billion in
2018.
Net IIP Deficit of Top 10 economies in 2018
There is continuous deterioration in net IIP of India from 2011 till 2018, on account of
consistent increase in IIP liabilities over the corresponding period of time.
India’s International Investment Position (US$ Million)
Contd…
However as per centage of GDP, IIP liabilities, which had earlier increased from 2011 to 2015, have
been declining since then.
Total liabilities as per cent of GDP.Contd…
The total liabilities in the IIP statement is a more
comprehensive measure of external indebtedness
than merely external debt as the former also includes
net equity inflows, which is used for financing the
CAD.
The declining external indebtedness as evident from
Figure 21 emerged in 2015 and can stabilize at is most
recent level provided CAD as a percentage of GDP
stays in the range of 2.2 to 2.5 per cent of GDP.
The share of net FDI inflows in total liabilities has seen
a secular increase since 2013 reflecting an increase in
dependence on more stable sources of financing the
CAD
India’s IIP Liabilities.
Contd….
Nominal and Real Exchange Rate Terms and Trade
During 2018-19, Indian rupee traded with a depreciating trend against US dollar and touched a historical low
of 74.4 per US$ (reference rate) on October 11, 2018 before recovering by 4.1 per cent to 69.2 per US$ on
March 29, 2019.
The Indian rupee was one of the least volatile Emerging Market (EM) currencies during 2017-18 and traded in
the range of 63.63 to 65.08 per US$.
During H1 of 2018-19, rupee remained weak due to concerns related to widening of CAD owing to rising crude
oil prices.
Thereafter, softer monetary policy stance across major central banks and easing of crude oil prices coupled
with return of risk-on sentiment triggered FPIs inflows and helped rupee to recover in Q4 of 2018-19.
Apart from rupee depreciating by 7.8 per cent vis-à-vis US dollar in 2018-19, it also depreciated
against other major currencies.
It depreciated by 7.7 per cent against Yen, and 6.8 per cent against Euro and Pound Sterling each.
Movement of Rupee against US Dollar, Euro, Pound Sterling and Japanese Yen
Contd…
NEER and REER
In terms of the 6 and 36 currency Nominal Effective
Exchange Rate (NEER) (trade based weights), rupee
depreciated by 7.1 and 5.6 per cent respectively in
the fiscal year 2018-19 over 2017-18.
In terms of 6 and 36 currency Real Effective
Exchange Rate (REER), rupee depreciated by 5.8 per
cent and 4.8 per cent respectively in 2018-19 over
2017-18.
The sharpest depreciation in October 2018 was due
to strong economic fundamentals, softening of
crude oil prices, sustained selling of the dollar by
exporters and banks.
Exchange Rate Volatility
• The below table uses the highest and lowest monthly exchange rate within a year to calculate variation
between month highs and lows.
• It indicates that the rupee witnessed a spike in volatility in 2018-19 after two years of relative stability.
Exchange Rate Volatility
Net Foreign Portfolio Investment (FPI) Volatility
The below figures indicates that net FPI witnessed highest volatility in 2013-14 after which it has been
relatively stable in 2018-19.
Net FPI Volatility. Net FPI Highs and Lows.
It is evident that movements in exchange rate are closely associated with movements in crude oil
price and net FPI flows.
The rupee remained volatile in 2018-19 on account of both global and domestic factors including
rising crude oil prices, erratic trade balance, strengthening of dollar and continuous FPI outflows.
Additional factors impacting the rupee include trade war between US and China and US sanctions
on Iran and interest rate hikes by the US Federal Reserve.
Contd….
Terms of Trade
Two commonly used terms of trade indices are
gross terms of trade (GTT) and income terms of
trade (ITT).
The GTT is a ratio of total quantity of imports to
that of exports of a given country.
The ITT is the value of exports divided by the
unit value (price) of imports to reflect how
better or worse a country’s purchasing power to
imports has become.
All indices of terms of trade have been on an
upward trend since 2015-16.
Terms of Trade (Base Year 1999-2000).
Composition of Trade
In 2018-19, India’s exports to countries with which it has a trade agreement stood at US$121.7
billion accounting for 36.9 per cent of India’s export to all the countries. Petroleum products,
precious stones, drug formulations, gold remain as top export items. India’s main trading partners
continue to be the US, China, Hong Kong, the UAE and Saudi Arabia.
Commodity wise composition of Exports
(2018-19)
India’s imports in 2018-19 from countries with which it has a trade agreement stood at US$266.9
billion accounting for 52.0 per cent of India’s imports from all the countries.
Crude petroleum, pearl, precious, semi-precious stones and gold remain as top import items.
Commodity-wise composition of imports.
Contd…
Major Trading Partners
India’s largest export destination country
continues to be the United States of America
(USA), which accounted for 16 per cent of
India’s exports (in value terms) in 2018-19,
followed by United Arab Emirates (UAE), China
and Hong Kong.
However, in 2018-19, growth of India’s exports
to the Netherlands was the highest (40.7 per
cent), followed by China (25.6 per cent) and
Nepal (17.4 per cent).
Top 10 Export Destinations of India 2018-19.Export sources
Import Sources
China continues to be the largest source of imports of
India accounting for 13.7 per cent of the total imported
value in 2018-19.
The other important sources of imports are the USA, UAE
and Saudi Arabia.
However, India’s imports from China fell from US$76.4
billion in 2017-18 to US$70.3 billion in 2018-19,
registering a negative growth.
Top 10 Import Sources of India (2018-19)
Contd…
Trade Policy
In Europe
India is a part of European Free
Trade Association (EFTA),
consisting of Switzerland,
Norway, Iceland and
Liechtenstein.
In 2018-19, India exports to and
imports from EFTA stood at
US$1,534.00 million and
US$18,076.88 million
respectively.
Among SAARC countries,
India and Bangladesh have a
bilateral trade agreement
In 2018-19, India’s exports to
and imports from Bangladesh
stood at US$8,933.47 million
and US$1,043.03 million
respectively.
With Neighbours,
Review meetings for India-Nepal Treaty
of Trade is going on.
With Sri Lanka, India has India-Sri Lanka
Free Trade Agreement (ISLFTA), under
which duty-free access for almost all the
products except a few is provided.
In 201819, India’s exports to and imports
from Sri Lanka stood at US$4,707.14
million and US$1,473.10 million
respectively.
Among Latin American Countries,
India has Preferential Trade
Agreements (PTA) with
MERCOSUR (Argentina, Brazil,
Paraguay and Uruguay) and Chile.
Possibilities are being explored
for PTA with Colombia also.
In 2018-19, India exports to and
imports from MERCOSUR block
stood at US$4,705.08 million and
US$6,425.35 million respectively.
Under North America Free
Trade Agreement (NAFTA),
Negotiations are underway for India
Canada Comprehensive Economic
Policy Agreement (CEPA).
India is also negotiating bilateral
Comprehensive Economic
Cooperation Agreement (CECA)
with Australia and New Zealand.
Negotiations are underway for
Comprehensive Economic
Cooperation and Partnership
Agreement (CECPA) with Mauritius
and FTA with Israel.
India- ASEAN,
Within Association of South
East Asian Nations, India has
Comprehensive Economic
Cooperation Agreement (CECA)
with Singapore, Thailand and
Malaysia.
In 2018-19, India exports to
and imports from the ASEAN
block stood at US$37,460.34
million and US$59,293.36
million respectively.
Contd…
Trade Related Logistics
The logistics industry of India is currently estimated to be around US$215 billion.
The significant developments in this industry led to an increase in the ranking of India in overall logistics
performance, according to the Global Ranking of the World Bank's 2016 Logistics Performance Index.
In 2018, India stood at 44th rank.
Experts predict that the logistics sector can be the largest job creator by 2022.The sector currently provides
employment to more than 72 crore people in the country.
According to the domestic rating agency ICRA, Indian logistics sector is expected to grow at a rate of 8-10 per cent
over the medium term. This is an improvement over the compound annual growth rate (CAGR) of 7.8 per cent at
which the industry grew during the last five years.
Logistics Cost of India and Rest of the world (Ref year=2016)
Contd…
Anti-Dumping and Safeguard Measures
India conducts anti-dumping investigations on the basis of applications filed by the domestic industry
with prima facie evidence of dumping of goods.
The countries involved in these investigations are China PR, Hong Kong, Korea, Germany, EU, USA,
Malaysia, South Africa, Thailand, Brazil among others.
During the period from 01.04.2018 to 31.03.2019, Directorate General of Trade Remedies (DGTR)
initiated 24 anti-dumping (both fresh and review) investigations, and issued final findings in 50 anti-
dumping investigations.
DGTR is also in the process of developing a web application for online submission of petitions,
information, submissions, rejoinders etc. related to antidumping/ countervailing/ anti-circumvention
investigations.
Conclusion
The WEO, April 2019 has forecast acceleration of world output in second half of 2019.
The key assumptions in this regard are continued accommodative monetary policy stance in
advanced countries and fiscal stimulus in China and de-escalation of trade tensions between
the US and China.
There could be pressure on crude prices to increase as world output grows yet that may not
impact India since growth in world output will also favourably impact India’s exports.
From a macro-economic perspective the deterioration of CAD may be contained if
consumption slows down in the economy while increase in investment and exports become
the new drivers of the Indian economy.
Thank You
DVS Advisors LLP
India-Singapore-London-Dubai-Malaysia-Africa
www.dvsca.com
Copyrights © 2019 DVS Advisors LLP

More Related Content

What's hot

Recent trends in balance of payments
Recent trends in balance of paymentsRecent trends in balance of payments
Recent trends in balance of payments
ar9530
 
Covid 19 Impact on Indian Economy
Covid 19 Impact on Indian EconomyCovid 19 Impact on Indian Economy
Covid 19 Impact on Indian Economy
Dheeraj Agarwal
 
Perform EIC Analysis of Banking Sector and HDFC bank
Perform EIC Analysis of Banking Sector and HDFC bank Perform EIC Analysis of Banking Sector and HDFC bank
Perform EIC Analysis of Banking Sector and HDFC bank
khushbu chauhan
 
Economics project work class xii
Economics project  work class xiiEconomics project  work class xii
Economics project work class xii
DhritiSummi
 
Analysis of stock market after Covid-19 By Anshika Singh
Analysis of stock market after Covid-19 By Anshika SinghAnalysis of stock market after Covid-19 By Anshika Singh
Analysis of stock market after Covid-19 By Anshika Singh
AnshikaSingh141
 
External debt in India & other emerging economies
External debt in India & other emerging economiesExternal debt in India & other emerging economies
External debt in India & other emerging economies
Taru Bakshi
 
Review of literature full
Review of literature fullReview of literature full
Review of literature full
adhikarikingshuk
 
Axis bank project
Axis bank projectAxis bank project
Axis bank project
shifali123
 
Equity Research Report on Banking Sector - A project Report
Equity Research Report on Banking Sector - A project ReportEquity Research Report on Banking Sector - A project Report
Equity Research Report on Banking Sector - A project Report
Kaustubh Barve
 
Balence of payments of India
Balence of payments of IndiaBalence of payments of India
Balence of payments of India
Nilesh Patil
 
FDI and FII
FDI and FIIFDI and FII
FDI and FII
Rinshi Singh
 
Economic Comparison between India and China
Economic Comparison between India and ChinaEconomic Comparison between India and China
Economic Comparison between India and China
Shreya Jain
 
Trend of GDP in India
Trend of GDP in IndiaTrend of GDP in India
Trend of GDP in India
SUPRAVAT PRAMANIK
 
Currency Depreciation
Currency Depreciation Currency Depreciation
Currency Depreciation
Arun Rajput
 
India Vs China: Economic Policies Comparision
India Vs China: Economic Policies ComparisionIndia Vs China: Economic Policies Comparision
India Vs China: Economic Policies Comparision
Pulkit Agarwal
 
Project of eop (balance of payment)
Project of eop (balance of payment)Project of eop (balance of payment)
Project of eop (balance of payment)
Aroosh Sheikh
 
India Emerging
India EmergingIndia Emerging
India Emerging
gs.balaji
 
India’s foreign trade
India’s foreign tradeIndia’s foreign trade
India’s foreign trade
Ahtezaz Parways
 
Project on equity analysis on banking sector
Project on equity analysis on banking sectorProject on equity analysis on banking sector
Project on equity analysis on banking sector
HIMANI PADIA
 
Fdi and fpi – india perspective
Fdi and fpi – india perspectiveFdi and fpi – india perspective
Fdi and fpi – india perspective
Kumar Kumar
 

What's hot (20)

Recent trends in balance of payments
Recent trends in balance of paymentsRecent trends in balance of payments
Recent trends in balance of payments
 
Covid 19 Impact on Indian Economy
Covid 19 Impact on Indian EconomyCovid 19 Impact on Indian Economy
Covid 19 Impact on Indian Economy
 
Perform EIC Analysis of Banking Sector and HDFC bank
Perform EIC Analysis of Banking Sector and HDFC bank Perform EIC Analysis of Banking Sector and HDFC bank
Perform EIC Analysis of Banking Sector and HDFC bank
 
Economics project work class xii
Economics project  work class xiiEconomics project  work class xii
Economics project work class xii
 
Analysis of stock market after Covid-19 By Anshika Singh
Analysis of stock market after Covid-19 By Anshika SinghAnalysis of stock market after Covid-19 By Anshika Singh
Analysis of stock market after Covid-19 By Anshika Singh
 
External debt in India & other emerging economies
External debt in India & other emerging economiesExternal debt in India & other emerging economies
External debt in India & other emerging economies
 
Review of literature full
Review of literature fullReview of literature full
Review of literature full
 
Axis bank project
Axis bank projectAxis bank project
Axis bank project
 
Equity Research Report on Banking Sector - A project Report
Equity Research Report on Banking Sector - A project ReportEquity Research Report on Banking Sector - A project Report
Equity Research Report on Banking Sector - A project Report
 
Balence of payments of India
Balence of payments of IndiaBalence of payments of India
Balence of payments of India
 
FDI and FII
FDI and FIIFDI and FII
FDI and FII
 
Economic Comparison between India and China
Economic Comparison between India and ChinaEconomic Comparison between India and China
Economic Comparison between India and China
 
Trend of GDP in India
Trend of GDP in IndiaTrend of GDP in India
Trend of GDP in India
 
Currency Depreciation
Currency Depreciation Currency Depreciation
Currency Depreciation
 
India Vs China: Economic Policies Comparision
India Vs China: Economic Policies ComparisionIndia Vs China: Economic Policies Comparision
India Vs China: Economic Policies Comparision
 
Project of eop (balance of payment)
Project of eop (balance of payment)Project of eop (balance of payment)
Project of eop (balance of payment)
 
India Emerging
India EmergingIndia Emerging
India Emerging
 
India’s foreign trade
India’s foreign tradeIndia’s foreign trade
India’s foreign trade
 
Project on equity analysis on banking sector
Project on equity analysis on banking sectorProject on equity analysis on banking sector
Project on equity analysis on banking sector
 
Fdi and fpi – india perspective
Fdi and fpi – india perspectiveFdi and fpi – india perspective
Fdi and fpi – india perspective
 

Similar to External Sector

State of the Economy in 2018-19: A Macro View
State of the Economy in 2018-19: A Macro ViewState of the Economy in 2018-19: A Macro View
State of the Economy in 2018-19: A Macro View
DVSResearchFoundatio
 
India Central Government Finances - Nov 17
India Central Government Finances - Nov 17 India Central Government Finances - Nov 17
India Central Government Finances - Nov 17
Kannan Rajarathnam
 
Central Government Finances Nov 2017 - India
Central Government Finances Nov 2017 - IndiaCentral Government Finances Nov 2017 - India
Central Government Finances Nov 2017 - India
Kannan Rajarathnam
 
Central Government Finances Nov 2017 - India
Central Government Finances Nov 2017 - IndiaCentral Government Finances Nov 2017 - India
Central Government Finances Nov 2017 - India
Kannan R
 
Indonesia Economic Outlook Q1 2019
Indonesia Economic Outlook Q1 2019Indonesia Economic Outlook Q1 2019
Indonesia Economic Outlook Q1 2019
Febrio Kacaribu
 
Indonesia Economic Outlook Q1 2019
Indonesia Economic Outlook Q1 2019Indonesia Economic Outlook Q1 2019
Indonesia Economic Outlook Q1 2019
febrionathan
 
FDI in India
FDI in IndiaFDI in India
FDI in India
Kannan Rajarathnam
 
FDI in India
FDI in IndiaFDI in India
FDI in India
Kannan R
 
Major Economic Indicators-Feb 2017
Major Economic Indicators-Feb 2017Major Economic Indicators-Feb 2017
Major Economic Indicators-Feb 2017
A.Z.M Reajul Islam
 
Real Estate Facilities Management | Project Services | Vestian
Real Estate Facilities Management | Project Services | VestianReal Estate Facilities Management | Project Services | Vestian
Real Estate Facilities Management | Project Services | Vestian
AlkaKumari66
 
Real Estate Facilities Management | Project Services | Vestian
Real Estate Facilities Management | Project Services | VestianReal Estate Facilities Management | Project Services | Vestian
Real Estate Facilities Management | Project Services | Vestian
vallispvm
 
VietinBank IR Presentation 3Q2019
VietinBank IR Presentation 3Q2019VietinBank IR Presentation 3Q2019
VietinBank IR Presentation 3Q2019
ngothithungan1
 
Balance of payments
Balance of paymentsBalance of payments
Balance of payments
Supriya M D
 
Ubl q4 2013
Ubl q4 2013Ubl q4 2013
Ubl q4 2013
minhas khan
 
Budget in reference to growth of gdp
Budget in reference to growth of gdpBudget in reference to growth of gdp
Budget in reference to growth of gdp
M S Siddiqui
 
TJIF Budget Overview 2012 13
TJIF Budget Overview 2012 13TJIF Budget Overview 2012 13
TJIF Budget Overview 2012 13
Kausar Fecto
 
ICICI Prudential AMC - Debt Market Outlook - August 2017
ICICI Prudential AMC - Debt Market Outlook - August 2017ICICI Prudential AMC - Debt Market Outlook - August 2017
ICICI Prudential AMC - Debt Market Outlook - August 2017
iciciprumf
 
2.slide en q1.2018 out
2.slide en q1.2018   out2.slide en q1.2018   out
2.slide en q1.2018 out
hero_hn
 
An overview of India USA trade relation today and tomorrow
An overview of India USA trade relation today and tomorrowAn overview of India USA trade relation today and tomorrow
An overview of India USA trade relation today and tomorrow
marketxceldata
 
Union Budget- MACRO-ECONOMIC FRAMEWORK STATEMENT 2020-21
Union Budget- MACRO-ECONOMIC FRAMEWORK STATEMENT 2020-21Union Budget- MACRO-ECONOMIC FRAMEWORK STATEMENT 2020-21
Union Budget- MACRO-ECONOMIC FRAMEWORK STATEMENT 2020-21
Prof. Ajay H Shukla
 

Similar to External Sector (20)

State of the Economy in 2018-19: A Macro View
State of the Economy in 2018-19: A Macro ViewState of the Economy in 2018-19: A Macro View
State of the Economy in 2018-19: A Macro View
 
India Central Government Finances - Nov 17
India Central Government Finances - Nov 17 India Central Government Finances - Nov 17
India Central Government Finances - Nov 17
 
Central Government Finances Nov 2017 - India
Central Government Finances Nov 2017 - IndiaCentral Government Finances Nov 2017 - India
Central Government Finances Nov 2017 - India
 
Central Government Finances Nov 2017 - India
Central Government Finances Nov 2017 - IndiaCentral Government Finances Nov 2017 - India
Central Government Finances Nov 2017 - India
 
Indonesia Economic Outlook Q1 2019
Indonesia Economic Outlook Q1 2019Indonesia Economic Outlook Q1 2019
Indonesia Economic Outlook Q1 2019
 
Indonesia Economic Outlook Q1 2019
Indonesia Economic Outlook Q1 2019Indonesia Economic Outlook Q1 2019
Indonesia Economic Outlook Q1 2019
 
FDI in India
FDI in IndiaFDI in India
FDI in India
 
FDI in India
FDI in IndiaFDI in India
FDI in India
 
Major Economic Indicators-Feb 2017
Major Economic Indicators-Feb 2017Major Economic Indicators-Feb 2017
Major Economic Indicators-Feb 2017
 
Real Estate Facilities Management | Project Services | Vestian
Real Estate Facilities Management | Project Services | VestianReal Estate Facilities Management | Project Services | Vestian
Real Estate Facilities Management | Project Services | Vestian
 
Real Estate Facilities Management | Project Services | Vestian
Real Estate Facilities Management | Project Services | VestianReal Estate Facilities Management | Project Services | Vestian
Real Estate Facilities Management | Project Services | Vestian
 
VietinBank IR Presentation 3Q2019
VietinBank IR Presentation 3Q2019VietinBank IR Presentation 3Q2019
VietinBank IR Presentation 3Q2019
 
Balance of payments
Balance of paymentsBalance of payments
Balance of payments
 
Ubl q4 2013
Ubl q4 2013Ubl q4 2013
Ubl q4 2013
 
Budget in reference to growth of gdp
Budget in reference to growth of gdpBudget in reference to growth of gdp
Budget in reference to growth of gdp
 
TJIF Budget Overview 2012 13
TJIF Budget Overview 2012 13TJIF Budget Overview 2012 13
TJIF Budget Overview 2012 13
 
ICICI Prudential AMC - Debt Market Outlook - August 2017
ICICI Prudential AMC - Debt Market Outlook - August 2017ICICI Prudential AMC - Debt Market Outlook - August 2017
ICICI Prudential AMC - Debt Market Outlook - August 2017
 
2.slide en q1.2018 out
2.slide en q1.2018   out2.slide en q1.2018   out
2.slide en q1.2018 out
 
An overview of India USA trade relation today and tomorrow
An overview of India USA trade relation today and tomorrowAn overview of India USA trade relation today and tomorrow
An overview of India USA trade relation today and tomorrow
 
Union Budget- MACRO-ECONOMIC FRAMEWORK STATEMENT 2020-21
Union Budget- MACRO-ECONOMIC FRAMEWORK STATEMENT 2020-21Union Budget- MACRO-ECONOMIC FRAMEWORK STATEMENT 2020-21
Union Budget- MACRO-ECONOMIC FRAMEWORK STATEMENT 2020-21
 

More from DVSResearchFoundatio

ODI DRAFT REGULATIONS
ODI DRAFT REGULATIONSODI DRAFT REGULATIONS
ODI DRAFT REGULATIONS
DVSResearchFoundatio
 
SCRAPPING OF RETRO TAX PROVISIONS : A REVIVAL OF OVERSEAS INTEREST IN INDIA
SCRAPPING OF RETRO TAX PROVISIONS : A REVIVAL OF OVERSEAS INTEREST IN INDIASCRAPPING OF RETRO TAX PROVISIONS : A REVIVAL OF OVERSEAS INTEREST IN INDIA
SCRAPPING OF RETRO TAX PROVISIONS : A REVIVAL OF OVERSEAS INTEREST IN INDIA
DVSResearchFoundatio
 
INCORPORATING A COMPANY IN DUBAI MAINLAND
INCORPORATING A COMPANY IN DUBAI MAINLANDINCORPORATING A COMPANY IN DUBAI MAINLAND
INCORPORATING A COMPANY IN DUBAI MAINLAND
DVSResearchFoundatio
 
Key Takeaways: - Analysis of section 45(4), section 9B of the Income Tax Act...
Key Takeaways:  - Analysis of section 45(4), section 9B of the Income Tax Act...Key Takeaways:  - Analysis of section 45(4), section 9B of the Income Tax Act...
Key Takeaways: - Analysis of section 45(4), section 9B of the Income Tax Act...
DVSResearchFoundatio
 
WITHHOLDING ON GRATUITY PAYMENT SUPREME COURT OF INDIA
WITHHOLDING ON GRATUITY PAYMENT SUPREME COURT OF INDIA WITHHOLDING ON GRATUITY PAYMENT SUPREME COURT OF INDIA
WITHHOLDING ON GRATUITY PAYMENT SUPREME COURT OF INDIA
DVSResearchFoundatio
 
DISALLOWANCE U/S 14A
DISALLOWANCE U/S 14ADISALLOWANCE U/S 14A
DISALLOWANCE U/S 14A
DVSResearchFoundatio
 
FALLACIOUS DISREGARDING OF TRANSACTIONS THAT RESULT IN A TAX BENEFIT TO THE A...
FALLACIOUS DISREGARDING OF TRANSACTIONS THAT RESULT IN A TAX BENEFIT TO THE A...FALLACIOUS DISREGARDING OF TRANSACTIONS THAT RESULT IN A TAX BENEFIT TO THE A...
FALLACIOUS DISREGARDING OF TRANSACTIONS THAT RESULT IN A TAX BENEFIT TO THE A...
DVSResearchFoundatio
 
ALLOWABILITY OF OUTSTANDING INTEREST CONVERTED INTO DEBENTURES AS AN EXPENSE ...
ALLOWABILITY OF OUTSTANDING INTEREST CONVERTED INTO DEBENTURES AS AN EXPENSE ...ALLOWABILITY OF OUTSTANDING INTEREST CONVERTED INTO DEBENTURES AS AN EXPENSE ...
ALLOWABILITY OF OUTSTANDING INTEREST CONVERTED INTO DEBENTURES AS AN EXPENSE ...
DVSResearchFoundatio
 
DENIAL OF EXEMPTION U/S 10(23C)
DENIAL OF EXEMPTION U/S 10(23C)DENIAL OF EXEMPTION U/S 10(23C)
DENIAL OF EXEMPTION U/S 10(23C)
DVSResearchFoundatio
 
CANCELLATION OF REGISTRATION OF TRUST U/S 12AA
CANCELLATION OF REGISTRATION OF TRUST U/S 12AACANCELLATION OF REGISTRATION OF TRUST U/S 12AA
CANCELLATION OF REGISTRATION OF TRUST U/S 12AA
DVSResearchFoundatio
 
Advance tax liability when tds not deducted
Advance tax liability when tds not deductedAdvance tax liability when tds not deducted
Advance tax liability when tds not deducted
DVSResearchFoundatio
 
FDI in LLP
FDI in LLPFDI in LLP
How to make an application for SME IPO listing?
How to make an application for SME IPO listing?How to make an application for SME IPO listing?
How to make an application for SME IPO listing?
DVSResearchFoundatio
 
What are the post listing compliance norms for SME entities?
What are the post listing compliance norms for SME entities?What are the post listing compliance norms for SME entities?
What are the post listing compliance norms for SME entities?
DVSResearchFoundatio
 
What are the steps to be taken after issue by SME?
What are the steps to be taken after issue by SME?What are the steps to be taken after issue by SME?
What are the steps to be taken after issue by SME?
DVSResearchFoundatio
 
What are the steps to be taken prior to SME listing?
What are the steps to be taken prior to SME listing?What are the steps to be taken prior to SME listing?
What are the steps to be taken prior to SME listing?
DVSResearchFoundatio
 
What are the criteria for SME listing?
What are the criteria for SME listing?What are the criteria for SME listing?
What are the criteria for SME listing?
DVSResearchFoundatio
 
TAXATION OF MNCs – HEADING TOWARDS A RESOLUTION
TAXATION OF MNCs – HEADING TOWARDS A RESOLUTIONTAXATION OF MNCs – HEADING TOWARDS A RESOLUTION
TAXATION OF MNCs – HEADING TOWARDS A RESOLUTION
DVSResearchFoundatio
 
INCORPORATING A COMPANY IN SINGAPORE BY AN INDIAN
INCORPORATING A COMPANY IN SINGAPORE BY AN INDIANINCORPORATING A COMPANY IN SINGAPORE BY AN INDIAN
INCORPORATING A COMPANY IN SINGAPORE BY AN INDIAN
DVSResearchFoundatio
 
AUTOMATIC VACATION OF STAY GRANTED BY TRIBUNALDCIT v. PEPSI FOODS LTD. [2021]...
AUTOMATIC VACATION OF STAY GRANTED BY TRIBUNALDCIT v. PEPSI FOODS LTD. [2021]...AUTOMATIC VACATION OF STAY GRANTED BY TRIBUNALDCIT v. PEPSI FOODS LTD. [2021]...
AUTOMATIC VACATION OF STAY GRANTED BY TRIBUNALDCIT v. PEPSI FOODS LTD. [2021]...
DVSResearchFoundatio
 

More from DVSResearchFoundatio (20)

ODI DRAFT REGULATIONS
ODI DRAFT REGULATIONSODI DRAFT REGULATIONS
ODI DRAFT REGULATIONS
 
SCRAPPING OF RETRO TAX PROVISIONS : A REVIVAL OF OVERSEAS INTEREST IN INDIA
SCRAPPING OF RETRO TAX PROVISIONS : A REVIVAL OF OVERSEAS INTEREST IN INDIASCRAPPING OF RETRO TAX PROVISIONS : A REVIVAL OF OVERSEAS INTEREST IN INDIA
SCRAPPING OF RETRO TAX PROVISIONS : A REVIVAL OF OVERSEAS INTEREST IN INDIA
 
INCORPORATING A COMPANY IN DUBAI MAINLAND
INCORPORATING A COMPANY IN DUBAI MAINLANDINCORPORATING A COMPANY IN DUBAI MAINLAND
INCORPORATING A COMPANY IN DUBAI MAINLAND
 
Key Takeaways: - Analysis of section 45(4), section 9B of the Income Tax Act...
Key Takeaways:  - Analysis of section 45(4), section 9B of the Income Tax Act...Key Takeaways:  - Analysis of section 45(4), section 9B of the Income Tax Act...
Key Takeaways: - Analysis of section 45(4), section 9B of the Income Tax Act...
 
WITHHOLDING ON GRATUITY PAYMENT SUPREME COURT OF INDIA
WITHHOLDING ON GRATUITY PAYMENT SUPREME COURT OF INDIA WITHHOLDING ON GRATUITY PAYMENT SUPREME COURT OF INDIA
WITHHOLDING ON GRATUITY PAYMENT SUPREME COURT OF INDIA
 
DISALLOWANCE U/S 14A
DISALLOWANCE U/S 14ADISALLOWANCE U/S 14A
DISALLOWANCE U/S 14A
 
FALLACIOUS DISREGARDING OF TRANSACTIONS THAT RESULT IN A TAX BENEFIT TO THE A...
FALLACIOUS DISREGARDING OF TRANSACTIONS THAT RESULT IN A TAX BENEFIT TO THE A...FALLACIOUS DISREGARDING OF TRANSACTIONS THAT RESULT IN A TAX BENEFIT TO THE A...
FALLACIOUS DISREGARDING OF TRANSACTIONS THAT RESULT IN A TAX BENEFIT TO THE A...
 
ALLOWABILITY OF OUTSTANDING INTEREST CONVERTED INTO DEBENTURES AS AN EXPENSE ...
ALLOWABILITY OF OUTSTANDING INTEREST CONVERTED INTO DEBENTURES AS AN EXPENSE ...ALLOWABILITY OF OUTSTANDING INTEREST CONVERTED INTO DEBENTURES AS AN EXPENSE ...
ALLOWABILITY OF OUTSTANDING INTEREST CONVERTED INTO DEBENTURES AS AN EXPENSE ...
 
DENIAL OF EXEMPTION U/S 10(23C)
DENIAL OF EXEMPTION U/S 10(23C)DENIAL OF EXEMPTION U/S 10(23C)
DENIAL OF EXEMPTION U/S 10(23C)
 
CANCELLATION OF REGISTRATION OF TRUST U/S 12AA
CANCELLATION OF REGISTRATION OF TRUST U/S 12AACANCELLATION OF REGISTRATION OF TRUST U/S 12AA
CANCELLATION OF REGISTRATION OF TRUST U/S 12AA
 
Advance tax liability when tds not deducted
Advance tax liability when tds not deductedAdvance tax liability when tds not deducted
Advance tax liability when tds not deducted
 
FDI in LLP
FDI in LLPFDI in LLP
FDI in LLP
 
How to make an application for SME IPO listing?
How to make an application for SME IPO listing?How to make an application for SME IPO listing?
How to make an application for SME IPO listing?
 
What are the post listing compliance norms for SME entities?
What are the post listing compliance norms for SME entities?What are the post listing compliance norms for SME entities?
What are the post listing compliance norms for SME entities?
 
What are the steps to be taken after issue by SME?
What are the steps to be taken after issue by SME?What are the steps to be taken after issue by SME?
What are the steps to be taken after issue by SME?
 
What are the steps to be taken prior to SME listing?
What are the steps to be taken prior to SME listing?What are the steps to be taken prior to SME listing?
What are the steps to be taken prior to SME listing?
 
What are the criteria for SME listing?
What are the criteria for SME listing?What are the criteria for SME listing?
What are the criteria for SME listing?
 
TAXATION OF MNCs – HEADING TOWARDS A RESOLUTION
TAXATION OF MNCs – HEADING TOWARDS A RESOLUTIONTAXATION OF MNCs – HEADING TOWARDS A RESOLUTION
TAXATION OF MNCs – HEADING TOWARDS A RESOLUTION
 
INCORPORATING A COMPANY IN SINGAPORE BY AN INDIAN
INCORPORATING A COMPANY IN SINGAPORE BY AN INDIANINCORPORATING A COMPANY IN SINGAPORE BY AN INDIAN
INCORPORATING A COMPANY IN SINGAPORE BY AN INDIAN
 
AUTOMATIC VACATION OF STAY GRANTED BY TRIBUNALDCIT v. PEPSI FOODS LTD. [2021]...
AUTOMATIC VACATION OF STAY GRANTED BY TRIBUNALDCIT v. PEPSI FOODS LTD. [2021]...AUTOMATIC VACATION OF STAY GRANTED BY TRIBUNALDCIT v. PEPSI FOODS LTD. [2021]...
AUTOMATIC VACATION OF STAY GRANTED BY TRIBUNALDCIT v. PEPSI FOODS LTD. [2021]...
 

Recently uploaded

-- June 2024 is National Volunteer Month --
-- June 2024 is National Volunteer Month ---- June 2024 is National Volunteer Month --
-- June 2024 is National Volunteer Month --
NZSG
 
Best practices for project execution and delivery
Best practices for project execution and deliveryBest practices for project execution and delivery
Best practices for project execution and delivery
CLIVE MINCHIN
 
Mastering B2B Payments Webinar from BlueSnap
Mastering B2B Payments Webinar from BlueSnapMastering B2B Payments Webinar from BlueSnap
Mastering B2B Payments Webinar from BlueSnap
Norma Mushkat Gaffin
 
Creative Web Design Company in Singapore
Creative Web Design Company in SingaporeCreative Web Design Company in Singapore
Creative Web Design Company in Singapore
techboxsqauremedia
 
The APCO Geopolitical Radar - Q3 2024 The Global Operating Environment for Bu...
The APCO Geopolitical Radar - Q3 2024 The Global Operating Environment for Bu...The APCO Geopolitical Radar - Q3 2024 The Global Operating Environment for Bu...
The APCO Geopolitical Radar - Q3 2024 The Global Operating Environment for Bu...
APCO
 
Observation Lab PowerPoint Assignment for TEM 431
Observation Lab PowerPoint Assignment for TEM 431Observation Lab PowerPoint Assignment for TEM 431
Observation Lab PowerPoint Assignment for TEM 431
ecamare2
 
Structural Design Process: Step-by-Step Guide for Buildings
Structural Design Process: Step-by-Step Guide for BuildingsStructural Design Process: Step-by-Step Guide for Buildings
Structural Design Process: Step-by-Step Guide for Buildings
Chandresh Chudasama
 
The 10 Most Influential Leaders Guiding Corporate Evolution, 2024.pdf
The 10 Most Influential Leaders Guiding Corporate Evolution, 2024.pdfThe 10 Most Influential Leaders Guiding Corporate Evolution, 2024.pdf
The 10 Most Influential Leaders Guiding Corporate Evolution, 2024.pdf
thesiliconleaders
 
How to Implement a Real Estate CRM Software
How to Implement a Real Estate CRM SoftwareHow to Implement a Real Estate CRM Software
How to Implement a Real Estate CRM Software
SalesTown
 
How to Implement a Strategy: Transform Your Strategy with BSC Designer's Comp...
How to Implement a Strategy: Transform Your Strategy with BSC Designer's Comp...How to Implement a Strategy: Transform Your Strategy with BSC Designer's Comp...
How to Implement a Strategy: Transform Your Strategy with BSC Designer's Comp...
Aleksey Savkin
 
Top mailing list providers in the USA.pptx
Top mailing list providers in the USA.pptxTop mailing list providers in the USA.pptx
Top mailing list providers in the USA.pptx
JeremyPeirce1
 
Unveiling the Dynamic Personalities, Key Dates, and Horoscope Insights: Gemin...
Unveiling the Dynamic Personalities, Key Dates, and Horoscope Insights: Gemin...Unveiling the Dynamic Personalities, Key Dates, and Horoscope Insights: Gemin...
Unveiling the Dynamic Personalities, Key Dates, and Horoscope Insights: Gemin...
my Pandit
 
The Genesis of BriansClub.cm Famous Dark WEb Platform
The Genesis of BriansClub.cm Famous Dark WEb PlatformThe Genesis of BriansClub.cm Famous Dark WEb Platform
The Genesis of BriansClub.cm Famous Dark WEb Platform
SabaaSudozai
 
How are Lilac French Bulldogs Beauty Charming the World and Capturing Hearts....
How are Lilac French Bulldogs Beauty Charming the World and Capturing Hearts....How are Lilac French Bulldogs Beauty Charming the World and Capturing Hearts....
How are Lilac French Bulldogs Beauty Charming the World and Capturing Hearts....
Lacey Max
 
Anny Serafina Love - Letter of Recommendation by Kellen Harkins, MS.
Anny Serafina Love - Letter of Recommendation by Kellen Harkins, MS.Anny Serafina Love - Letter of Recommendation by Kellen Harkins, MS.
Anny Serafina Love - Letter of Recommendation by Kellen Harkins, MS.
AnnySerafinaLove
 
Understanding User Needs and Satisfying Them
Understanding User Needs and Satisfying ThemUnderstanding User Needs and Satisfying Them
Understanding User Needs and Satisfying Them
Aggregage
 
3 Simple Steps To Buy Verified Payoneer Account In 2024
3 Simple Steps To Buy Verified Payoneer Account In 20243 Simple Steps To Buy Verified Payoneer Account In 2024
3 Simple Steps To Buy Verified Payoneer Account In 2024
SEOSMMEARTH
 
Building Your Employer Brand with Social Media
Building Your Employer Brand with Social MediaBuilding Your Employer Brand with Social Media
Building Your Employer Brand with Social Media
LuanWise
 
2022 Vintage Roman Numerals Men Rings
2022 Vintage Roman  Numerals  Men  Rings2022 Vintage Roman  Numerals  Men  Rings
2022 Vintage Roman Numerals Men Rings
aragme
 
The Heart of Leadership_ How Emotional Intelligence Drives Business Success B...
The Heart of Leadership_ How Emotional Intelligence Drives Business Success B...The Heart of Leadership_ How Emotional Intelligence Drives Business Success B...
The Heart of Leadership_ How Emotional Intelligence Drives Business Success B...
Stephen Cashman
 

Recently uploaded (20)

-- June 2024 is National Volunteer Month --
-- June 2024 is National Volunteer Month ---- June 2024 is National Volunteer Month --
-- June 2024 is National Volunteer Month --
 
Best practices for project execution and delivery
Best practices for project execution and deliveryBest practices for project execution and delivery
Best practices for project execution and delivery
 
Mastering B2B Payments Webinar from BlueSnap
Mastering B2B Payments Webinar from BlueSnapMastering B2B Payments Webinar from BlueSnap
Mastering B2B Payments Webinar from BlueSnap
 
Creative Web Design Company in Singapore
Creative Web Design Company in SingaporeCreative Web Design Company in Singapore
Creative Web Design Company in Singapore
 
The APCO Geopolitical Radar - Q3 2024 The Global Operating Environment for Bu...
The APCO Geopolitical Radar - Q3 2024 The Global Operating Environment for Bu...The APCO Geopolitical Radar - Q3 2024 The Global Operating Environment for Bu...
The APCO Geopolitical Radar - Q3 2024 The Global Operating Environment for Bu...
 
Observation Lab PowerPoint Assignment for TEM 431
Observation Lab PowerPoint Assignment for TEM 431Observation Lab PowerPoint Assignment for TEM 431
Observation Lab PowerPoint Assignment for TEM 431
 
Structural Design Process: Step-by-Step Guide for Buildings
Structural Design Process: Step-by-Step Guide for BuildingsStructural Design Process: Step-by-Step Guide for Buildings
Structural Design Process: Step-by-Step Guide for Buildings
 
The 10 Most Influential Leaders Guiding Corporate Evolution, 2024.pdf
The 10 Most Influential Leaders Guiding Corporate Evolution, 2024.pdfThe 10 Most Influential Leaders Guiding Corporate Evolution, 2024.pdf
The 10 Most Influential Leaders Guiding Corporate Evolution, 2024.pdf
 
How to Implement a Real Estate CRM Software
How to Implement a Real Estate CRM SoftwareHow to Implement a Real Estate CRM Software
How to Implement a Real Estate CRM Software
 
How to Implement a Strategy: Transform Your Strategy with BSC Designer's Comp...
How to Implement a Strategy: Transform Your Strategy with BSC Designer's Comp...How to Implement a Strategy: Transform Your Strategy with BSC Designer's Comp...
How to Implement a Strategy: Transform Your Strategy with BSC Designer's Comp...
 
Top mailing list providers in the USA.pptx
Top mailing list providers in the USA.pptxTop mailing list providers in the USA.pptx
Top mailing list providers in the USA.pptx
 
Unveiling the Dynamic Personalities, Key Dates, and Horoscope Insights: Gemin...
Unveiling the Dynamic Personalities, Key Dates, and Horoscope Insights: Gemin...Unveiling the Dynamic Personalities, Key Dates, and Horoscope Insights: Gemin...
Unveiling the Dynamic Personalities, Key Dates, and Horoscope Insights: Gemin...
 
The Genesis of BriansClub.cm Famous Dark WEb Platform
The Genesis of BriansClub.cm Famous Dark WEb PlatformThe Genesis of BriansClub.cm Famous Dark WEb Platform
The Genesis of BriansClub.cm Famous Dark WEb Platform
 
How are Lilac French Bulldogs Beauty Charming the World and Capturing Hearts....
How are Lilac French Bulldogs Beauty Charming the World and Capturing Hearts....How are Lilac French Bulldogs Beauty Charming the World and Capturing Hearts....
How are Lilac French Bulldogs Beauty Charming the World and Capturing Hearts....
 
Anny Serafina Love - Letter of Recommendation by Kellen Harkins, MS.
Anny Serafina Love - Letter of Recommendation by Kellen Harkins, MS.Anny Serafina Love - Letter of Recommendation by Kellen Harkins, MS.
Anny Serafina Love - Letter of Recommendation by Kellen Harkins, MS.
 
Understanding User Needs and Satisfying Them
Understanding User Needs and Satisfying ThemUnderstanding User Needs and Satisfying Them
Understanding User Needs and Satisfying Them
 
3 Simple Steps To Buy Verified Payoneer Account In 2024
3 Simple Steps To Buy Verified Payoneer Account In 20243 Simple Steps To Buy Verified Payoneer Account In 2024
3 Simple Steps To Buy Verified Payoneer Account In 2024
 
Building Your Employer Brand with Social Media
Building Your Employer Brand with Social MediaBuilding Your Employer Brand with Social Media
Building Your Employer Brand with Social Media
 
2022 Vintage Roman Numerals Men Rings
2022 Vintage Roman  Numerals  Men  Rings2022 Vintage Roman  Numerals  Men  Rings
2022 Vintage Roman Numerals Men Rings
 
The Heart of Leadership_ How Emotional Intelligence Drives Business Success B...
The Heart of Leadership_ How Emotional Intelligence Drives Business Success B...The Heart of Leadership_ How Emotional Intelligence Drives Business Success B...
The Heart of Leadership_ How Emotional Intelligence Drives Business Success B...
 

External Sector

  • 1. External Sector CA. Divakar Vijayasarathy DVS Advisors LLP India-Singapore-London-Dubai-Malaysia-Africa www.dvsca.com
  • 3. Presentation Schema Introduction Global Economic Environment Balance of Payments External Debt Nominal and Real Exchange Rate Terms of Trade Composition of Trade Trade Policy Trade Related Logistics Anti-Dumping and Safeguard Measures Conclusion
  • 4. Introduction India’s macroeconomic situation on the external side continues to be stable. Though the current account deficit is projected at 2.4 per cent of GDP in 2018-19, up from 1.8 per cent in 2017- 18, this is within reasonable levels. The widening of the current account deficit has been driven by a deterioration of trade deficit from 6.0 per cent of GDP to 6.7 per cent across the two years. Rise in crude prices in Q4 of 2018-19 and a decline in the growth of merchandize exports have led to the deterioration of trade deficit. The income terms of trade, a metric that measures the purchasing power to import, has been on a rising trend, possibly because the growth of crude prices has still not exceeded the growth of India’s export prices. The exchange rate in 2018-19 has been more volatile than in the previous year, mainly due to volatility in crude prices, but not much due to net portfolio flows.
  • 5. Global Economic Environment Heightened US-China trade tensions has been stated as one of the reasons behind the global slowdown that has spilled into other economies including India through the channel of exports. The WEO further states that growing trade protectionism in the world, of which US-China trade tensions is the most recent manifestation, places at risk the low relative price of machinery and equipment that over the years has declined, partly due to increasing trade integration. World commercial services on the other hand recorded a strong growth of 7.7 per cent in 2018 but was still lower than 8.4 per cent in 2017. However, goods related services growth shot up to 10.6 per cent in 2018, up from 8.3 per cent in the previous year.
  • 6. In its April 2019 Press Release, WTO has stated that apart from trade tensions, trade and output were also influenced by temporary shocks, including the federal government shutdown in the United States and production problems in the automotive sector in Germany toward the end of the year. Along with the slowing down of world trade seen in 2018 there has been a spatial shift in the nature of BoP balances as well in the last few years. Advanced economies had a current account deficit of US$28.1 billion in 2011, which has been reducing consistently since then and turned into current account surplus of US$444.7 billion in 2017. Emerging and developing economies on the other hand slipped from their current account surplus position of US$379.0 billion in 2011 to US$0.1 billion in 2017. Contd…
  • 7. Balance of Payments The widening of the CAD was largely on account of a higher trade deficit driven by rise in international crude oil prices (Indian basket) making merchandise imports grow relatively faster than exports. The trade deficit increased to US$145.3 billion during the same period from US$118.4 billion in the corresponding period of previous year. India’s CAD has been increasing for some years now after attaining a high of 0.6 per cent of GDP in 2016-17. It increased to 1.8 per cent of GDP in 2017-18 and has been projected at 2.4 per cent for the full year of 2018- 19.
  • 8. Current Account Deficit and Trade Deficit as per cent of GDP
  • 9. FDI Inflow During 2018-19, net foreign investment declined to US$31.3 billion as compared to US$52.4 billion in the corresponding period of 2017-18. As a proportion of GDP, net FDI fell from 1.6 per cent in 2016-17 to 1.1 per cent in 2017-18, before rising to 1.2 per cent in 2018-19 Robust foreign direct investment (FDI) inflows, were more than outweighed by withdrawals under portfolio investment reflecting an escalation of global risk aversion. Foreign Direct Investment as a per cent of GDP
  • 10. Net Capital Flows Among other forms of capital flows, banking capital recorded a net inflow of US$15.5 billion in 2018-19 (April- December), a 34 per cent increase over US$11.6 billion in the corresponding period of the previous year. Overall, net capital flows fell short of financing CAD resulting in depletion of foreign exchange reserves by US$17.5 billion during April-December 2018. -2 -1 0 1 2 3 4 5 6 7 8 Net External Assistance Net External Commercial Borrowings Net NRI Deposit Debt creating capital flows (in billions) 2018-19 2017-18
  • 11. Net Foreign Portfolio Investment In 2009-14 net portfolio investment funded 45.6 per cent of current account deficit but declined to 17.1 per cent in 2014-19. The financing of the current account deficit in 2014-19 thus became less vulnerable to capital flight as compared to the previous period. The reduced dependency on FPIs to fund CAD in recent times is also reflected in the fact that growth of forex reserves in the country bears no correlation with movements in net FPI. Monthly Movement in Net FPI and Foreign Exchange Reserves.
  • 12. Foreign Exchange Reserves India’s foreign exchange reserves stood at US$422.2 billion as on June 14, 2019. The foreign exchange reserves in nominal terms (including the valuation effects) decreased by US $29.0 billion during April-December 2018 as against an increase of US$39.1 billion during the same period of the preceding year. However, on a balance of payments basis (i.e., excluding valuation effects), the foreign exchange reserves decreased by US$17.5 billion during April-December 2018 as against an increase of US$30.3 billion during the corresponding period of the same year.
  • 13. External Debt India’s External Debt was US$521.1 billion at December 2018, 1.6 per cent lower than its level at March 2018. The long-term debt declined by 2.4 per cent to US$417.3 billion at December 2018 over March 2018. Short term debt grew by 1.7 per cent in December 2018 compared to March 2018, primarily due to increase in trade related credits.
  • 14. Foreign Exchange and External Debt Foreign Exchange cover to total external debt deteriorated to 75.5 per cent at end- December 2018 from 80.2 per cent at end-March 2018, with the ratio of short term debt by original maturity to foreign exchange reserves rising to 26.4 per cent in end- December 2018 from 24.1 per cent at end-March 2018. The share of short term debt by residual maturity in total external debt, which is useful in assessing liquidity requirements to service contractual obligations within a year, was 43.5 per cent at end-December 2018 as against 42.0 per cent at end- March 2018 reflecting increase in liquid conditions. The share of short term debt by residual maturity in total external debt, which is useful in assessing liquidity requirements to service contractual obligations within a year, was 43.5 per cent at end-December 2018 as against 42.0 per cent at end- March 2018 reflecting increase in liquid conditions.
  • 16. External Debt to Key Indicators.
  • 17. Debt-Service Ratio Debt Service ratio indicates the claim that servicing of external debt makes on current receipts and is, therefore, a measure of strain on BoP due to servicing of debt service obligations. Debt Service ratio increased till 2016 and then declined continuously since 2016 from 8.8 per cent to 8.3 per cent in 2017 to 7.5 per cent in 2018 (end-March). The declining ratios of debt service, total external debt to exports and debt service to exports in 201617 and 2017-18 may be seen as favourable for India. Indicators of Debt Sustainability.
  • 18. Net International Investment Position The International Investment Position (IIP) is a statistical statement that shows at a point in time the value of financial assets of residents of an economy that are claims on non-residents or are gold bullion held as reserve assets; and the liabilities of residents of an economy to non-residents. The difference between the assets and liabilities is the net position in the IIP and represents either a net claim on or a net liability to the rest of the world. A positive NIIP value indicates a nation is a creditor nation, while a negative value indicates it is a debtor nation.
  • 19. Top Ten Economies Having Net IIP Deficit Among the top ten economies having Net IIP deficit in 2018, United States is ranked first with net IIP deficit of US$9.7 trillion, followed by Spain (US$1.1 trillion) and Australia (US$0.7 trillion). In comparison to previous year 2017, India’s net IIP deficit increased by 2.8 per cent from US$426.6 billion in 2017 to US$438.4 billion in 2018. Net IIP Deficit of Top 10 economies in 2018
  • 20. There is continuous deterioration in net IIP of India from 2011 till 2018, on account of consistent increase in IIP liabilities over the corresponding period of time. India’s International Investment Position (US$ Million) Contd…
  • 21. However as per centage of GDP, IIP liabilities, which had earlier increased from 2011 to 2015, have been declining since then. Total liabilities as per cent of GDP.Contd…
  • 22. The total liabilities in the IIP statement is a more comprehensive measure of external indebtedness than merely external debt as the former also includes net equity inflows, which is used for financing the CAD. The declining external indebtedness as evident from Figure 21 emerged in 2015 and can stabilize at is most recent level provided CAD as a percentage of GDP stays in the range of 2.2 to 2.5 per cent of GDP. The share of net FDI inflows in total liabilities has seen a secular increase since 2013 reflecting an increase in dependence on more stable sources of financing the CAD India’s IIP Liabilities. Contd….
  • 23. Nominal and Real Exchange Rate Terms and Trade During 2018-19, Indian rupee traded with a depreciating trend against US dollar and touched a historical low of 74.4 per US$ (reference rate) on October 11, 2018 before recovering by 4.1 per cent to 69.2 per US$ on March 29, 2019. The Indian rupee was one of the least volatile Emerging Market (EM) currencies during 2017-18 and traded in the range of 63.63 to 65.08 per US$. During H1 of 2018-19, rupee remained weak due to concerns related to widening of CAD owing to rising crude oil prices. Thereafter, softer monetary policy stance across major central banks and easing of crude oil prices coupled with return of risk-on sentiment triggered FPIs inflows and helped rupee to recover in Q4 of 2018-19.
  • 24. Apart from rupee depreciating by 7.8 per cent vis-à-vis US dollar in 2018-19, it also depreciated against other major currencies. It depreciated by 7.7 per cent against Yen, and 6.8 per cent against Euro and Pound Sterling each. Movement of Rupee against US Dollar, Euro, Pound Sterling and Japanese Yen Contd…
  • 25. NEER and REER In terms of the 6 and 36 currency Nominal Effective Exchange Rate (NEER) (trade based weights), rupee depreciated by 7.1 and 5.6 per cent respectively in the fiscal year 2018-19 over 2017-18. In terms of 6 and 36 currency Real Effective Exchange Rate (REER), rupee depreciated by 5.8 per cent and 4.8 per cent respectively in 2018-19 over 2017-18. The sharpest depreciation in October 2018 was due to strong economic fundamentals, softening of crude oil prices, sustained selling of the dollar by exporters and banks.
  • 26. Exchange Rate Volatility • The below table uses the highest and lowest monthly exchange rate within a year to calculate variation between month highs and lows. • It indicates that the rupee witnessed a spike in volatility in 2018-19 after two years of relative stability. Exchange Rate Volatility
  • 27. Net Foreign Portfolio Investment (FPI) Volatility The below figures indicates that net FPI witnessed highest volatility in 2013-14 after which it has been relatively stable in 2018-19. Net FPI Volatility. Net FPI Highs and Lows.
  • 28. It is evident that movements in exchange rate are closely associated with movements in crude oil price and net FPI flows. The rupee remained volatile in 2018-19 on account of both global and domestic factors including rising crude oil prices, erratic trade balance, strengthening of dollar and continuous FPI outflows. Additional factors impacting the rupee include trade war between US and China and US sanctions on Iran and interest rate hikes by the US Federal Reserve. Contd….
  • 29. Terms of Trade Two commonly used terms of trade indices are gross terms of trade (GTT) and income terms of trade (ITT). The GTT is a ratio of total quantity of imports to that of exports of a given country. The ITT is the value of exports divided by the unit value (price) of imports to reflect how better or worse a country’s purchasing power to imports has become. All indices of terms of trade have been on an upward trend since 2015-16. Terms of Trade (Base Year 1999-2000).
  • 30. Composition of Trade In 2018-19, India’s exports to countries with which it has a trade agreement stood at US$121.7 billion accounting for 36.9 per cent of India’s export to all the countries. Petroleum products, precious stones, drug formulations, gold remain as top export items. India’s main trading partners continue to be the US, China, Hong Kong, the UAE and Saudi Arabia. Commodity wise composition of Exports (2018-19)
  • 31. India’s imports in 2018-19 from countries with which it has a trade agreement stood at US$266.9 billion accounting for 52.0 per cent of India’s imports from all the countries. Crude petroleum, pearl, precious, semi-precious stones and gold remain as top import items. Commodity-wise composition of imports. Contd…
  • 32. Major Trading Partners India’s largest export destination country continues to be the United States of America (USA), which accounted for 16 per cent of India’s exports (in value terms) in 2018-19, followed by United Arab Emirates (UAE), China and Hong Kong. However, in 2018-19, growth of India’s exports to the Netherlands was the highest (40.7 per cent), followed by China (25.6 per cent) and Nepal (17.4 per cent). Top 10 Export Destinations of India 2018-19.Export sources
  • 33. Import Sources China continues to be the largest source of imports of India accounting for 13.7 per cent of the total imported value in 2018-19. The other important sources of imports are the USA, UAE and Saudi Arabia. However, India’s imports from China fell from US$76.4 billion in 2017-18 to US$70.3 billion in 2018-19, registering a negative growth. Top 10 Import Sources of India (2018-19) Contd…
  • 34. Trade Policy In Europe India is a part of European Free Trade Association (EFTA), consisting of Switzerland, Norway, Iceland and Liechtenstein. In 2018-19, India exports to and imports from EFTA stood at US$1,534.00 million and US$18,076.88 million respectively. Among SAARC countries, India and Bangladesh have a bilateral trade agreement In 2018-19, India’s exports to and imports from Bangladesh stood at US$8,933.47 million and US$1,043.03 million respectively. With Neighbours, Review meetings for India-Nepal Treaty of Trade is going on. With Sri Lanka, India has India-Sri Lanka Free Trade Agreement (ISLFTA), under which duty-free access for almost all the products except a few is provided. In 201819, India’s exports to and imports from Sri Lanka stood at US$4,707.14 million and US$1,473.10 million respectively.
  • 35. Among Latin American Countries, India has Preferential Trade Agreements (PTA) with MERCOSUR (Argentina, Brazil, Paraguay and Uruguay) and Chile. Possibilities are being explored for PTA with Colombia also. In 2018-19, India exports to and imports from MERCOSUR block stood at US$4,705.08 million and US$6,425.35 million respectively. Under North America Free Trade Agreement (NAFTA), Negotiations are underway for India Canada Comprehensive Economic Policy Agreement (CEPA). India is also negotiating bilateral Comprehensive Economic Cooperation Agreement (CECA) with Australia and New Zealand. Negotiations are underway for Comprehensive Economic Cooperation and Partnership Agreement (CECPA) with Mauritius and FTA with Israel. India- ASEAN, Within Association of South East Asian Nations, India has Comprehensive Economic Cooperation Agreement (CECA) with Singapore, Thailand and Malaysia. In 2018-19, India exports to and imports from the ASEAN block stood at US$37,460.34 million and US$59,293.36 million respectively. Contd…
  • 36. Trade Related Logistics The logistics industry of India is currently estimated to be around US$215 billion. The significant developments in this industry led to an increase in the ranking of India in overall logistics performance, according to the Global Ranking of the World Bank's 2016 Logistics Performance Index. In 2018, India stood at 44th rank. Experts predict that the logistics sector can be the largest job creator by 2022.The sector currently provides employment to more than 72 crore people in the country. According to the domestic rating agency ICRA, Indian logistics sector is expected to grow at a rate of 8-10 per cent over the medium term. This is an improvement over the compound annual growth rate (CAGR) of 7.8 per cent at which the industry grew during the last five years.
  • 37. Logistics Cost of India and Rest of the world (Ref year=2016) Contd…
  • 38. Anti-Dumping and Safeguard Measures India conducts anti-dumping investigations on the basis of applications filed by the domestic industry with prima facie evidence of dumping of goods. The countries involved in these investigations are China PR, Hong Kong, Korea, Germany, EU, USA, Malaysia, South Africa, Thailand, Brazil among others. During the period from 01.04.2018 to 31.03.2019, Directorate General of Trade Remedies (DGTR) initiated 24 anti-dumping (both fresh and review) investigations, and issued final findings in 50 anti- dumping investigations. DGTR is also in the process of developing a web application for online submission of petitions, information, submissions, rejoinders etc. related to antidumping/ countervailing/ anti-circumvention investigations.
  • 39. Conclusion The WEO, April 2019 has forecast acceleration of world output in second half of 2019. The key assumptions in this regard are continued accommodative monetary policy stance in advanced countries and fiscal stimulus in China and de-escalation of trade tensions between the US and China. There could be pressure on crude prices to increase as world output grows yet that may not impact India since growth in world output will also favourably impact India’s exports. From a macro-economic perspective the deterioration of CAD may be contained if consumption slows down in the economy while increase in investment and exports become the new drivers of the Indian economy.
  • 40. Thank You DVS Advisors LLP India-Singapore-London-Dubai-Malaysia-Africa www.dvsca.com Copyrights © 2019 DVS Advisors LLP