Download to read offline
![Experimental (5)
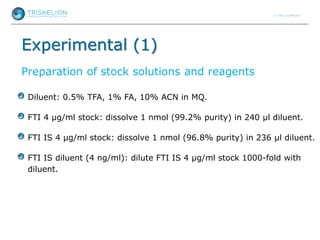
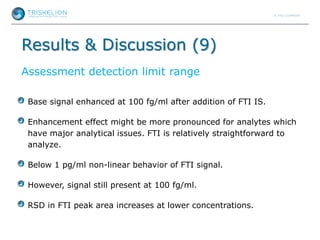
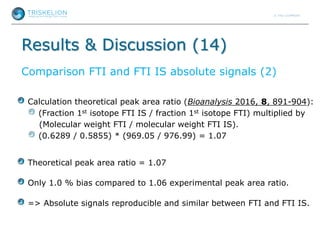
MS/MS conditions
Peptide Precursor
ion (m/z)
Product
ion (m/z)
Dwell time
(ms)
Cone
(V)
Collision
energy
(eV)
Assignment
FTISADTSK 485.25 721.4
608.3
221.1
52
52
52
16
16
16
12
12
10
[M+2H]2+ => y7
+
[M+2H]2+ => y6
+
[M+2H]2+ => a2
+
FTISADTSK-13C6
15N2
(SIL IS)
489.25 729.4
616.3
221.1
52
52
52
16
16
16
12
12
10
[M+2H]2+ => y7
+
[M+2H]2+ => y6
+
[M+2H]2+ => a2
+
Quantifiers are underlined.
FTI and FTI IS MS/MS settings were matched.](https://image.slidesharecdn.com/exploringlc-mspeptidedynamicrange-161205174649/85/Exploring-LC-MS-peptide-dynamic-range-7-320.jpg)
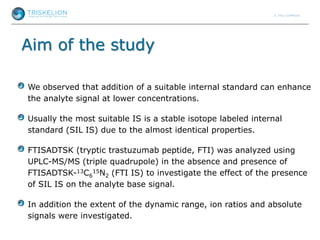
![Results & Discussion (12)
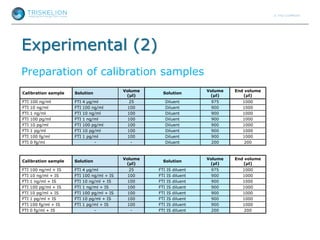
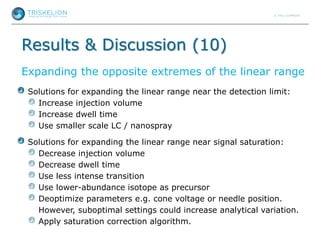
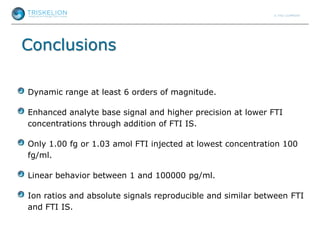
Ion ratios
Ion ratios are reproducible and similar between FTI and FTI IS
because the MS/MS settings were matched.
As expected, the presence of a C-terminal stable isotope labeled K
does not have a large impact on fragmentation behavior of FTI (IS).
By matching MS/MS settings for FTI and FTI IS, the latter can be used
as internal standard as well as calibrant, see also the next 2 slides.
Ion ratios
FTI: 0.1-100 ng/ml
FTI IS: 4 ng/ml
[M+2H]2+ => y7
+ / y6
+ [M+2H]2+ => y7
+ / a2
+ [M+2H]2+ => y6
+ / a2
+
FTI FTI IS FTI FTI IS FTI FTI IS
Average (n=24 for
FTI, n =24 for FTI IS)
1.72 1.72 2.68 2.69 1.56 1.56
RSD (%) 2.4 1.1 3.9 3.2 3.6 2.4](https://image.slidesharecdn.com/exploringlc-mspeptidedynamicrange-161205174649/85/Exploring-LC-MS-peptide-dynamic-range-19-320.jpg)

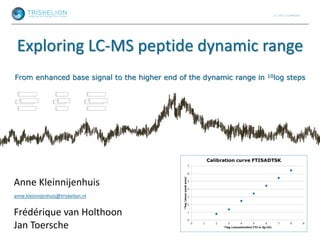
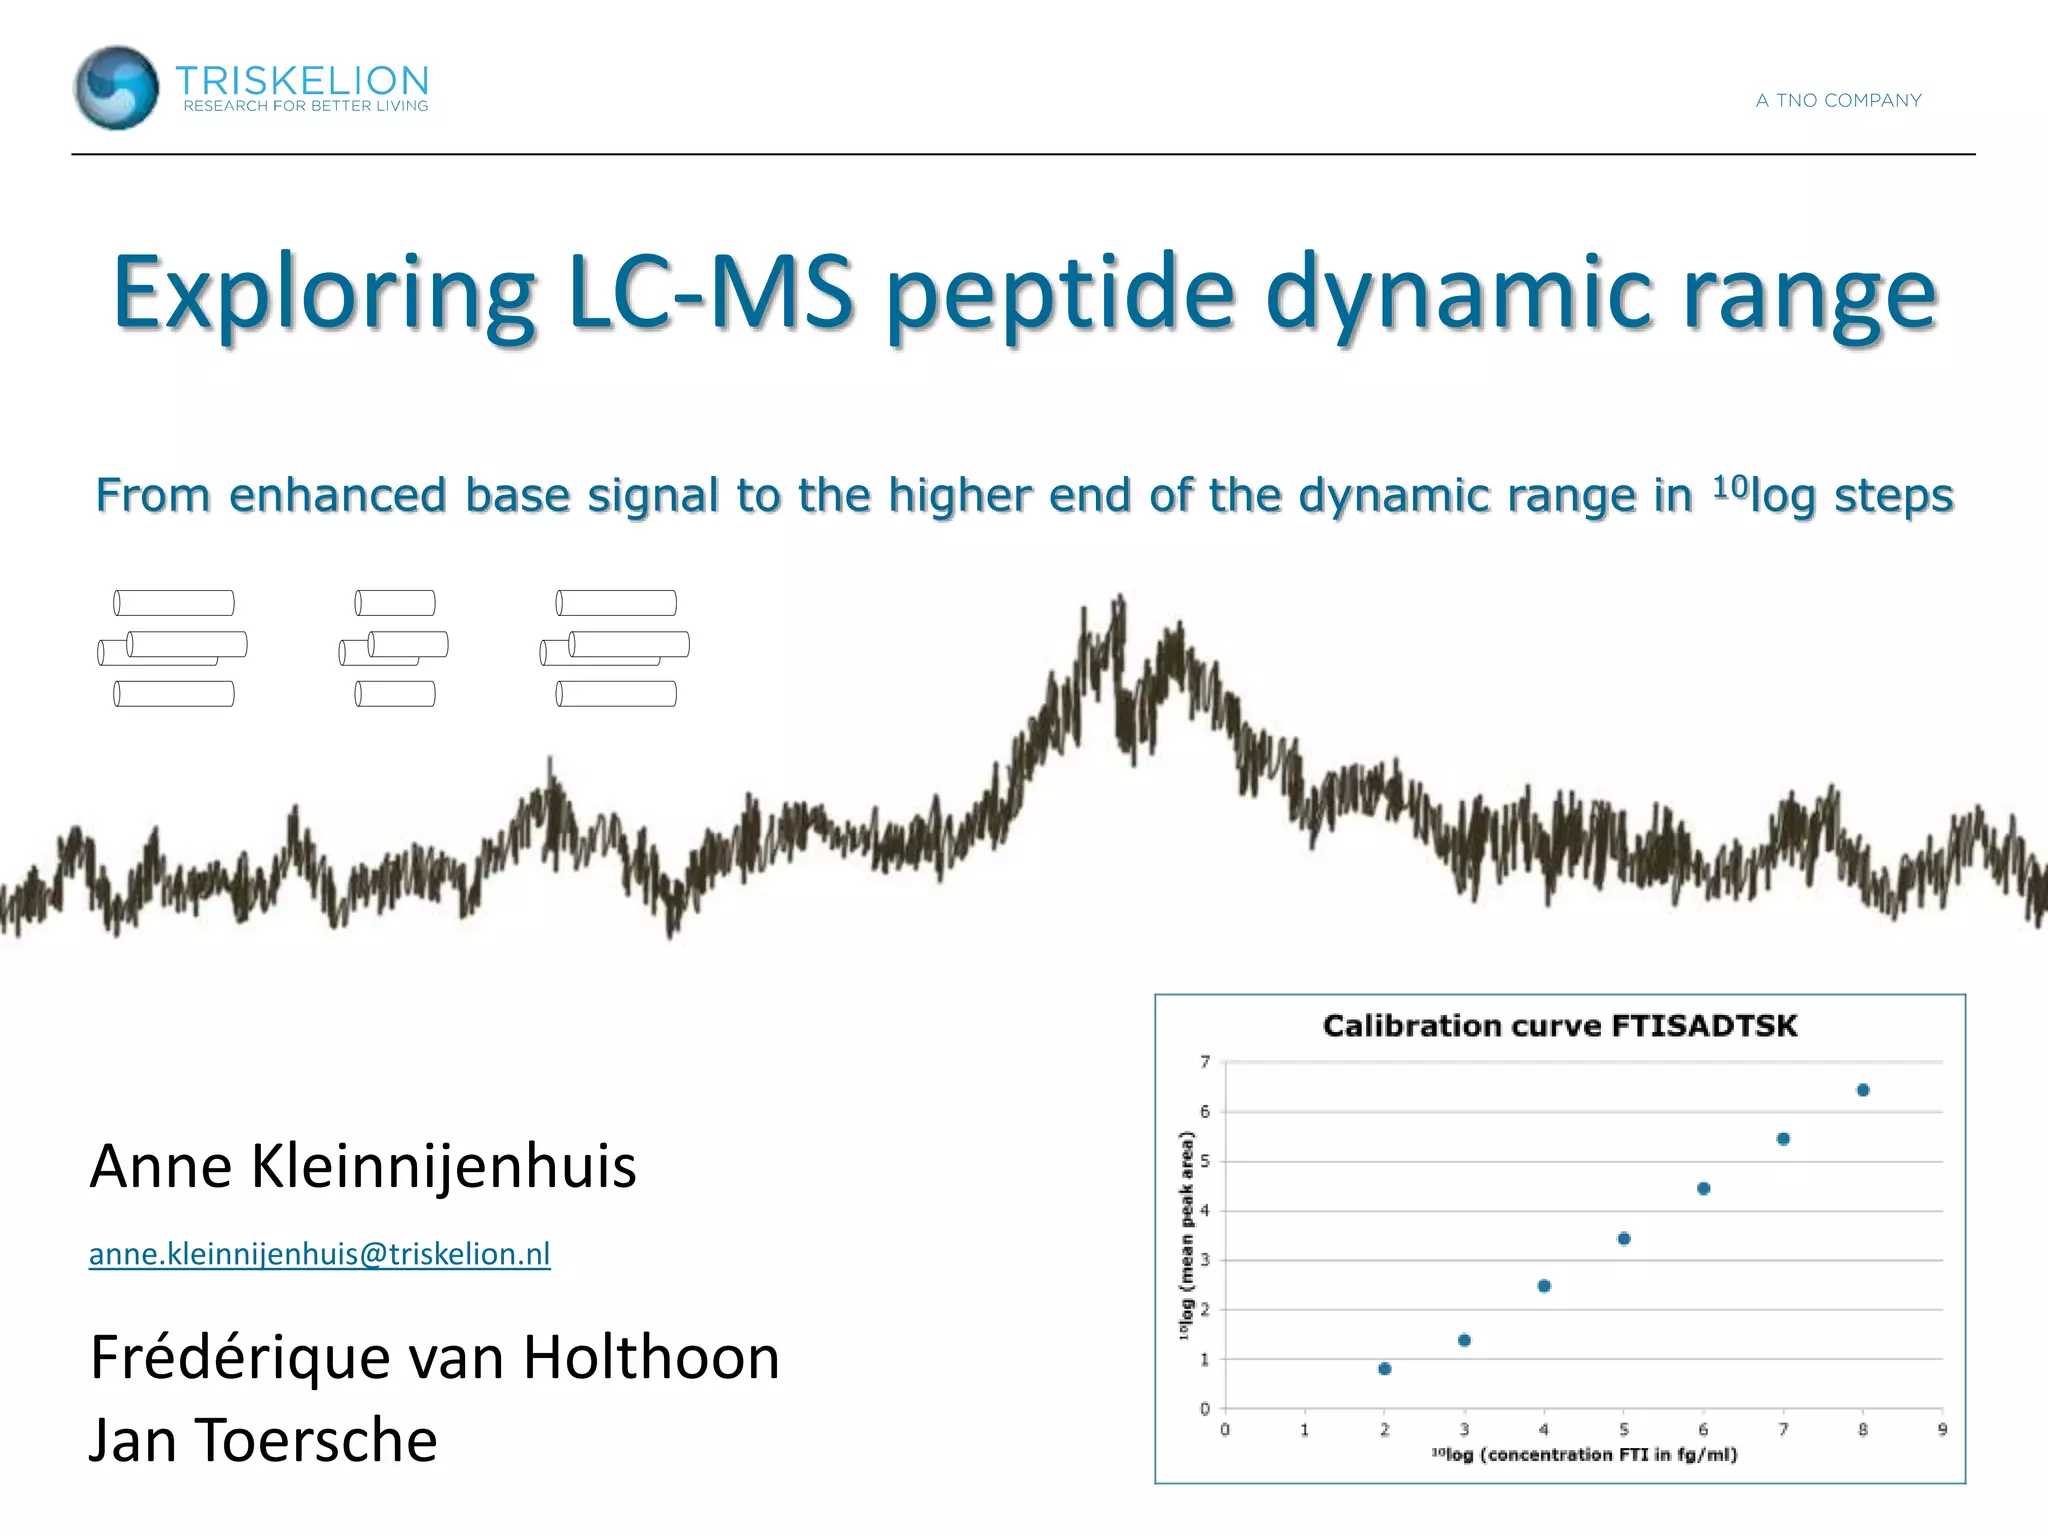
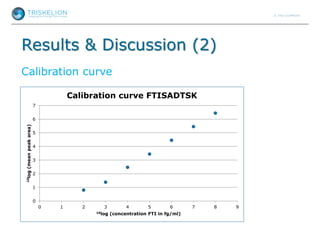
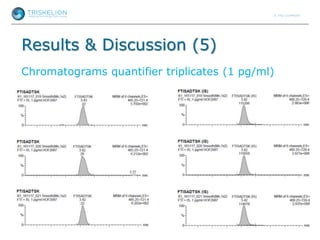
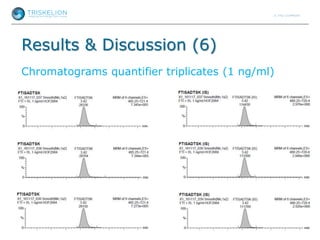
The study investigates the enhancement of analyte signals in LC-MS by utilizing a stable isotope labeled internal standard (SIL IS) for the peptide ftisadtsk. Results show that the addition of the SIL IS significantly improves base signal and precision at lower concentrations, maintaining a linear dynamic range of at least six orders of magnitude. The findings suggest that optimal experimental conditions and the presence of SIL IS can mitigate factors that typically degrade analytical performance.