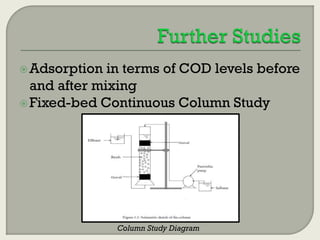
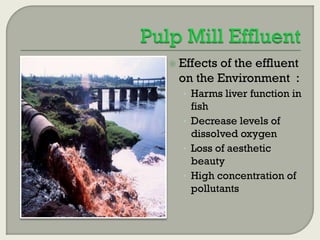
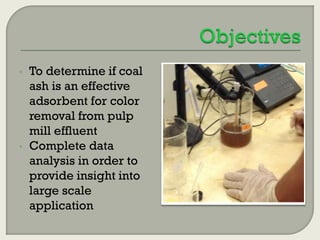
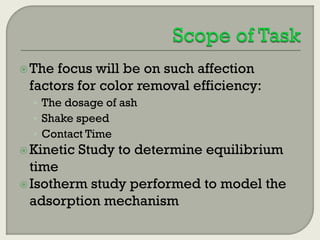
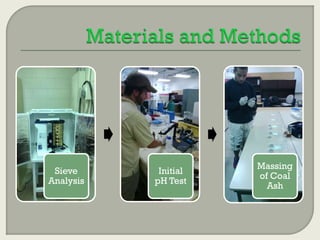
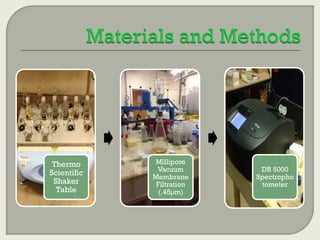
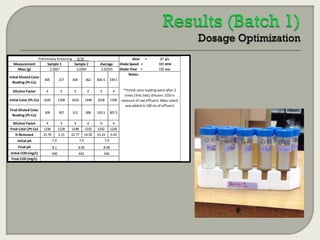
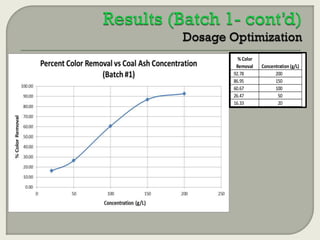
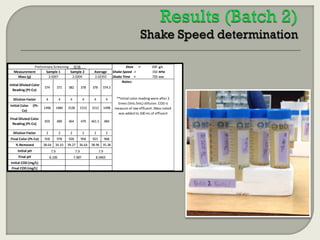
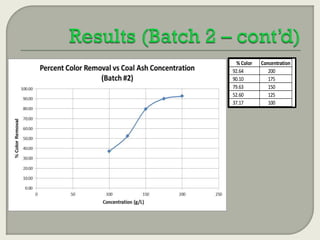
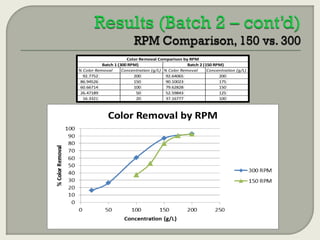
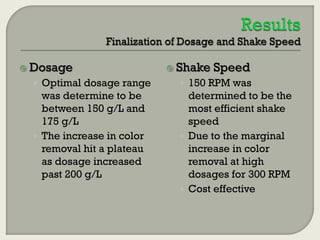
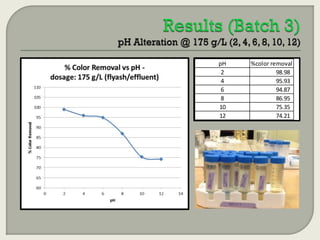
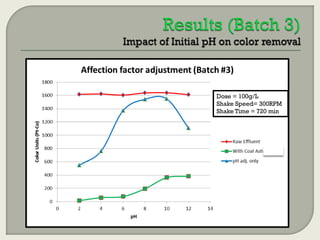
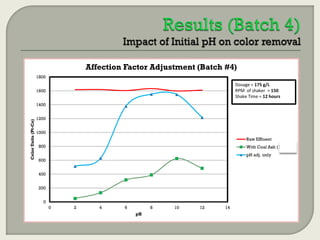
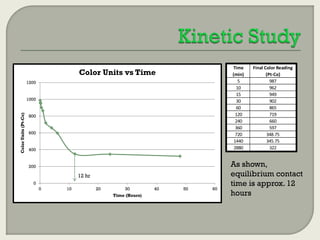
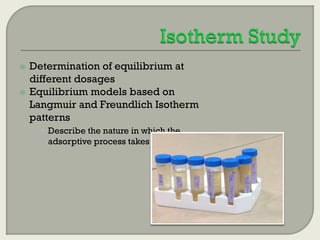
This document summarizes a student research project investigating the use of coal fly ash as an adsorbent for removing color from pulp mill effluent. The research team analyzed how factors like ash dosage, shake speed, contact time, and pH affected color removal efficiency. Equilibrium was reached within 12 hours, and dosage optimization found 175g/L of ash most effective. Adsorption models showed the process was more complicated than simple physical adsorption. The team received a research grant and plans to present findings at conferences. Further studies include analyzing COD levels and running continuous column tests.


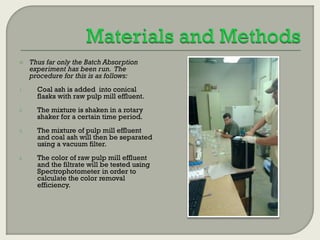
![Process:
Relates the adsorption of
mono-layer molecules onto a
solid surface area to
concentration of
adsorbate
Langmuir Isotherm
Equation is:
[non-linear]
[Linear]
*note: linear Langmuir
equation is in y=mx+b
form
1/Ce
0.00073
0.001071
0.001718
0.002677
0.004878
0.005563
0.005814
Expected Asorption Rate (q)
19.72386588
mg/g
b
-2.729
Langmuir Isotherm Model
0.12
1/adsorption capacity (1/qe)
1/qe
0.097491
0.019339
0.014456
0.013972
0.014126
0.015801
0.017695
0.1
y = -7.2275x + 0.0507
R² = 0.2583
0.08
0.06
0.04
0.02
0
0
0.001
0.002
0.003
0.004
0.005
0.006
Concentration of Color at Equilibrium (Ce)
0.007](https://image.slidesharecdn.com/finalpresentation2013-140306141722-phpapp01/85/Color-Removal-25-320.jpg)
![Process:
o
Relation of concentration
of a solute on the surface
of the media to the
concentration of solute left
in liquid
Freundlich
Isotherm Equation
is:
[non-linear]
[Linear]
*note: linear Freundlich
equation is in y=mx+b
form, but on log scale
Log Ce
3.136403
2.970347
2.764923
2.572291
2.311754
2.254669
2.235528
K
3.153
1/n
-0.5617
Freundlich Isotherm Model
2.000
1.800
1.600
1.400
log (qe)
log (qe )
1.011
1.714
1.840
1.855
1.850
1.801
1.752
1.200
y = -0.5617x + 3.153
R² = 0.4494
1.000
0.800
0.600
0.400
0.200
0.000
1.5
2
2.5
Log Ce
3
3.5](https://image.slidesharecdn.com/finalpresentation2013-140306141722-phpapp01/85/Color-Removal-26-320.jpg)