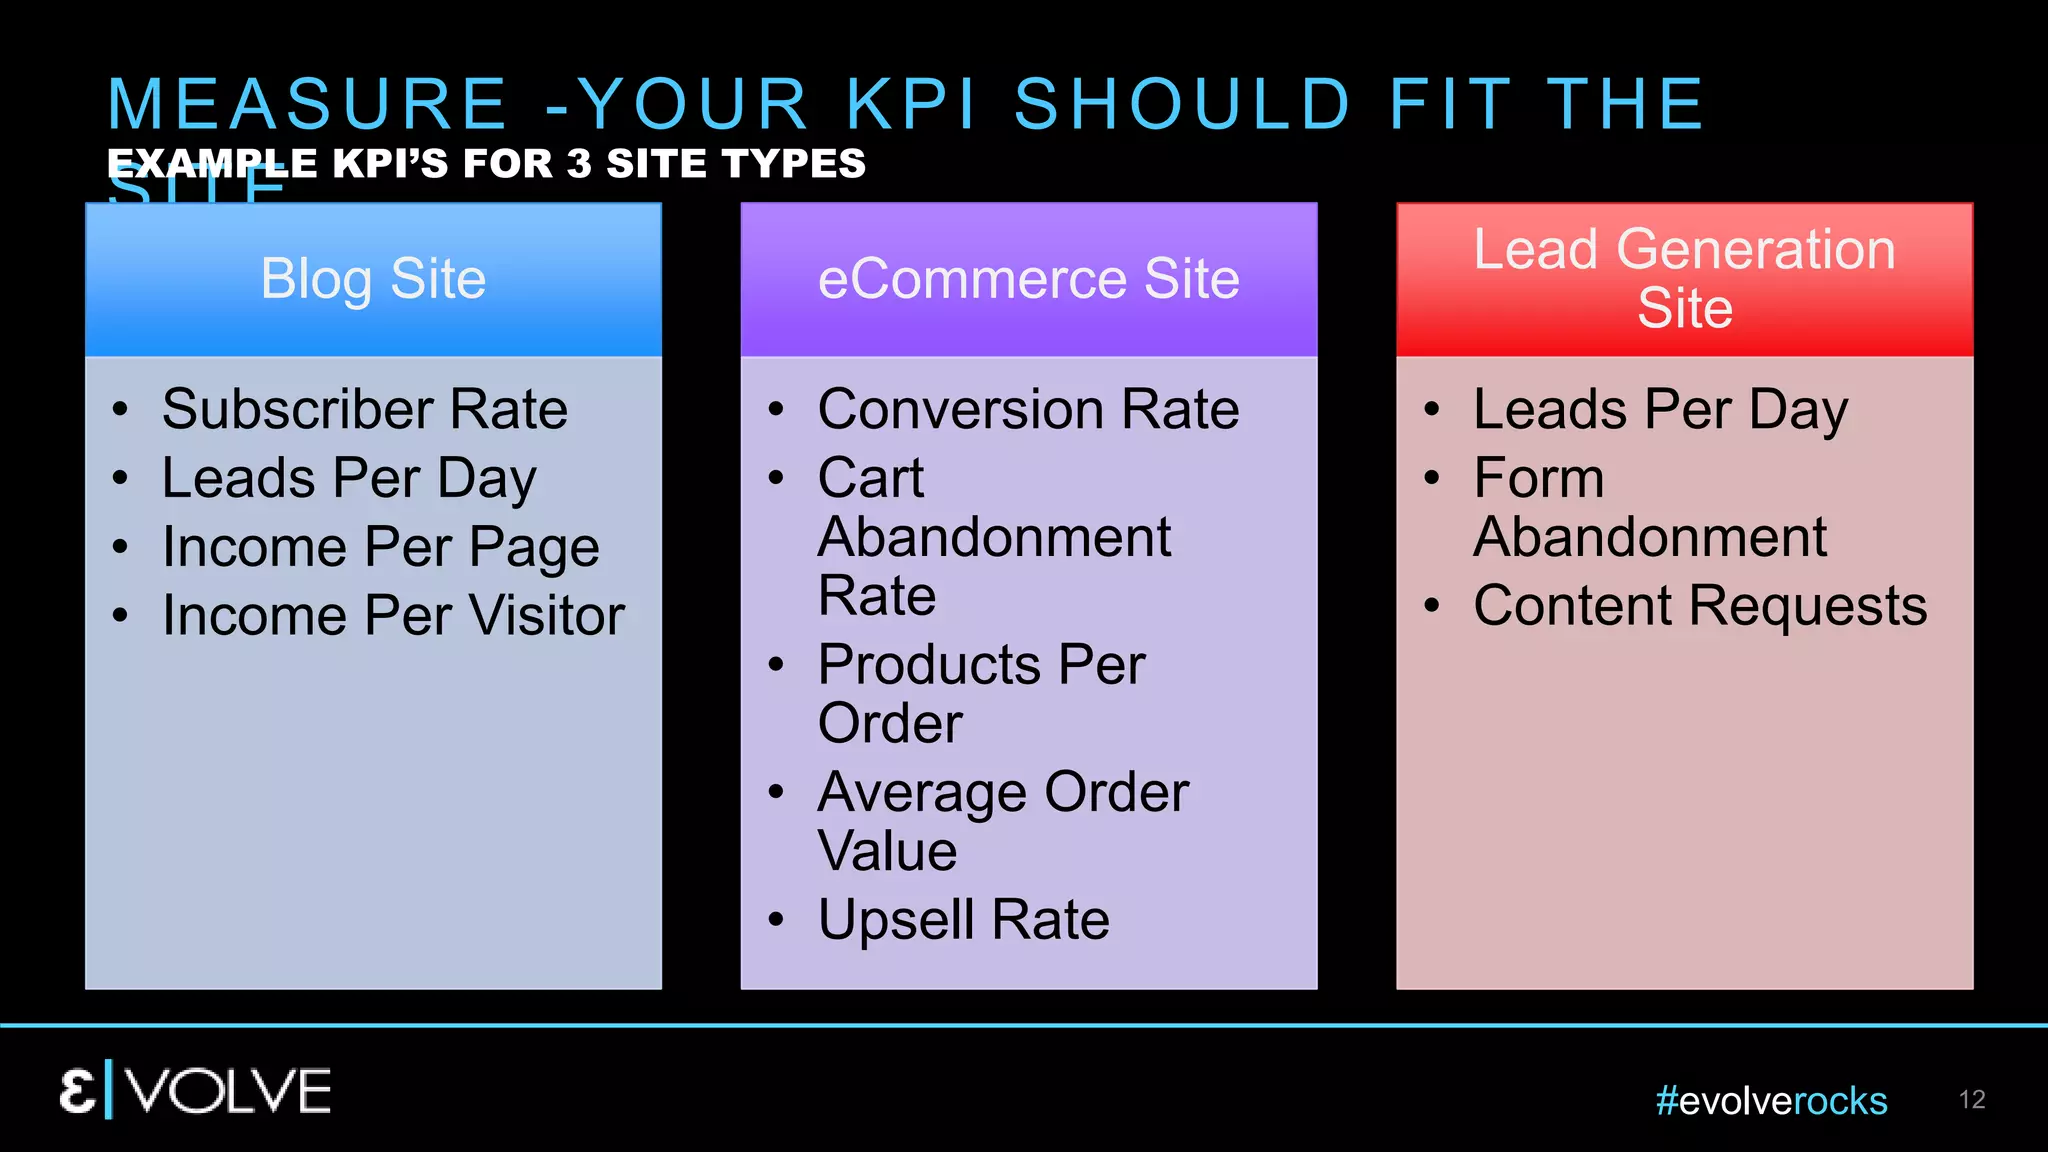
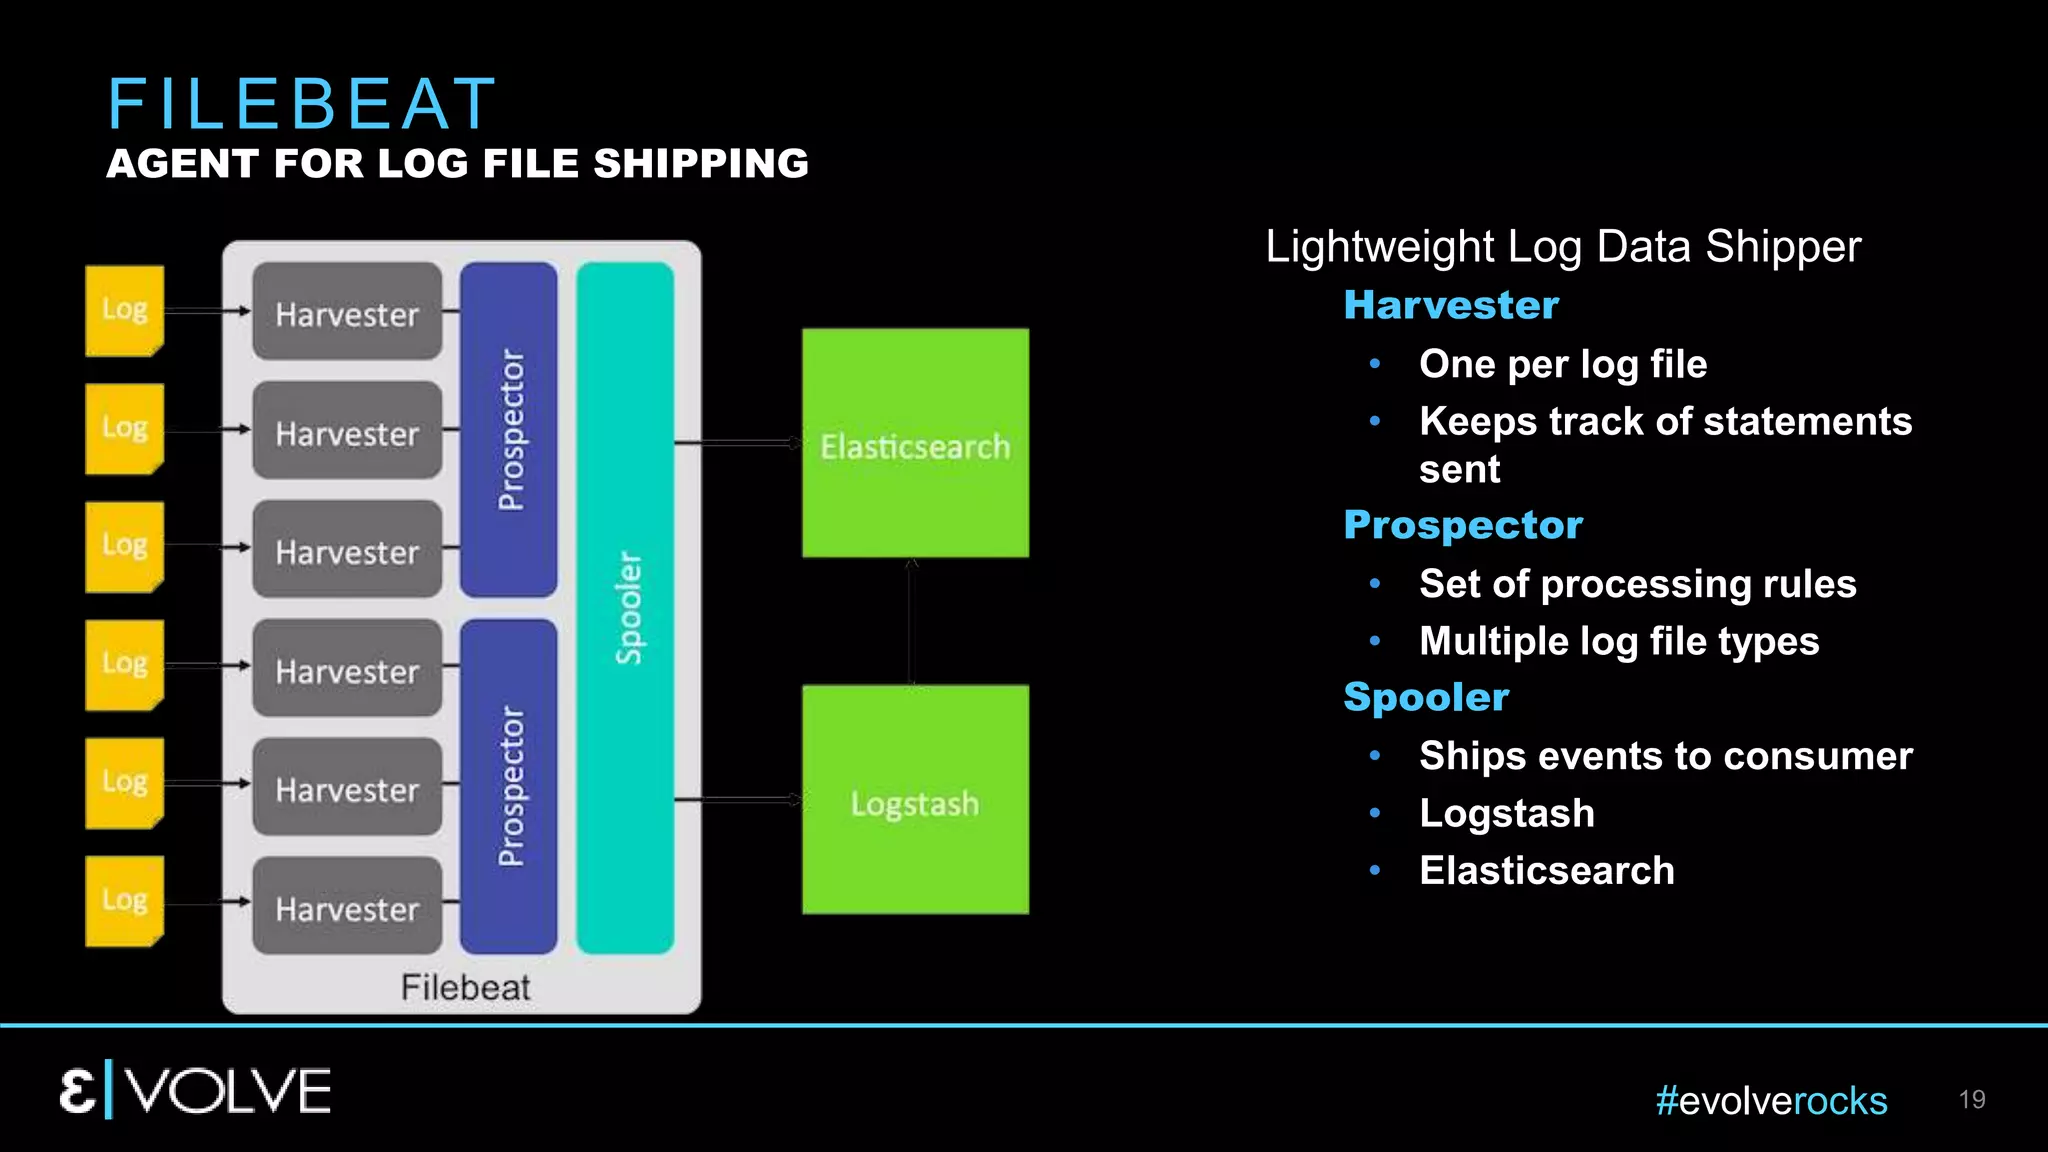
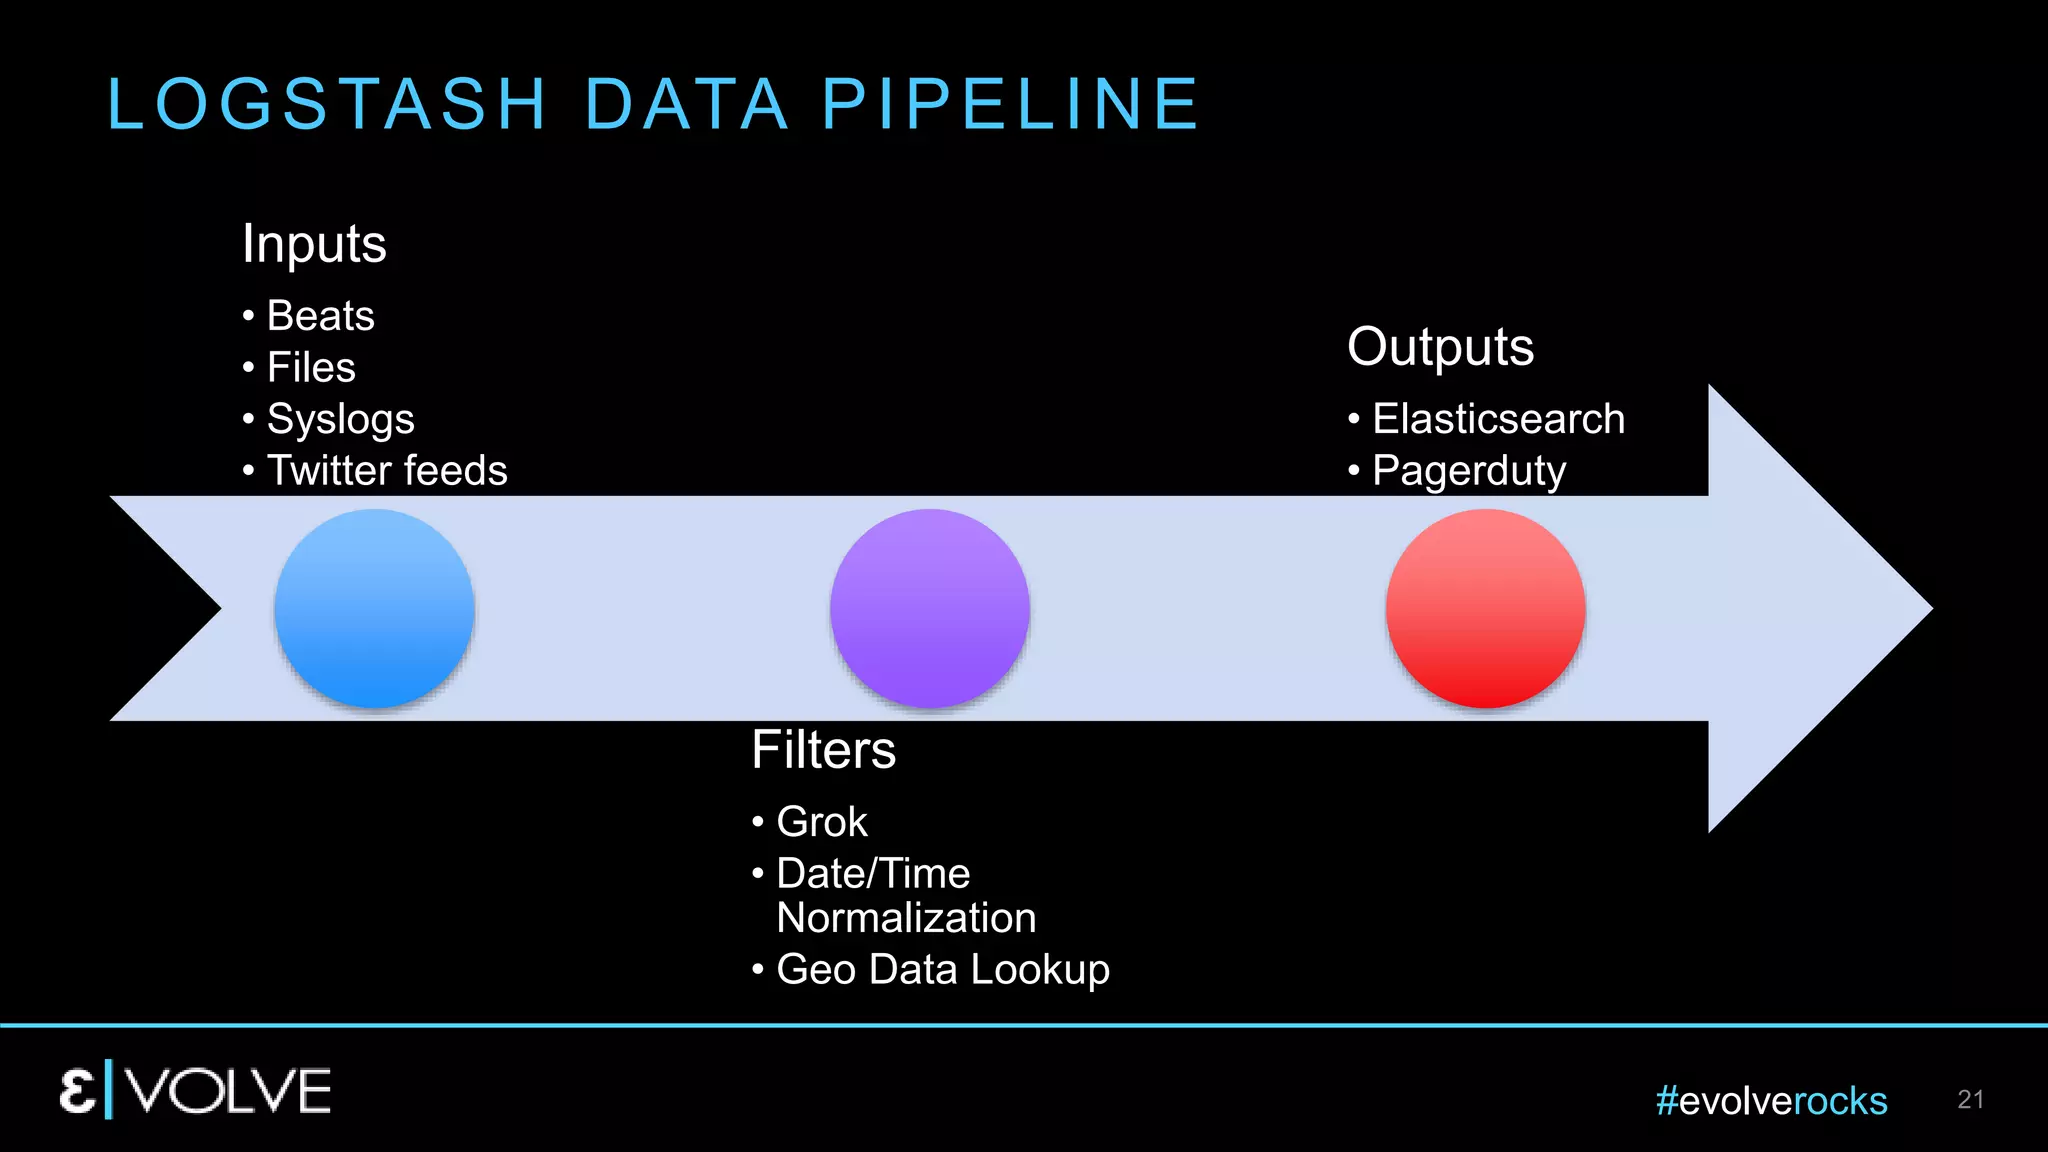
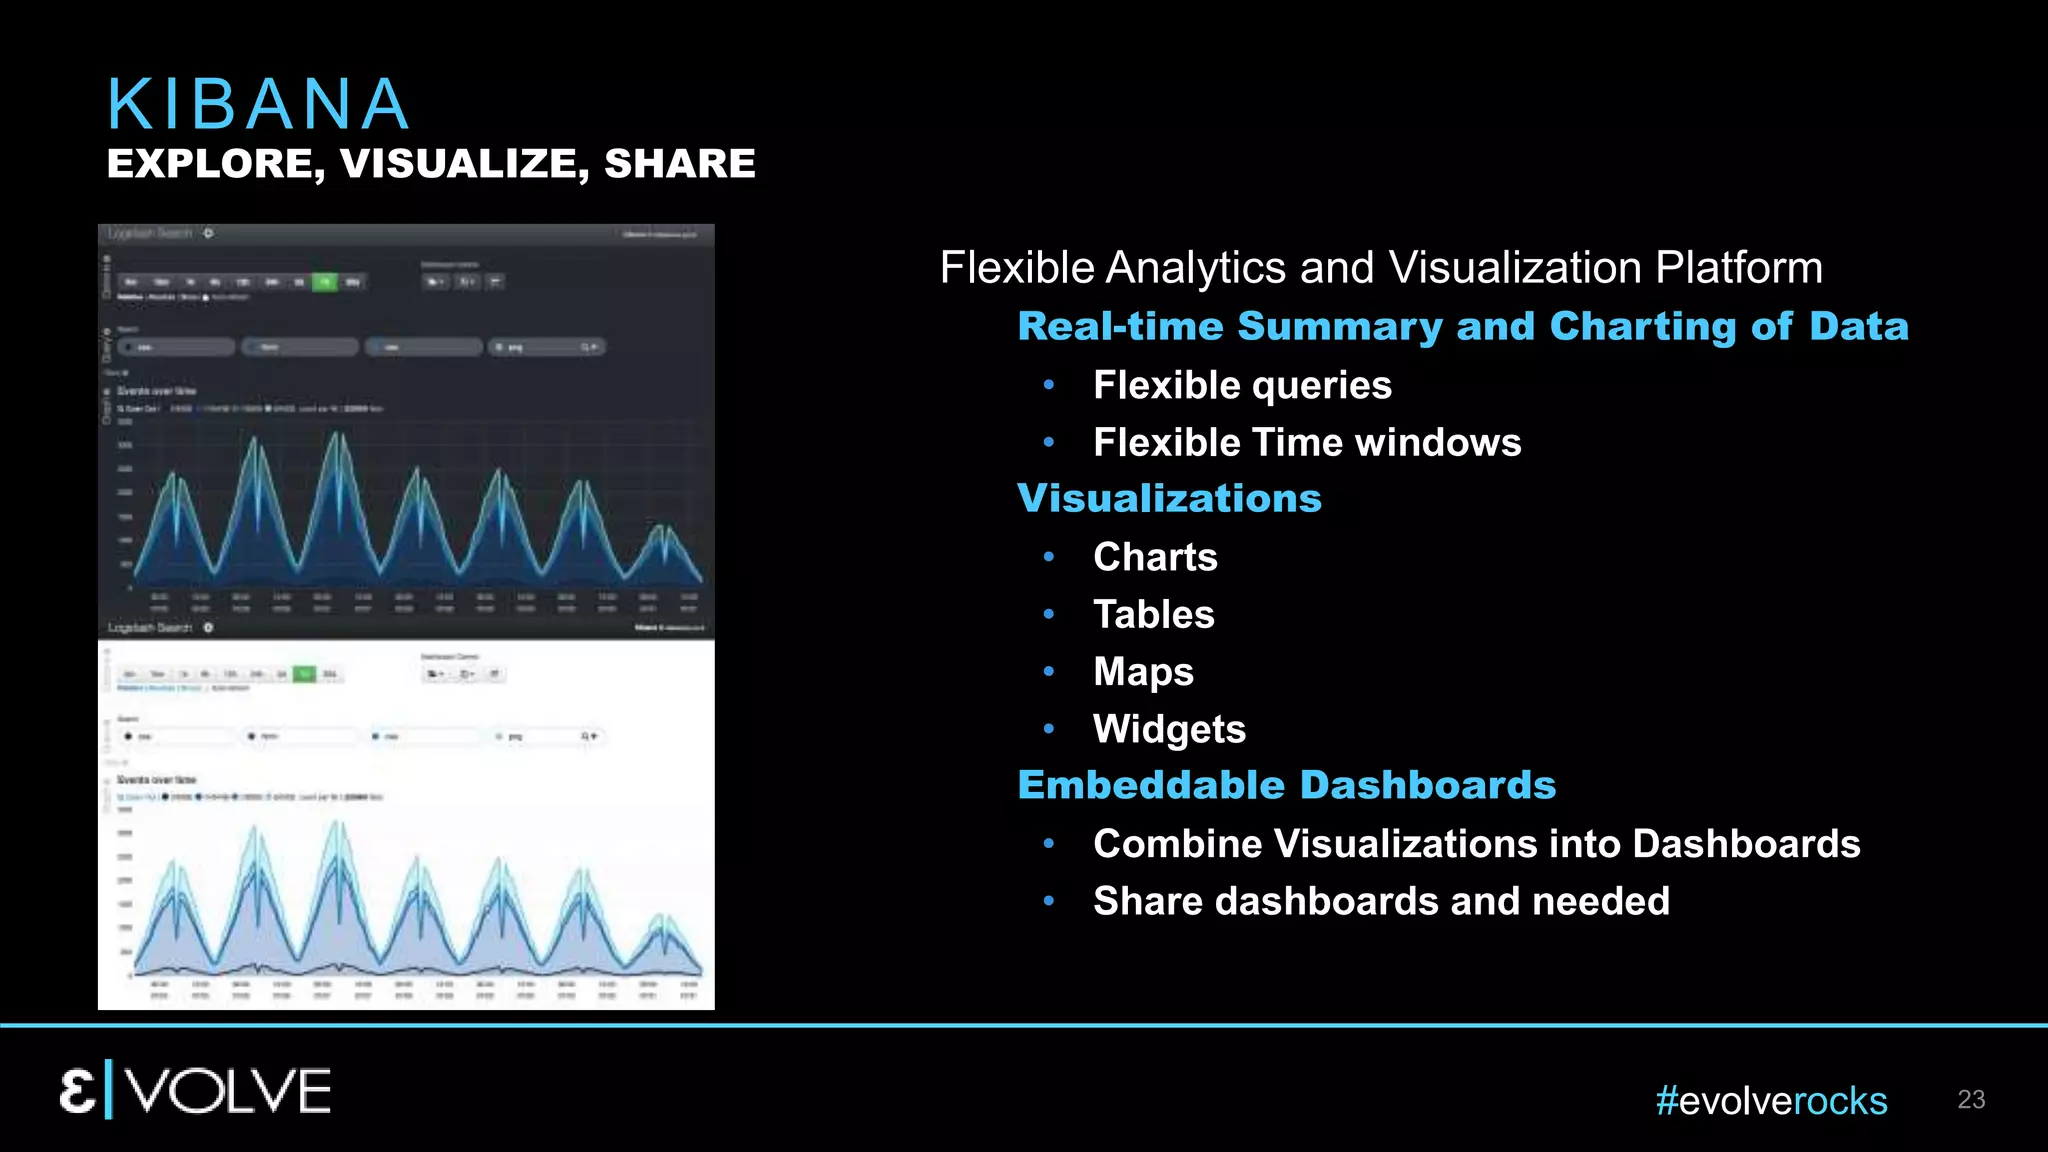
#evolverocks
REV UP YOUR MARKETING ENGINE
GORDON PIKE
3SHARE ARCHITECT
09/01/2016
#evolverocks 2
FINE TUNE YOUR AEM MARKETING ENGINE
THE KEY IS TO GET MORE FROM LESS
WHAT WOULD A 10% CONVERSION RATE MEAN TO YOUR BUSINESS?
WHAT ABOUT 15%, 20%, 25%?
#evolverocks 3
You already have them
You have an endless supply
• Medium to Large sites can
generate 20-30 GB a day
Usually collected and
forgotten
• Retained for a short time
• Used to diagnose issues
Can be used for much more
• Proactive improvement
• Business Insight
• Business user analysis
• User analysis
LET’S TALK ABOUT LOG DATA
I THOUGHT WE WERE TALKING ABOUT REVVING ENGINES?
#evolverocks 4
Source of real-time events
High performance collection
• Optimized for fast writes
• Minimal impact to request
• Other methods insert
themselves into the request
Analyze post collection
• Once stored can be queried
and visualized
Source of critical insights
• Your systems
• Your applications
• Your users
THERE’S GOLD IN THEM THERE LOGS
UNDER OUR NOSE ALL THE TIME
#evolverocks 5
LOG COLLECTION VS. INLINE COLLECTION
MULTIPLE WAYS TO GET YOUR METRICS
Log Collection
• Measured in nanoseconds or
microseconds
• Optimized for write
• Usually local write to server file
system
• Minimum impact on site
performance
• You already write to logs
Inline Collection
• Measured in milliseconds or
seconds
• Include JavaScript
• External Link
• External write
• Http requests
• Increases Page Latency
• Impacts site functionality
#evolverocks 6
TOP TEN USE CASES FOR LOG DATA
25,000 LOG MANAGEMENT USERS SURVEYED
Production
Monitoring,
71%Production
Troubleshooting, 66%
Debugging During
Development, 41%
Web Application
Analytics, 34%
Support, 32% Real User
Monitoring, 28%
Security, 22%
Quality Assurance
and Testing, 21%
Business Analytics,
10% Mobile Application
Analytics, 6%
All Other
Responses, 5%
Other, 42%
#evolverocks 7
LOG MANAGEMENT MATURITY LEVELS
Implement
• Debug during
development
• Verification of bugs
during testing
Troubleshoot
• Issue Forensics
• Root Cause
Analysis
Monitor
• Real User
Monitoring
• Performance
• Alerts
• Stabilize
environment
Analyze
• KPI Measurement
• Trend Analysis
• Track how
enhancements
add/subtract from
business goals
Reactive Proactive
#evolverocks 8
REVVING THE ENGINE
A COMPLETE LOG DATA STRATEGY IN 4 STEPS
Measure
Monitor
Discover
Audit
#evolverocks 9
MEASURE
IF YOU CAN'T MEASURE IT, YOU CAN'T IMPROVE IT.
- Peter Drucker
#evolverocks 10
MEASURE - NOT ALL METRICS ARE EQUAL
CHOOSE BALANCED FOOD NOT JUNK FOOD
Vanity Metrics
•# of Visits
•# Tweets
•Google Ranking
Common Metrics
• Requests per second
• Processing time
• Request timeouts
• Status codes
• Broken pipes
• Exceptions
Key Performance
Indicators
•Conversion Rate
•Cart Abandonment
Rate
•Products Per Order
#evolverocks 11
Is your Key Performance Indicator (KPI) SMART?
• Is the objective specific?
• Can you measure progress?
• Is the goal attainable?
• Is the goal relevant to your organization?
• What is the timeframe to achieve the goal?
MEASURE - CHOOSING A KPI
A KEY PERFORMANCE INDICATOR IS ONLY VALUABLE IF IT INSPIRES ACTION
#evolverocks 12
MEASURE -YOUR KPI SHOULD FIT THE
SITE
EXAMPLE KPI’S FOR 3 SITE TYPES
Blog Site
• Subscriber Rate
• Leads Per Day
• Income Per Page
• Income Per Visitor
eCommerce Site
• Conversion Rate
• Cart
Abandonment
Rate
• Products Per
Order
• Average Order
Value
• Upsell Rate
Lead Generation
Site
• Leads Per Day
• Form
Abandonment
• Content Requests
#evolverocks 13
MONITOR
TURNING MEASUREMENTS INTO ACTIONS
• Measure metrics
over time
• Establish norms
• Highlight deviations
Detect
• Dashboards
• Email
• Text
Alert • Identify routine
actions
• Automate actions
• Trigger action on
event
Automate
#evolverocks 14
DISCOVER
QUERY METRICS TO UNCOVER INSIGHTS
Normalize
Common
Date
formats
Enrich
Store
Flexible
Schema
Optimized
for Read
Search
Query
Learn/Query
Again
Analyze
Ask 5 Why's
Develop
Insights
#evolverocks 15
AUDIT
RETRIEVABLE HISTORY
Monitor
• Alert
Store
• Restrict access
• External
• Preferably write once
Capture
• Input / Output validations
• Authentication
• Authorization
• Sessions
• Errors
• Legal Events
#evolverocks 16
BUILDING YOUR AEM ENGINE DIAGNOSTIC
SERVICE
ENTER ELK STACK
#evolverocks 17
ARCHITECTURE
Application
Collect,
Parse, Ship
Collect,
Enrich,
Transport
Store,
Search,
Analyze
Explore,
Visualize,
Share
Kibana Elasticsearch Logstash
Filebeat Author
Filebeat Publisher
Filebeat Dispatcher
#evolverocks 18
BEATS DATA COLLECTORS
Topbeat
•Infrastructure Metrics
•Resource Utilization
•CPU
•Memory
Metricbeat
•Fetches metrics on predefined intervals
•From operating system
•Operating System
•Services (Apache, etc.)
Packetbeat
• Network Data
• Web
• Database
• Other network protocols
Filebeat
• lightweight log forwarder
• Collect
• Pre-processes
• Forwards
Beats
#evolverocks 19
Lightweight Log Data Shipper
Harvester
• One per log file
• Keeps track of statements
sent
Prospector
• Set of processing rules
• Multiple log file types
Spooler
• Ships events to consumer
• Logstash
• Elasticsearch
FILEBEAT
AGENT FOR LOG FILE SHIPPING
#evolverocks 20
Real time Pipeline
Unify Data From Disparate
Sources
• Log files
• Geo data
• Twitter feed
Data Normalization
• Convert date formats
• Common field names
Pluggable Pipeline Architecture
• Inputs
• Filters
• Output
LOGSTASH
DATA COLLECTION ENGINE
#evolverocks 21
LOGSTASH DATA PIPELINE
Inputs
• Beats
• Files
• Syslogs
• Twitter feeds
Filters
• Grok
• Date/Time
Normalization
• Geo Data Lookup
Outputs
• Elasticsearch
• Pagerduty
#evolverocks 22
Real time Pipeline
Document Oriented Storage
• All fields indexed by default
• Schema-Free
Searchable
• All data searchable
• Full-Text search
• Automatically detects data structure and
type
Analyze
• Powerful query language
• Built on Lucene
ELASTICSEARCH
STORE, SEARCH AND ANALYZE
#evolverocks 23
Flexible Analytics and Visualization Platform
Real-time Summary and Charting of Data
• Flexible queries
• Flexible Time windows
Visualizations
• Charts
• Tables
• Maps
• Widgets
Embeddable Dashboards
• Combine Visualizations into Dashboards
• Share dashboards and needed
KIBANA
EXPLORE, VISUALIZE, SHARE
#evolverocks 24
ARCHITECTURE WITH AEM
LogsAuthor
Publisher
Dispatcher
CDN
Logs
Logs
Logs
Logstash
Elasticsearch
Kibana
Author
Publisher
Dispatcher
CDN
Filebeat
Filebeat
Filebeat
Filebeat
#evolverocks 25
DEMO TIME
#evolverocks 26
Q & A
#evolverocks 27
ABOUT US
Facebook
facebook.com/3share
Mail
Gordon.pike@3sharecorp.com
Twitter
twitter.com/gpike
Linkledin
linkledin.com/gordon-pike
Gordon Pike
Architect
3Share Corporation
Contact Us
www.3sharecorporation.com
Phone: 720.608.6159
#evolverocks
THANK YOU!

EVOLVE'16 | Enhance | Gordon Pike | Rev Up Your Marketing Engine

  • 1.
    #evolverocks REV UP YOURMARKETING ENGINE GORDON PIKE 3SHARE ARCHITECT 09/01/2016
  • 2.
    #evolverocks 2 FINE TUNEYOUR AEM MARKETING ENGINE THE KEY IS TO GET MORE FROM LESS WHAT WOULD A 10% CONVERSION RATE MEAN TO YOUR BUSINESS? WHAT ABOUT 15%, 20%, 25%?
  • 3.
    #evolverocks 3 You alreadyhave them You have an endless supply • Medium to Large sites can generate 20-30 GB a day Usually collected and forgotten • Retained for a short time • Used to diagnose issues Can be used for much more • Proactive improvement • Business Insight • Business user analysis • User analysis LET’S TALK ABOUT LOG DATA I THOUGHT WE WERE TALKING ABOUT REVVING ENGINES?
  • 4.
    #evolverocks 4 Source ofreal-time events High performance collection • Optimized for fast writes • Minimal impact to request • Other methods insert themselves into the request Analyze post collection • Once stored can be queried and visualized Source of critical insights • Your systems • Your applications • Your users THERE’S GOLD IN THEM THERE LOGS UNDER OUR NOSE ALL THE TIME
  • 5.
    #evolverocks 5 LOG COLLECTIONVS. INLINE COLLECTION MULTIPLE WAYS TO GET YOUR METRICS Log Collection • Measured in nanoseconds or microseconds • Optimized for write • Usually local write to server file system • Minimum impact on site performance • You already write to logs Inline Collection • Measured in milliseconds or seconds • Include JavaScript • External Link • External write • Http requests • Increases Page Latency • Impacts site functionality
  • 6.
    #evolverocks 6 TOP TENUSE CASES FOR LOG DATA 25,000 LOG MANAGEMENT USERS SURVEYED Production Monitoring, 71%Production Troubleshooting, 66% Debugging During Development, 41% Web Application Analytics, 34% Support, 32% Real User Monitoring, 28% Security, 22% Quality Assurance and Testing, 21% Business Analytics, 10% Mobile Application Analytics, 6% All Other Responses, 5% Other, 42%
  • 7.
    #evolverocks 7 LOG MANAGEMENTMATURITY LEVELS Implement • Debug during development • Verification of bugs during testing Troubleshoot • Issue Forensics • Root Cause Analysis Monitor • Real User Monitoring • Performance • Alerts • Stabilize environment Analyze • KPI Measurement • Trend Analysis • Track how enhancements add/subtract from business goals Reactive Proactive
  • 8.
    #evolverocks 8 REVVING THEENGINE A COMPLETE LOG DATA STRATEGY IN 4 STEPS Measure Monitor Discover Audit
  • 9.
    #evolverocks 9 MEASURE IF YOUCAN'T MEASURE IT, YOU CAN'T IMPROVE IT. - Peter Drucker
  • 10.
    #evolverocks 10 MEASURE -NOT ALL METRICS ARE EQUAL CHOOSE BALANCED FOOD NOT JUNK FOOD Vanity Metrics •# of Visits •# Tweets •Google Ranking Common Metrics • Requests per second • Processing time • Request timeouts • Status codes • Broken pipes • Exceptions Key Performance Indicators •Conversion Rate •Cart Abandonment Rate •Products Per Order
  • 11.
    #evolverocks 11 Is yourKey Performance Indicator (KPI) SMART? • Is the objective specific? • Can you measure progress? • Is the goal attainable? • Is the goal relevant to your organization? • What is the timeframe to achieve the goal? MEASURE - CHOOSING A KPI A KEY PERFORMANCE INDICATOR IS ONLY VALUABLE IF IT INSPIRES ACTION
  • 12.
    #evolverocks 12 MEASURE -YOURKPI SHOULD FIT THE SITE EXAMPLE KPI’S FOR 3 SITE TYPES Blog Site • Subscriber Rate • Leads Per Day • Income Per Page • Income Per Visitor eCommerce Site • Conversion Rate • Cart Abandonment Rate • Products Per Order • Average Order Value • Upsell Rate Lead Generation Site • Leads Per Day • Form Abandonment • Content Requests
  • 13.
    #evolverocks 13 MONITOR TURNING MEASUREMENTSINTO ACTIONS • Measure metrics over time • Establish norms • Highlight deviations Detect • Dashboards • Email • Text Alert • Identify routine actions • Automate actions • Trigger action on event Automate
  • 14.
    #evolverocks 14 DISCOVER QUERY METRICSTO UNCOVER INSIGHTS Normalize Common Date formats Enrich Store Flexible Schema Optimized for Read Search Query Learn/Query Again Analyze Ask 5 Why's Develop Insights
  • 15.
    #evolverocks 15 AUDIT RETRIEVABLE HISTORY Monitor •Alert Store • Restrict access • External • Preferably write once Capture • Input / Output validations • Authentication • Authorization • Sessions • Errors • Legal Events
  • 16.
    #evolverocks 16 BUILDING YOURAEM ENGINE DIAGNOSTIC SERVICE ENTER ELK STACK
  • 17.
  • 18.
    #evolverocks 18 BEATS DATACOLLECTORS Topbeat •Infrastructure Metrics •Resource Utilization •CPU •Memory Metricbeat •Fetches metrics on predefined intervals •From operating system •Operating System •Services (Apache, etc.) Packetbeat • Network Data • Web • Database • Other network protocols Filebeat • lightweight log forwarder • Collect • Pre-processes • Forwards Beats
  • 19.
    #evolverocks 19 Lightweight LogData Shipper Harvester • One per log file • Keeps track of statements sent Prospector • Set of processing rules • Multiple log file types Spooler • Ships events to consumer • Logstash • Elasticsearch FILEBEAT AGENT FOR LOG FILE SHIPPING
  • 20.
    #evolverocks 20 Real timePipeline Unify Data From Disparate Sources • Log files • Geo data • Twitter feed Data Normalization • Convert date formats • Common field names Pluggable Pipeline Architecture • Inputs • Filters • Output LOGSTASH DATA COLLECTION ENGINE
  • 21.
    #evolverocks 21 LOGSTASH DATAPIPELINE Inputs • Beats • Files • Syslogs • Twitter feeds Filters • Grok • Date/Time Normalization • Geo Data Lookup Outputs • Elasticsearch • Pagerduty
  • 22.
    #evolverocks 22 Real timePipeline Document Oriented Storage • All fields indexed by default • Schema-Free Searchable • All data searchable • Full-Text search • Automatically detects data structure and type Analyze • Powerful query language • Built on Lucene ELASTICSEARCH STORE, SEARCH AND ANALYZE
  • 23.
    #evolverocks 23 Flexible Analyticsand Visualization Platform Real-time Summary and Charting of Data • Flexible queries • Flexible Time windows Visualizations • Charts • Tables • Maps • Widgets Embeddable Dashboards • Combine Visualizations into Dashboards • Share dashboards and needed KIBANA EXPLORE, VISUALIZE, SHARE
  • 24.
    #evolverocks 24 ARCHITECTURE WITHAEM LogsAuthor Publisher Dispatcher CDN Logs Logs Logs Logstash Elasticsearch Kibana Author Publisher Dispatcher CDN Filebeat Filebeat Filebeat Filebeat
  • 25.
  • 26.
  • 27.
  • 28.

Editor's Notes

  • #2 Good Afternoon Today
  • #3 You’ve invested in experience manager. You have a great site What if you can make it better
  • #4 We all have them There sitting out there Collecting dust
  • #5 Optimized for collection Has actionable information Invaluable to your business Fine tune your investment
  • #6 Define Inline Collection Javascript include usually downloaded from an external CDN so that the vender has control over changes Metrics are then shipped to either an outside service or an internal blackbox server Multiple http requests public internet Inline collection makes sense when it changes what content you display for the user. DTM etc. Story about IT VP We helped them develop a fast site There biggest problem is all the included scripts Source of revenue 20 million But some pages won’t load, content won’t show the whole site is a problem What if that data was collected another way.
  • #7 In a recent survey Users were asked what was the top use cases for Log Data The top ones everyone does as you would expect Debug during development Support Production Troubleshooting, monitoring Most stop there But less than 10% do any business analytics with the data? Why? The already have it?
  • #8  Implementation of the site: dev and qa Troubleshoot: Issues in production Monitor: Care and feeding of a running system Analyze: Now we are talking As we move up the scale we Move from Reactive to Proactive KEY PERFORMANCE INDICATORS
  • #9 A complete Log data strategy includes these 4 aspects Measure Monitor Discover Audit
  • #10 Sometimes the act of measuring can cause an increase When dieting just the act of weighing can cause a decrease Bring what matters to your business into focus
  • #11 Vanity metrics can be easy to track but can be superficial They are the Cotton Candy of measurements Look for more value KPI’s are value dense Help focus the whole organization on the true goals. Everyone in the organization should know what’s most important All actions should contribute to those goals
  • #12 Specific Measurable Attainable Relevant Timeframe
  • #13 3 site types The KPI’s measure the goals
  • #14 Monitoring is important and necessary Detect problems as early as possible Shout it out Automate canned responses Models how our brain works Habits and unconscious decision making Have you ever been driving and get home and can’t remember how you came
  • #15 Normalize Common data types Enrich with data from other source Store Make it easy to store everything Optimize for read Search Query language Learn and let that lead you to more queries Rinse/Lather/Repeat Analyze Borrow from Six Sigma ask the 5 whys Often it helps uncover the true reasons Get insight into how things are running How the user experience truly is
  • #16 Monitor Alert Store Restrict access External Preferably write once Capture Input / Output validations Authentication Authorization Sessions Errors Legal Events