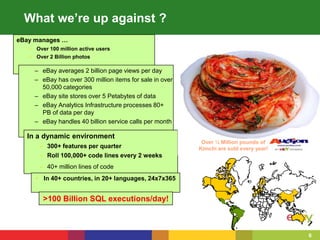
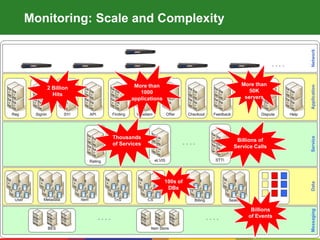
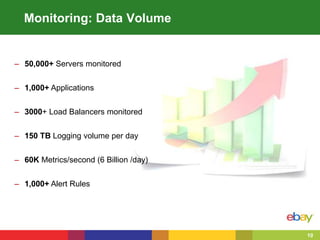
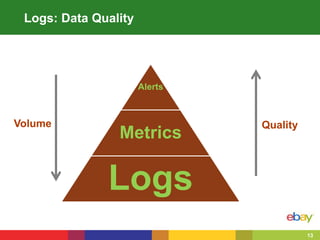
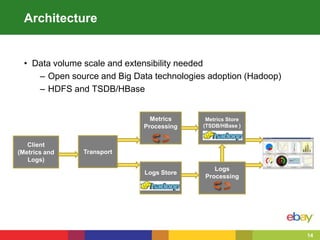
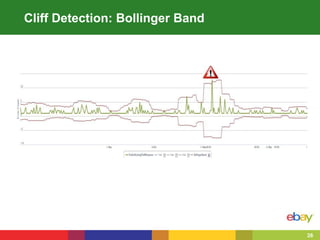
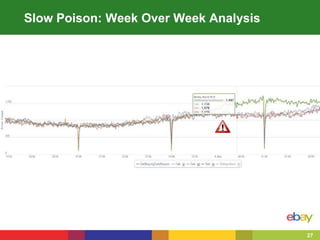
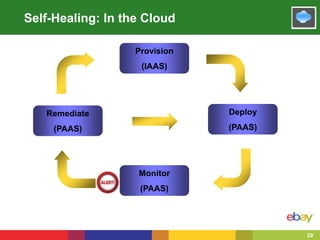
This document summarizes eBay's approach to monitoring Java applications at scale in the cloud. eBay manages over 100 million active users, 2 billion photos, and processes over 80 petabytes of data daily across more than 1000 applications running on over 50,000 servers. To handle this scale, eBay uses open source and big data technologies like Hadoop to process over 150 terabytes of log data daily and collect 60,000 metrics per second. eBay's monitoring includes logs, metrics, alerts, and self-healing capabilities to maintain service quality in such a large, dynamic environment.
This post talks about various architectural decision and their driving reasons which was taken to build an REST API which need to deliver large amount of reporting data.
[WSO2Con EU 2017] Open Interoperability of WSO2 Analytics PlatformWSO2
This document discusses how WSO2's analytics platform meets key expectations for interoperability. It outlines the typical components of an analytics solution, including collecting data from various sources using different protocols and formats, analyzing the data through integration with existing data stores and models, and communicating results through multiple transports and formats for alerting and storage. The document then provides examples of real-world use cases demonstrating interoperability in areas like receiving data from different sources, integrating with existing systems and data stores, and extending capabilities. Overall, the document promotes WSO2's analytics platform as being interoperable through its ability to easily integrate at various steps of the analytics process.
Slides for presentation on ZooKeeper I gave at Near Infinity (www.nearinfinity.com) 2012 spring conference.
The associated sample code is on GitHub at https://github.com/sleberknight/zookeeper-samples
Unified Monitoring Webinar with Dustin WhittleAppDynamics
Listen to the recorded webinar here: https://www.appdynamics.com/lp/q3-unified-monitoring-webinar/
Dustin Whittle, AppDynamics' Director of Web Engineering, covers
-the problems and struggles with monitoring tools today
-how to identify and resolve critical issues before your customers are impacted
-how AppDynamics provides one approach for unified monitoring
And much, much more!
Metrics at Scale @ UBER (Mantas Klasavicius Technology Stream)IT Arena
Lviv IT Arena is a conference specially designed for programmers, designers, developers, top managers, inverstors, entrepreneurs and startuppers. Annually it takes place at the beginning of October in Lviv at Arena Lviv stadium. In 2016 the conference gathered more than 1800 participants and over 100 speakers from companies like Microsoft, Philips, Twitter, UBER and IBM. More details about the conference at itarena.lviv.ua.
This document discusses managing performance for Java applications. It defines key performance metrics like response time, throughput, and availability. It describes different types of measurements that can be taken, such as cyclic and event-based measurements. It also discusses challenges in measuring performance across different systems and tools. Finally, it outlines common operations tasks for monitoring performance, detecting issues, and diagnosing problems.
Assessing New Databases– Translytical Use CasesDATAVERSITY
Organizations run their day-in-and-day-out businesses with transactional applications and databases. On the other hand, organizations glean insights and make critical decisions using analytical databases and business intelligence tools.
The transactional workloads are relegated to database engines designed and tuned for transactional high throughput. Meanwhile, the big data generated by all the transactions require analytics platforms to load, store, and analyze volumes of data at high speed, providing timely insights to businesses.
Thus, in conventional information architectures, this requires two different database architectures and platforms: online transactional processing (OLTP) platforms to handle transactional workloads and online analytical processing (OLAP) engines to perform analytics and reporting.
Today, a particular focus and interest of operational analytics includes streaming data ingest and analysis in real time. Some refer to operational analytics as hybrid transaction/analytical processing (HTAP), translytical, or hybrid operational analytic processing (HOAP). We’ll address if this model is a way to create efficiencies in our environments.
Kaseya Connect 2012 - THE ABC'S OF MONITORINGKaseya
Is Agent or Agentless the best approach to monitoring devices and applications? The answer is both. Join us as we review the various approaches and solutions that Kaseya offers to handle this complex question and how they will be enhanced over the coming year.
Presented by: Jeff Keyes, Product Marketing Manager & Scott Brackett, Product Manager
Monitoring Node.js Microservices on CloudFoundry with Open Source Tools and a...Tony Erwin
While microservice architectures offer lots of great benefits, there’s also a downside. Perhaps most notably, there is an increased complexity in monitoring the overall reliability and performance of the system. In addition, when problems are identified, finding a root cause can be a challenge. To ease these pains in managing the IBM Bluemix UI (made up of more than twenty microservices running on CloudFoundry), we’ve built a lightweight system using Node.js and other opensource tools to capture key metrics for all microservices (such as memory usage, CPU usage, speed and response codes for all inbound/outbound requests, etc.). In this approach, each microservice publishes lightweight messages (using MQTT) for all measurable events while a separate monitoring microservice subscribes to these messages. When the monitoring microservice receives a message, it stores the data in a time series DB (InfluxDB) and sends notifications if thresholds are violated. Once the data is stored, it can be visualized in Grafana to identify trends and bottlenecks. Tony Erwin will discuss the details of the Node.js implementation, real-world examples of how this system has been used to keep the Bluemix UI running smoothly without spending a lot of money, and how it’s acted as a “canary” to find problems in non-UI subsystems before the relevant teams even knew there was an issue!
Presented at Cloud Foundry Summit 2017: http://sched.co/AJmn
This document discusses Mesos implementation at Bloomberg. It notes that Bloomberg runs one of the largest private networks and was an early adopter of cloud computing and software as a service. It describes how Mesos is used to provide elastic data processing and analytics across Bloomberg's 3000+ developers. Key parts of the Mesos implementation include using Marathon for application deployment, Kafka for processing topologies, and ELK/InfluxDB/Grafana for centralized monitoring. The document also discusses lessons learned around access control, Zookeeper protection, and cleaning up sandbox data.
Effective Microservices In a Data-centric WorldRandy Shoup
From a talk at GOTOChicago 2017, these slides discuss the speaker's experiences at Stitch Fix with
* Organizational, Process, and Cultural prerequisites for being successful with Microservices: small teams, TDD / CD, DevOps
* How to handle shared data when your data is split among microservices
* How to handle "joins" across microservices
* How to simulate "transactions" across microservices
Slides link: https://gotochgo.com/3/sessions/79/slides
Video link: https://gotochgo.com/3/sessions/79/video
Building Streaming And Fast Data Applications With Spark, Mesos, Akka, Cassan...Lightbend
This webinar discusses building streaming and fast data applications with technologies like Spark, Mesos, Akka, Cassandra and Kafka. It covers how microservices and fast data architectures are converging due to similar design problems and data becoming the dominant problem. The webinar also introduces Lightbend's Fast Data Platform for building streaming data systems and microservices with best practices, sample applications and machine learning-based monitoring and management.
StatsCraft 2015: Introduction to monitoring - Yoav Abrahami and Mark SonisStatsCraft
This document discusses monitoring best practices. It defines monitoring as finding problems before users to minimize failure impact and enable fast recovery. Effective monitoring notifies the right people at the right time with precise information. It discusses measuring end user experience, application requests, system resources, databases, and alerts. The goal is to provide precise alerts to automate notifying the right people so issues can be addressed efficiently.
Monitoring Containerized Micro-Services In AzureAlex Bulankou
This document discusses best practices for monitoring containerized microservices applications in Azure. It begins with an introduction to Application Insights and describes the agenda. It then discusses what is different about monitoring microservices compared to monolithic applications and some factors to consider when choosing a monitoring system. The document provides recommendations for setting up day-to-day monitoring operations, including maintaining a 15 minute daily triage process focusing on business metrics, application performance and health, and infrastructure and costs. It concludes with a demo of monitoring a sample microservices application using Application Insights and other tools.
The document discusses API and big data solutions using WSO2 products. It begins by introducing WSO2 and its open source middleware platform. It then defines APIs and API management, describing how APIs can be used for both public and internal consumption. Next, it covers big data concepts like collecting, storing, and analyzing large datasets. It proposes several patterns for integrating APIs and big data, such as using API analytics for monitoring and control, billing and metering, targeted recommendations, and exposing datasets and analytics via APIs. Finally, it provides an example use case of using API and big data products to trigger alerts when new API versions become slower.
Monitoring and Scaling Redis at DataDog - Ilan Rabinovitch, DataDogRedis Labs
Think you have big data? What about high availability
requirements? At DataDog we process billions of data points every day including metrics and events, as we help the world
monitor the their applications and infrastructure. Being the world’s monitoring system is a big responsibility, and thanks to
Redis we are up to the task. Join us as we discuss how the DataDog team monitors and scales Redis to power our SaaS based monitoring offering. We will discuss our usage and deployment patterns, as well as dive into monitoring best practices for production Redis workloads
The adoption of container native and cloud native development practices presents new operational challenges. Today’s microservice environments are polyglot, distributed, container-based, highly-scalable, and ephemeral. To understand your system, you need to be able to follow the life of a request across numerous components distributed in multiple environments. Without the proper tools it can feel impossible to determine a root cause of an issue. This requires a new approach to operations. We will review a series of open source observability tools for logging, monitoring, and tracing to help developers achieve operational excellence for running container-based workloads.
The document summarizes the evolution of Intuit's big data pipelines over time from disparate and chaotic early stages to their current integrated cloud-based architecture. It describes how Intuit transitioned from siloed data storage to a single cohesive data pipeline using Apache Kafka and real-time processing. It outlines the key components of their current big data pipeline including real-time data collection, processing, profile storage, and monitoring systems and how this pipeline supports use cases like personalization, fraud detection and more.
Day 5 - Real-time Data Processing/Internet of Things (IoT) with Amazon KinesisAmazon Web Services
This document discusses Amazon Kinesis, a fully managed service for real-time processing of streaming data. It provides an overview of Kinesis and how it can be used to ingest, store, and process streaming data. Examples are given of how companies are using Kinesis for applications like game analytics, digital advertising metrics, and IoT data processing. The key benefits of Kinesis are also summarized such as its ease of use, real-time performance, elastic scalability, integration with other AWS services, and low cost.
This document discusses application performance management (APM) tools at Blackboard, including:
- The Blackboard performance team monitors servers, databases, and frontends using tools like New Relic, load generators, and profilers.
- APM tools provide visibility into performance issues through centralized monitoring, and help identify abnormal behaviors, anti-patterns, and diagnose root causes.
- Keys to success include choosing the right APM tool, automating deployments, constructing effective alert policies, and properly instrumenting applications.
- The document demonstrates New Relic and provides best practices around gradual deployment, right-sizing resources, and using APM data for troubleshooting.
Enterprises are Increasingly demanding realtime analytics and insights to power use cases like personalization, monitoring and marketing. We will present Pulsar, a realtime streaming system used at eBay which can scale to millions of events per second with high availability and SQL-like language support, enabling realtime data enrichment, filtering and multi-dimensional metrics aggregation.
We will discuss how Pulsar integrates with a number of open source Apache technologies like Kafka, Hadoop and Kylin (Apache incubator) to achieve the high scalability, availability and flexibility. We use Kafka to replay unprocessed events to avoid data loss and to stream realtime events into Hadoop enabling reconciliation of data between realtime and batch. We use Kylin to provide multi-dimensional OLAP capabilities.
Hadoop Summit 2016 - Evolution of Big Data Pipelines At IntuitRekha Joshi
This document summarizes the evolution of Intuit's big data pipelines over time. It discusses how the pipelines started as disparate and moved to a single cohesive pipeline. The stages of evolution included moving to real-time processing, high availability with mirroring, and integrating streaming and batch processing. Key components of the modern pipeline include Apache Kafka for event collection, real-time processing engines, and data storage in Hive. Testing ensures the pipeline meets throughput, latency, and data integrity requirements as the volumes and complexity increase.
This document discusses analytics and IoT. It covers key topics like data collection from IoT sensors, data storage and processing using big data tools, and performing descriptive, predictive, and prescriptive analytics. Cloud platforms and visualization tools that can be used to build end-to-end IoT and analytics solutions are also presented. The document provides an overview of building IoT solutions for collecting, analyzing, and gaining insights from sensor data.
What exactly is big data? The definition of big data is data that contains greater variety, arriving in increasing volumes and with more velocity. This is also known as the three Vs. Put simply, big data is larger, more complex data sets, especially from new data sources.
This talk focuses on how we used Amazon Kinesis to build the pub-sub infra at Lyft, that ingests more than a 100 billion events per day. We'll review the strengths and weaknesses of Kinesis as a choice for streaming events in realtime, at Lyft's scale; as well as the best practices and lessons learnt over time.
Speaker: Hafiz Hamid (Lyft)
Hafiz Hamid is a software engineer on the Pub-Sub/Streaming Platform team at Lyft. He has built some of the key pieces in the messaging & streaming infrastructure at Lyft. Previously, Hafiz was a technical lead at Bing Search where he worked on data pipelines, relevance and web crawlers.
Similar to Java one2013 monitoringatscaleincloud (20)
1. 1
Monitoring Java Applications at Scale In the Cloud:
Lessons from eBay
Raju Kolluru (Sr. Manager), eBay Inc., and
Mahesh Somani (Principal Architect), eBay Inc.
3. 3
eBay: The Biggest eCommerce Marketplace Platform
Founded in September 1995, eBay is a global online marketplace where
practically anyone can trade practically anything
From Devices to Diamonds . . .
4. 4
eBay: The Biggest eCommerce Marketplace Platform
Founded in September 1995, eBay is a global online
marketplace where practically anyone can trade practically
anything
From Clothing to Cameras . . . and more
5. 5
Founded in September 1995, eBay is a global online
marketplace where practically anyone can trade practically
anything
Cards, Missile Base, Cities, Jets, Yachts . . .
eBay: The Biggest eCommerce Marketplace Platform
6. 6
What we’re up against ?
eBay manages …
– Over 100 million active users
– Over 2 Billion photos
– eBay averages 2 billion page views per day
– eBay has over 300 million items for sale in over
50,000 categories
– eBay site stores over 5 Petabytes of data
– eBay Analytics Infrastructure processes 80+
PB of data per day
– eBay handles 40 billion service calls per month
In a dynamic environment
– 300+ features per quarter
– Roll 100,000+ code lines every 2 weeks
– 40+ million lines of code
• In 40+ countries, in 20+ languages, 24x7x365
>100 Billion SQL executions/day!
An SUV is sold every 5 minutesA sporting good sells every 2 seconds
Over ½ Million pounds of
Kimchi are sold every year!
9. 9
Monitoring: Scale and Complexity
Billions
of Events
100s of
DBs
Thousands
of Services
Billions of
Service Calls
More than
1000
applications
More than
50K
servers
2 Billion
Hits
14. 14
Logs
Processing
Architecture
• Data volume scale and extensibility needed
– Open source and Big Data technologies adoption (Hadoop)
– HDFS and TSDB/HBase
Client
(Metrics and
Logs)
Transport
Metrics
Processing
Metrics Store
(TSDB/HBase )
Logs Store
15. 15
Logs
• Advantages
– Temporal record
– Detailed
– Provides instance level information
– Distributed w/ co-relations
• Traditional Challenges
– Unstructured
– Decentralized
– Storage and retention
– Processing requires parsing
16. 16
Logs: Dealing w/ Challenges
• Client API’s
– Log different kind of information
• Transaction: Nested activities
• Transaction: Start and end of activity
– Additional structures
• Types (URL, Service, SQL)
• Names (Request name, Query name)
• Server
– Centralized storage
– Distributed processing (Hadoop)
– Volume: 150 TB / day (uncompressed). 5x compression
17. 17
Logs: Processing
• Processing
– Generate on-going reports and aggregation
– Converts logs to metrics
• Data breakdown along different dimensions
– Requests, Browsers, Experiments, Errors, Machines, IP
addresses, Geo
• On-demand processing. Distributed processing
– Search
– PIG / Hive / MR jobs
20. 20
Metrics and Events
• A Metric is a measure sampled over time.
– Has a metric id as unique identifies
– Has a value
• A gauge, that is a measurement
• A counter that increments (error counts, bytes
transferred).
– Has “tags” that uniquely identify instance of metric from others
• An Event is an occurrence indicating thing of interest. Events are
aperiodic.
21. 21
Metrics: When to use?
• Balance between volume and quality
– Short SLA (~seconds)
• Periodicity enables trending
• Client
– Convenience for users
– Dealing with volume
• Server
– Caching and in-memory processing
– Feed to other systems with real-time data
• Aggregation: Both client and server end
Volume Quality
22. 22
Metrics: Which metrics?
SAAS
Null searches SEO traffic Shipping option selection Unsuccessful login rate
PAAS
Requests per second Error per second Latency Services GC Overhead
IAAS
CPU Network Memory Disk Load Balancer
25. 25
Alerts
• Static thresholds
– E.g., Machine CPU > 70%, Response time > 500 ms
• Cliffs
– Bollinger bands
• Slow poison
– Day over day or week over week comparison
• Alerts and Alarms
– Multiple correlated alerts => Alarm(s)
– Alarms are time sensitive
• Proactive vs. Reactive detection
31. 31
Summary: Monitoring at Scale
Data in eBay is BIG and getting BIGGER. Need Big Data for Scale
Scope of Monitoring includes Logs, Metrics, Alerts and Self-Healing
Data Quality versus Data Volume
Multiple Client Sensors
Monitoring and management at Scale needs Self Healing
32. 32
Connect with us
o raju@ebay.com (@raju_kolluru)
o msomani@ebay.com (@mahesh_somani)
We are Hiring!
o Opportunities in Java, Big data, Software
applications and systems
indiajobs@ebay.com
Q & A
Editor's Notes
Platform Services pioneers the SAAS vision at eBay
[Raju] Can we have some other pic ? Should we change the topic to Monitoring Philosophy and Overview ?
Fonts are not very visible
Put Hadoop logos(elephant) & UI logo
We currently have 3 logging slides; will be good if we reduce by 1.
Cant see the text
Pretty Busy slide; reduce content by 20%
Show a Stack Diagram like the one in NHT
Dilbert cartoon
Alerts and Alarms: DifferencesStatic ThresholdCliffsSlows poison