Download as PDF, PPTX


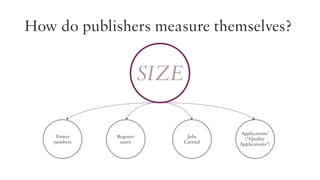


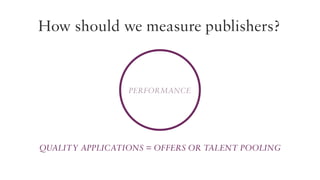
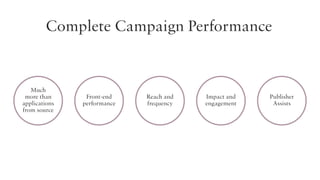
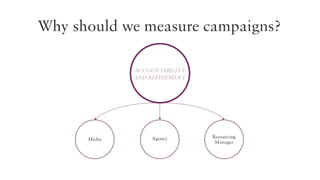

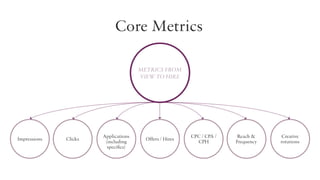
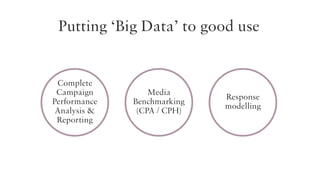

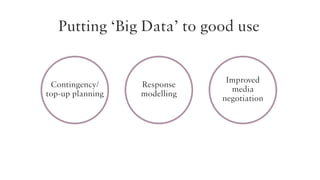


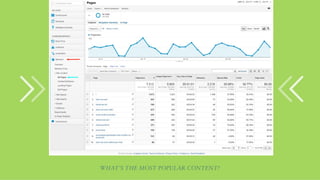
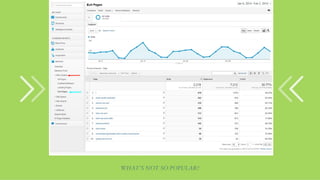

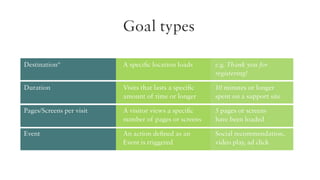
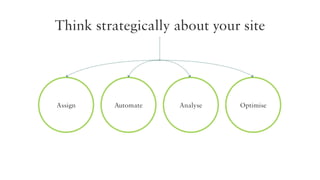


The document discusses measuring campaign performance in recruitment and the importance of web analytics for assessing online engagement. It highlights key metrics for evaluating performance, such as quality applications and bounce rates, and emphasizes the value of tools like Google Analytics for tracking website traffic and user behavior. Additionally, it outlines strategies for optimizing digital recruitment efforts and improving engagement with potential candidates.


