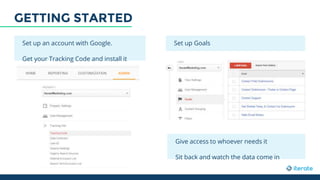
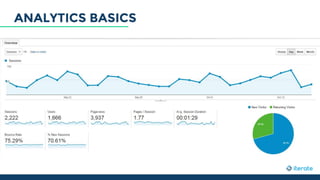
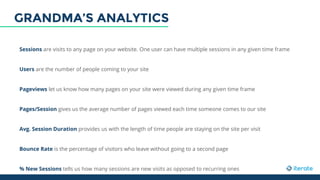
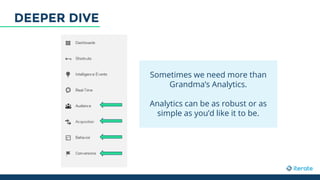
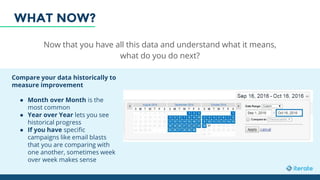
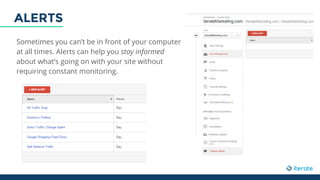
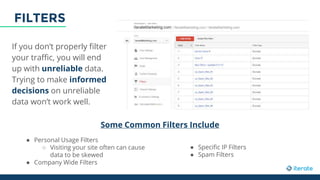
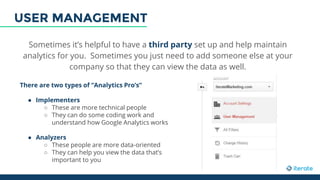
ANALYTICS 101
Down the rabbit hole we go
Presented By Garret Archer
ABOUT ME
I’ve been in the industry for about 3 years
I have the coolest dog
I somehow became a Minnesota Vikings fan being born and raised here
in Oregon and with Packer fans as family
I love spicy food
No one can beat me at UNO, Foosball, and other useless games.
I played soccer for 16 years
I’m a huge nerd when it comes to fantasy fiction. And Fantasy football.
Just Doing Dog Yoga
We’ve been in business for over 7 years
Collectively, our management has over 20 years experience in digital
marketing
We provide service to a broad spectrum of clients spanning
small/enterprise level, medium sized and global corporations
We’re one of the top Digital Marketing agencies in the country
We provide a myriad array of digital services to clients to help them
grow their business
NONE of those services is more important than properly setting up
ABOUT US
GETTING STARTED
Set up an account with Google.
Get your Tracking Code and install it
Set up Goals
Give access to whoever needs it
Sit back and watch the data come in
ANALYTICS BASICS
Sessions are visits to any page on your website. One user can have multiple sessions in any given time frame
Users are the number of people coming to your site
Pageviews let us know how many pages on your site were viewed during any given time frame
Pages/Session gives us the average number of pages viewed each time someone comes to our site
Avg. Session Duration provides us with the length of time people are staying on the site per visit
Bounce Rate is the percentage of visitors who leave without going to a second page
% New Sessions tells us how many sessions are new visits as opposed to recurring ones
GRANDMA’S ANALYTICS
Sometimes we need more than
Grandma’s Analytics.
Analytics can be as robust or as
simple as you’d like it to be.
DEEPER DIVE
● Demographics
○ Age, Gender, etc
● Interests
○ Affinity, In-Market Segments, etc
● Geo
○ Where are people coming from
● Behavior
○ How are people interacting with
my site
Technology
How is my site being seen by users
Mobile
What devices are people using
Custom
Allows you to customize variables
Benchmarking
Comparative analysis
AUDIENCE
Now that we know who is visiting you, we need to
know how we are getting them to visit your site
All Traffic
● Segment out the number of visits for each
channel
Top referring URLs
● Who is sending me traffic?
Connect to AdWords
● If you’re using AdWords it’s vital to link together
with Analytics
Campaigns
● Separate and track the ways you are actively
trying to drive visits to the site
ACQUISITION
It’s incredibly important to understand what people are doing on your site when they
get there. Your homepage isn’t important -- there are many ways to enter your site.
● Websites don’t read like books
● On average, about half or less of
a website’s traffic even sees the
home page
● Furthermore, the path with the
highest frequency is usually
followed up by a path with ~5%
of visitors. Making decisions
from such a small sample size is
challenging, if not outright
dangerous.
● We can look at the content of the
site and see what performs best
● We can look at Events we’ve set up,
like downloads of PDFs/Video Plays
● We can look at In-Page Analytics
data to help us understand how
users view the site while
interacting with it.
● Essentially, we’re trying to infer
intent
So what
CAN we do,
then?
BEHAVIOR
If you’re not tracking what is and isn’t working, don’t bother with anything else
from this presentation. If you can’t measure outcomes, don’t measure behavior.
Conversions tell us when consumers
have done what we want them to do on
our site.
● We set up Goals to track actions we
deem valuable to the business
● We assign values to those Goals to
measure ROI
● If you’re an eCommerce site,
measuring revenue performance is
essential
When you’re tracking conversions
properly, you can really put Google
Analytics to good use.
It allows you to ask the “What’s next?”
question.
CONVERSIONS
Now that you have all this data and understand what it means,
what do you do next?
Compare your data historically to
measure improvement
● Month over Month is the
most common
● Year over Year lets you see
historical progress
● If you have specific
campaigns like email blasts
that you are comparing with
one another, sometimes week
over week makes sense
WHAT NOW?
You can spend years working within analytics and probably still find something
new to explore. Here are a few things that can help you stay efficient:
● Alerts
● Filters
● User Management
● Custom Dashboards/Reports
● Helpful Tools
SOME HELPFUL EXTRAS
Sometimes you can’t be in front of your computer
at all times. Alerts can help you stay informed
about what’s going on with your site without
requiring constant monitoring.
ALERTS
If you don’t properly filter
your traffic, you will end
up with unreliable data.
Trying to make informed
decisions on unreliable
data won’t work well.
Some Common Filters Include
● Personal Usage Filters
○ Visiting your site often can cause
data to be skewed
● Company Wide Filters
● Specific IP Filters
● Spam Filters
FILTERS
Sometimes it’s helpful to have a third party set up and help maintain
analytics for you. Sometimes you just need to add someone else at your
company so that they can view the data as well.
There are two types of “Analytics Pro’s”
● Implementers
○ These are more technical people
○ They can do some coding work and
understand how Google Analytics works
● Analyzers
○ These people are more data-oriented
○ They can help you view the data that’s
important to you
USER MANAGEMENT
Keep track of the data that matters the most to you.
Dashboards put that data squarely in front of you so
that you don’t have to go hunting for it.
● Engagement metrics
● User Behavior
● Conversion data
● Campaign performance
Sometimes, it’s not enough to just have the data.
If you find yourself pressed for time or foregoing
your analytics data, setting up reports and
dashboards will help you stay efficient
CUSTOM REPORTING/DASHBOARDS
SOME HELPFUL TOOLS
https://www.iteratemarketing.com/blog/c-level-guide-google-analytics-dashboards
https://www.iteratemarketing.com/blog/how-to-tie-the-knot-between-analytics-and-adwords
https://www.iteratemarketing.com/blog/the-ultimate-guide-to-diagnosing-traffic-drops-in-
google-analytics
SHAMELESS PLUGS

Analytics 101 Presentation (1)

  • 1.
    ANALYTICS 101 Down therabbit hole we go Presented By Garret Archer
  • 2.
    ABOUT ME I’ve beenin the industry for about 3 years I have the coolest dog I somehow became a Minnesota Vikings fan being born and raised here in Oregon and with Packer fans as family I love spicy food No one can beat me at UNO, Foosball, and other useless games. I played soccer for 16 years I’m a huge nerd when it comes to fantasy fiction. And Fantasy football. Just Doing Dog Yoga
  • 3.
    We’ve been inbusiness for over 7 years Collectively, our management has over 20 years experience in digital marketing We provide service to a broad spectrum of clients spanning small/enterprise level, medium sized and global corporations We’re one of the top Digital Marketing agencies in the country We provide a myriad array of digital services to clients to help them grow their business NONE of those services is more important than properly setting up ABOUT US
  • 6.
    GETTING STARTED Set upan account with Google. Get your Tracking Code and install it Set up Goals Give access to whoever needs it Sit back and watch the data come in
  • 7.
  • 8.
    Sessions are visitsto any page on your website. One user can have multiple sessions in any given time frame Users are the number of people coming to your site Pageviews let us know how many pages on your site were viewed during any given time frame Pages/Session gives us the average number of pages viewed each time someone comes to our site Avg. Session Duration provides us with the length of time people are staying on the site per visit Bounce Rate is the percentage of visitors who leave without going to a second page % New Sessions tells us how many sessions are new visits as opposed to recurring ones GRANDMA’S ANALYTICS
  • 9.
    Sometimes we needmore than Grandma’s Analytics. Analytics can be as robust or as simple as you’d like it to be. DEEPER DIVE
  • 10.
    ● Demographics ○ Age,Gender, etc ● Interests ○ Affinity, In-Market Segments, etc ● Geo ○ Where are people coming from ● Behavior ○ How are people interacting with my site Technology How is my site being seen by users Mobile What devices are people using Custom Allows you to customize variables Benchmarking Comparative analysis AUDIENCE
  • 11.
    Now that weknow who is visiting you, we need to know how we are getting them to visit your site All Traffic ● Segment out the number of visits for each channel Top referring URLs ● Who is sending me traffic? Connect to AdWords ● If you’re using AdWords it’s vital to link together with Analytics Campaigns ● Separate and track the ways you are actively trying to drive visits to the site ACQUISITION
  • 12.
    It’s incredibly importantto understand what people are doing on your site when they get there. Your homepage isn’t important -- there are many ways to enter your site. ● Websites don’t read like books ● On average, about half or less of a website’s traffic even sees the home page ● Furthermore, the path with the highest frequency is usually followed up by a path with ~5% of visitors. Making decisions from such a small sample size is challenging, if not outright dangerous. ● We can look at the content of the site and see what performs best ● We can look at Events we’ve set up, like downloads of PDFs/Video Plays ● We can look at In-Page Analytics data to help us understand how users view the site while interacting with it. ● Essentially, we’re trying to infer intent So what CAN we do, then? BEHAVIOR
  • 13.
    If you’re nottracking what is and isn’t working, don’t bother with anything else from this presentation. If you can’t measure outcomes, don’t measure behavior. Conversions tell us when consumers have done what we want them to do on our site. ● We set up Goals to track actions we deem valuable to the business ● We assign values to those Goals to measure ROI ● If you’re an eCommerce site, measuring revenue performance is essential When you’re tracking conversions properly, you can really put Google Analytics to good use. It allows you to ask the “What’s next?” question. CONVERSIONS
  • 14.
    Now that youhave all this data and understand what it means, what do you do next? Compare your data historically to measure improvement ● Month over Month is the most common ● Year over Year lets you see historical progress ● If you have specific campaigns like email blasts that you are comparing with one another, sometimes week over week makes sense WHAT NOW?
  • 15.
    You can spendyears working within analytics and probably still find something new to explore. Here are a few things that can help you stay efficient: ● Alerts ● Filters ● User Management ● Custom Dashboards/Reports ● Helpful Tools SOME HELPFUL EXTRAS
  • 16.
    Sometimes you can’tbe in front of your computer at all times. Alerts can help you stay informed about what’s going on with your site without requiring constant monitoring. ALERTS
  • 17.
    If you don’tproperly filter your traffic, you will end up with unreliable data. Trying to make informed decisions on unreliable data won’t work well. Some Common Filters Include ● Personal Usage Filters ○ Visiting your site often can cause data to be skewed ● Company Wide Filters ● Specific IP Filters ● Spam Filters FILTERS
  • 18.
    Sometimes it’s helpfulto have a third party set up and help maintain analytics for you. Sometimes you just need to add someone else at your company so that they can view the data as well. There are two types of “Analytics Pro’s” ● Implementers ○ These are more technical people ○ They can do some coding work and understand how Google Analytics works ● Analyzers ○ These people are more data-oriented ○ They can help you view the data that’s important to you USER MANAGEMENT
  • 19.
    Keep track ofthe data that matters the most to you. Dashboards put that data squarely in front of you so that you don’t have to go hunting for it. ● Engagement metrics ● User Behavior ● Conversion data ● Campaign performance Sometimes, it’s not enough to just have the data. If you find yourself pressed for time or foregoing your analytics data, setting up reports and dashboards will help you stay efficient CUSTOM REPORTING/DASHBOARDS
  • 20.
  • 21.

Editor's Notes

  • #5 If you love analytics and use it every day, this probably isn’t the presentation for you. Bear with me because this will probably be a repetition of stuff you already know.
  • #11 1st, a lesson: GA is useless if it’s not actionable. Ask “why?” when you look at data. When you’ve answered “why” then ask yourself “what do we do about it?”
  • #14 Let’s first talk about goals of your website -- driving brand recognition, providing information, directing people to buy, funneling users to social media, etc.