Download as PDF, PPTX

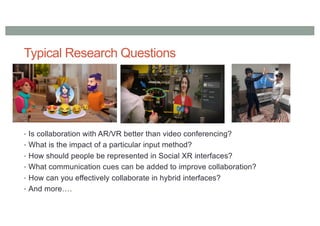
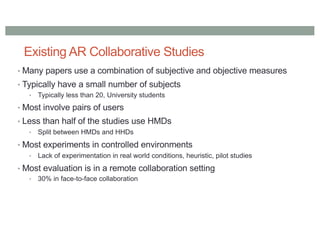
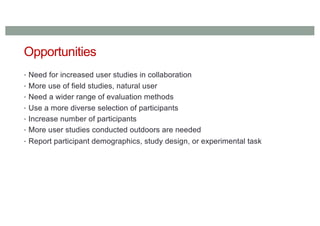
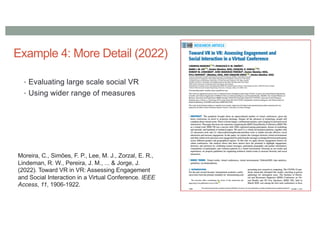


The document discusses evaluation methods for social XR experiences, highlighting key research questions and trends in collaboration within augmented reality (AR) and virtual reality (VR). It emphasizes the scarcity of user studies and a need for more robust evaluation methods, diverse participant demographics, and real-world experimentation. The findings also underline the importance of integrating physiological sensors and new analytical tools to enhance user experience and collaboration in XR environments.


