This document summarizes key considerations for evaluating collaborative filtering recommender systems. It discusses the user tasks being evaluated, types of analysis and datasets used, ways to measure prediction quality and other attributes, and how to evaluate the overall system from the user perspective. It presents empirical results showing that different accuracy metrics on one dataset collapsed into three groups that were either strongly or uncorrelated. The document aims to help researchers and practitioners properly evaluate and compare recommender system algorithms.
![Evaluating Collaborative Filtering
Recommender Systems
JONATHAN L. HERLOCKER
Oregon State University
and
JOSEPH A. KONSTAN, LOREN G. TERVEEN, and JOHN T. RIEDL
University of Minnesota
Recommender systems have been evaluated in many, often incomparable, ways. In this article,
we review the key decisions in evaluating collaborative filtering recommender systems: the user
tasks being evaluated, the types of analysis and datasets being used, the ways in which prediction
quality is measured, the evaluation of prediction attributes other than quality, and the user-based
evaluation of the system as a whole. In addition to reviewing the evaluation strategies used by prior
researchers, we present empirical results from the analysis of various accuracy metrics on one con-
tent domain where all the tested metrics collapsed roughly into three equivalence classes. Metrics
within each equivalency class were strongly correlated, while metrics from different equivalency
classes were uncorrelated.
Categories and Subject Descriptors: H.3.4 [Information Storage and Retrieval]: Systems and
Software—performance Evaluation (efficiency and effectiveness)
General Terms: Experimentation, Measurement, Performance
Additional Key Words and Phrases: Collaborative filtering, recommender systems, metrics,
evaluation
1. INTRODUCTION
Recommender systems use the opinions of a community of users to help indi-
viduals in that community more effectively identify content of interest from
a potentially overwhelming set of choices [Resnick and Varian 1997]. One of
This research was supported by the National Science Foundation (NSF) under grants DGE 95-
54517, IIS 96-13960, IIS 97-34442, IIS 99-78717, IIS 01-02229, and IIS 01-33994, and by Net
Perceptions, Inc.
Authors’ addresses: J. L. Herlocker, School of Electrical Engineering and Computer Science,
Oregon State University, 102 Dearborn Hall, Corvallis, OR 97331; email: herlock@cs.orst.edu; J. A.
Konstan, L. G. Terveen, and J. T. Riedl, Department of Computer Science and Engineering, Uni-
versity of Minnesota, 4-192 EE/CS Building, 200 Union Street SE, Minneapolis, MN 55455; email:
{konstan, terveen, riedl}@cs.umn.edu.
Permission to make digital or hard copies of part or all of this work for personal or classroom use is
granted without fee provided that copies are not made or distributed for profit or direct commercial
advantage and that copies show this notice on the first page or initial screen of a display along
with the full citation. Copyrights for components of this work owned by others than ACM must be
honored. Abstracting with credit is permitted. To copy otherwise, to republish, to post on servers,
to redistribute to lists, or to use any component of this work in other works requires prior specific
permission and/or a fee. Permissions may be requested from Publications Dept., ACM, Inc., 1515
Broadway, New York, NY 10036 USA, fax: +1 (212) 869-0481, or permissions@acm.org.
C 2004 ACM 1046-8188/04/0100-0005 $5.00
ACM Transactions on Information Systems, Vol. 22, No. 1, January 2004, Pages 5–53.](https://image.slidesharecdn.com/evaluatingcollaborativefilteringrecommendersystems-2004r-091212144717-phpapp02/75/Evaluating-Collaborative-Filtering-Recommender-Systems-1-2048.jpg)
![6 • J. L. Herlocker et al.
the most successful technologies for recommender systems, called collabora-
tive filtering, has been developed and improved over the past decade to the
point where a wide variety of algorithms exist for generating recommenda-
tions. Each algorithmic approach has adherents who claim it to be superior for
some purpose. Clearly identifying the best algorithm for a given purpose has
proven challenging, in part because researchers disagree on which attributes
should be measured, and on which metrics should be used for each attribute. Re-
searchers who survey the literature will find over a dozen quantitative metrics
and additional qualitative evaluation techniques.
Evaluating recommender systems and their algorithms is inherently diffi-
cult for several reasons. First, different algorithms may be better or worse on
different data sets. Many collaborative filtering algorithms have been designed
specifically for data sets where there are many more users than items (e.g., the
MovieLens data set has 65,000 users and 5,000 movies). Such algorithms may
be entirely inappropriate in a domain where there are many more items than
users (e.g., a research paper recommender with thousands of users but tens or
hundreds of thousands of articles to recommend). Similar differences exist for
ratings density, ratings scale, and other properties of data sets.
The second reason that evaluation is difficult is that the goals for which
an evaluation is performed may differ. Much early evaluation work focused
specifically on the “accuracy” of collaborative filtering algorithms in “predict-
ing” withheld ratings. Even early researchers recognized, however, that when
recommenders are used to support decisions, it can be more valuable to measure
how often the system leads its users to wrong choices. Shardanand and Maes
[1995] measured “reversals”—large errors between the predicted and actual
rating; we have used the signal-processing measure of the Receiver Operating
Characteristic curve [Swets 1963] to measure a recommender’s potential as a
filter [Konstan et al. 1997]. Other work has speculated that there are properties
different from accuracy that have a larger effect on user satisfaction and perfor-
mance. A range of research and systems have looked at measures including the
degree to which the recommendations cover the entire set of items [Mobasher
et al. 2001], the degree to which recommendations made are nonobvious [McNee
et al. 2002], and the ability of recommenders to explain their recommendations
to users [Sinha and Swearingen 2002]. A few researchers have argued that
these issues are all details, and that the bottom-line measure of recommender
system success should be user satisfaction. Commercial systems measure user
satisfaction by the number of products purchased (and not returned!), while
noncommercial systems may just ask users how satisfied they are.
Finally, there is a significant challenge in deciding what combination of mea-
sures to use in comparative evaluation. We have noticed a trend recently—many
researchers find that their newest algorithms yield a mean absolute error of
0.73 (on a five-point rating scale) on movie rating datasets. Though the new al-
gorithms often appear to do better than the older algorithms they are compared
to, we find that when each algorithm is tuned to its optimum, they all produce
similar measures of quality. We—and others—have speculated that we may be
reaching some “magic barrier” where natural variability may prevent us from
getting much more accurate. In support of this, Hill et al. [1995] have shown
ACM Transactions on Information Systems, Vol. 22, No. 1, January 2004.](https://image.slidesharecdn.com/evaluatingcollaborativefilteringrecommendersystems-2004r-091212144717-phpapp02/75/Evaluating-Collaborative-Filtering-Recommender-Systems-2-2048.jpg)
![Evaluating Collaborative Filtering Recommender Systems • 7
that users provide inconsistent ratings when asked to rate the same movie at
different times. They suggest that an algorithm cannot be more accurate than
the variance in a user’s ratings for the same item.
Even when accuracy differences are measurable, they are usually tiny. On a
five-point rating scale, are users sensitive to a change in mean absolute error
of 0.01? These observations suggest that algorithmic improvements in collabo-
rative filtering systems may come from different directions than just continued
improvements in mean absolute error. Perhaps the best algorithms should be
measured in accordance with how well they can communicate their reasoning
to users, or with how little data they can yield accurate recommendations. If
this is true, new metrics will be needed to evaluate these new algorithms.
This article presents six specific contributions towards evaluation of recom-
mender systems.
(1) We introduce a set of recommender tasks that categorize the user goals for
a particular recommender system.
(2) We discuss the selection of appropriate datasets for evaluation. We explore
when evaluation can be completed off-line using existing datasets and when
it requires on-line experimentation. We briefly discuss synthetic data sets
and more extensively review the properties of datasets that should be con-
sidered in selecting them for evaluation.
(3) We survey evaluation metrics that have been used to evaluation recom-
mender systems in the past, conceptually analyzing their strengths and
weaknesses.
(4) We report on experimental results comparing the outcomes of a set of differ-
ent accuracy evaluation metrics on one data set. We show that the metrics
collapse roughly into three equivalence classes.
(5) By evaluating a wide set of metrics on a dataset, we show that for some
datasets, while many different metrics are strongly correlated, there are
classes of metrics that are uncorrelated.
(6) We review a wide range of nonaccuracy metrics, including measures of the
degree to which recommendations cover the set of items, the novelty and
serendipity of recommendations, and user satisfaction and behavior in the
recommender system.
Throughout our discussion, we separate out our review of what has been
done before in the literature from the introduction of new tasks and methods.
We expect that the primary audience of this article will be collaborative fil-
tering researchers who are looking to evaluate new algorithms against previous
research and collaborative filtering practitioners who are evaluating algorithms
before deploying them in recommender systems.
There are certain aspects of recommender systems that we have specifically
left out of the scope of this paper. In particular, we have decided to avoid the large
area of marketing-inspired evaluation. There is extensive work on evaluating
marketing campaigns based on such measures as offer acceptance and sales
lift [Rogers 2001]. While recommenders are widely used in this area, we can-
not add much to existing coverage of this topic. We also do not address general
ACM Transactions on Information Systems, Vol. 22, No. 1, January 2004.](https://image.slidesharecdn.com/evaluatingcollaborativefilteringrecommendersystems-2004r-091212144717-phpapp02/75/Evaluating-Collaborative-Filtering-Recommender-Systems-3-2048.jpg)
![8 • J. L. Herlocker et al.
usability evaluation of the interfaces. That topic is well covered in the research
and practitioner literature (e.g., Helander [1988] and Nielsen [1994]) We have
chosen not to discuss computation performance of recommender algorithms.
Such performance is certainly important, and in the future we expect there to
be work on the quality of time-limited and memory-limited recommendations.
This area is just emerging, however (see for example Miller et al.’s recent work
on recommendation on handheld devices [Miller et al. 2003]), and there is not
yet enough research to survey and synthesize. Finally, we do not address the
emerging question of the robustness and transparency of recommender algo-
rithms. We recognize that recommender system robustness to manipulation by
attacks (and transparency that discloses manipulation by system operators) is
important, but substantially more work needs to occur in this area before there
will be accepted metrics for evaluating such robustness and transparency.
The remainder of the article is arranged as follows:
— Section 2. We identify the key user tasks from which evaluation methods
have been determined and suggest new tasks that have not been evaluated
extensively.
— Section 3. A discussion regarding the factors that can affect selection of a
data set on which to perform evaluation.
— Section 4. An investigation of metrics that have been used in evaluating the
accuracy of collaborative filtering predictions and recommendations. Accu-
racy has been by far the most commonly published evaluation method for
collaborative filtering systems. This section also includes the results from an
empirical study of the correlations between metrics.
— Section 5. A discussion of metrics that evaluate dimensions other than ac-
curacy. In addition to covering the dimensions and methods that have been
used in the literature, we introduce new dimensions on which we believe
evaluation should be done.
— Section 6. Final conclusions, including a list of areas were we feel future work
is particularly warranted.
Sections 2–5 are ordered to discuss the steps of evaluation in roughly the order
that we would expect an evaluator to take. Thus, Section 2 describes the selec-
tion of appropriate user tasks, Section 3 discusses the selection of a dataset,
and Sections 4 and 5 discuss the alternative metrics that may be applied to the
dataset chosen. We begin with the discussion of user tasks—the user task sets
the entire context for evaluation.
2. USER TASKS FOR RECOMMENDER SYSTEMS
To properly evaluate a recommender system, it is important to understand the
goals and tasks for which it is being used. In this article, we focus on end-user
goals and tasks (as opposed to goals of marketers and other system stakehold-
ers). We derive these tasks from the research literature and from deployed sys-
tems. For each task, we discuss its implications for evaluation. While the tasks
we’ve identified are important ones, based on our experience in recommender
systems research and from our review of published research, we recognize that
ACM Transactions on Information Systems, Vol. 22, No. 1, January 2004.](https://image.slidesharecdn.com/evaluatingcollaborativefilteringrecommendersystems-2004r-091212144717-phpapp02/75/Evaluating-Collaborative-Filtering-Recommender-Systems-4-2048.jpg)
![Evaluating Collaborative Filtering Recommender Systems • 9
the list is necessarily incomplete. As researchers and developers move into new
recommendation domains, we expect they will find it useful to supplement this
list and/or modify these tasks with domain-specific ones. Our goal is primarily
to identify domain-independent task descriptions to help distinguish among
different evaluation measures.
We have identified two user tasks that have been discussed at length within
the collaborative filtering literature:
Annotation in Context. The original recommendation scenario was filtering
through structured discussion postings to decide which ones were worth read-
ing. Tapestry [Goldberg et al. 1992] and GroupLens [Resnick et al. 1994] both
applied this to already structured message databases. This task required re-
taining the order and context of messages, and accordingly used predictions to
annotate messages in context. In some cases the “worst” messages were filtered
out. This same scenario, which uses a recommender in an existing context, has
also been used by web recommenders that overlay prediction information on
top of existing links [Wexelblat and Maes 1999]. Users use the displayed predic-
tions to decide which messages to read (or which links to follow), and therefore
the most important factor to evaluate is how successfully the predictions help
users distinguish between desired and undesired content. A major factor is the
whether the recommender can generate predictions for the items that the user
is viewing.
Find Good Items. Soon after Tapestry and GroupLens, several systems
were developed with a more direct focus on actual recommendation. Ringo
[Shardanand and Maes 1995] and the Bellcore Video Recommender [Hill et al.
1995] both provided interfaces that would suggest specific items to their users,
providing users with a ranked list of the recommended items, along with predic-
tions for how much the users would like them. This is the core recommendation
task and it recurs in a wide variety of research and commercial systems. In
many commercial systems, the “best bet” recommendations are shown, but the
predicted rating values are not.
While these two tasks can be identified quite generally across many different
domains, there are likely to be many specializations of the above tasks within
each domain. We introduce some of the characteristics of domains that influence
those specializations in Section 3.3.
While the Annotation in Context and the Find Good Items are overwhelm-
ingly the most commonly evaluated tasks in the literature, there are other
important generic tasks that are not well described in the research literature.
Below we describe several other user tasks that we have encountered in our in-
terviews with users and our discussions with recommender system designers.
We mention these tasks because we believe that they should be evaluated, but
because they have not been addressed in the recommender systems literature,
we do not discuss them further.
Find All Good Items. Most recommender tasks focus on finding some good
items. This is not surprising; the problem that led to recommender systems
was one of overload, and most users seem willing to live with overlooking some
ACM Transactions on Information Systems, Vol. 22, No. 1, January 2004.](https://image.slidesharecdn.com/evaluatingcollaborativefilteringrecommendersystems-2004r-091212144717-phpapp02/75/Evaluating-Collaborative-Filtering-Recommender-Systems-5-2048.jpg)
![10 • J. L. Herlocker et al.
good items in order to screen out many bad ones. Our discussions with firms
in the legal databases industry, however, led in the opposite direction. Lawyers
searching for precedents feel it is very important not to overlook a single possible
case. Indeed, they are willing to invest large amounts of time (and their client’s
money) searching for that case. To use recommenders in their practice, they
first need to be assured that the false negative rate can be made sufficiently
low. As with annotation in context, coverage becomes particularly important in
this task.
Recommend Sequence. We first noticed this task when using the personal-
ized radio web site Launch (launch.yahoo.com) which streams music based on a
variety of recommender algorithms. Launch has several interesting factors, in-
cluding the desirability of recommending “already rated” items, though not too
often. What intrigued us, though, is the challenge of moving from recommend-
ing one song at a time to recommending a sequence that is pleasing as a whole.
This same task can apply to recommending research papers to learn about a
field (read this introduction, then that survey, . . . ). While data mining research
has explored product purchase timing and sequences, we are not aware of any
recommender applications or research that directly address this task.
Just Browsing. Recommenders are usually evaluated based on how well
they help the user make a consumption decision. In talking with users of our
MovieLens system, of Amazon.com, and of several other sites, we discovered
that many of them use the site even when they have no purchase imminent.
They find it pleasant to browse. Whether one models this activity as learning
or simply as entertainment, it seems that a substantial use of recommenders
is simply using them without an ulterior motive. For those cases, the accuracy
of algorithms may be less important than the interface, the ease of use, and the
level and nature of information provided.
Find Credible Recommender. This is another task gleaned from discussions
with users. It is not surprising that users do not automatically trust a recom-
mender. Many of them “play around” for a while to see if the recommender
matches their tastes well. We’ve heard many complaints from users who are
looking up their favorite (or least favorite) movies on MovieLens—they don’t
do this to learn about the movie, but to check up on us. Some users even go
further. Especially on commercial sites, they try changing their profiles to see
how the recommended items change. They explore the recommendations to try
to find any hints of bias. A recommender optimized to produce “useful” recom-
mendations (e.g., recommendations for items that the user does not already
know about) may fail to appear trustworthy because it does not recommend
movies the user is sure to enjoy but probably already knows about. We are not
aware of any research on how to make a recommender appear credible, though
there is more general research on making websites evoke trust [Bailey et al.
2001].
Most evaluations of recommender systems focus on the recommendations;
however if users don’t rate items, then collaborative filtering recommender sys-
tems can’t provide recommendations. Thus, evaluating if and why users would
ACM Transactions on Information Systems, Vol. 22, No. 1, January 2004.](https://image.slidesharecdn.com/evaluatingcollaborativefilteringrecommendersystems-2004r-091212144717-phpapp02/75/Evaluating-Collaborative-Filtering-Recommender-Systems-6-2048.jpg)
![12 • J. L. Herlocker et al.
identified. Evaluators should consider carefully which of the tasks described
may be appropriate for their environment.
Once the proper tasks have been identified, the evaluator must select a
dataset to which evaluation methods can be applied, a process that will most
likely be constrained by the user tasks identified.
3. SELECTING DATA SETS FOR EVALUATION
Several key decisions regarding data sets underlie successful evaluation of a
recommender system algorithm. Can the evaluation be carried out offline on an
existing data set or does it require live user tests? If a data set is not currently
available, can evaluation be performed on simulated data? What properties
should the dataset have in order to best model the tasks for which the recom-
mender is being evaluated? A few examples help clarify these decisions:
— When designing a recommender algorithm designed to recommend word pro-
cessing commands (e.g., Linton et al. [1998]), one can expect users to have ex-
perienced 5–10% (or more) of the candidates. Accordingly, it would be unwise
to select recommender algorithms based on evaluation results from movie or
e-commerce datasets where ratings sparsity is much worse.
— When evaluating a recommender algorithm in the context of the Find Good
Items task where novel items are desired, it may be inappropriate to use
only offline evaluation. Since the recommender algorithm is generating rec-
ommendations for items that the user does not already know about, it is
probable that the data set will not provide enough information to evaluate
the quality of the items being recommended. If an item was truly unknown
to the user, then it is probable that there is no rating for that user in the
database. If we perform a live user evaluation, ratings can be gained on the
spot for each item recommended.
— When evaluating a recommender in a new domain where there is significant
research on the structure of user preferences, but no data sets, it may be ap-
propriate to first evaluate algorithms against synthetic data sets to identify
the promising ones for further study.
We will examine in the following subsections each of the decisions that we
posed in the first paragraph of this section, and then discuss the past and
current trends in research with respect to collaborative filtering data sets.
3.1 Live User Experiments vs. Offline Analyses
Evaluations can be completed using offline analysis, a variety of live user exper-
imental methods, or a combination of the two. Much of the work in algorithm
evaluation has focused on off-line analysis of predictive accuracy. In such an
evaluation, the algorithm is used to predict certain withheld values from a
dataset, and the results are analyzed using one or more of the metrics dis-
cussed in the following section. Such evaluations have the advantage that it is
quick and economical to conduct large evaluations, often on several different
datasets or algorithms at once. Once a dataset is available, conducting such an
experiment simply requires running the algorithm on the appropriate subset of
ACM Transactions on Information Systems, Vol. 22, No. 1, January 2004.](https://image.slidesharecdn.com/evaluatingcollaborativefilteringrecommendersystems-2004r-091212144717-phpapp02/75/Evaluating-Collaborative-Filtering-Recommender-Systems-8-2048.jpg)
![Evaluating Collaborative Filtering Recommender Systems • 13
that data. When the dataset includes timestamps, it is even possible to “replay”
a series of ratings and recommendations offline. Each time a rating was made,
the researcher first computes the prediction for that item based on all prior
data; then, after evaluating the accuracy of that prediction, the actual rating
is entered so the next item can be evaluated.
Offline analyses have two important weaknesses. First, the natural sparsity
of ratings data sets limits the set of items that can be evaluated. We cannot
evaluate the appropriateness of a recommended item for a user if we do not
have a rating from that user for that item in the dataset. Second, they are
limited to objective evaluation of prediction results. No offline analysis can
determine whether users will prefer a particular system, either because of its
predictions or because of other less objective criteria such as the aesthetics of
the user interface.
An alternative approach is to conduct a live user experiment. Such experi-
ments may be controlled (e.g., with random assignment of subjects to different
conditions), or they may be field studies where a particular system is made
available to a community of users that is then observed to ascertain the effects
of the system. As we discuss later in Section 5.5, live user experiments can
evaluate user performance, satisfaction, participation, and other measures.
3.2 Synthesized vs. Natural Data Sets
Another choice that researchers face is whether to use an existing dataset
that may imperfectly match the properties of the target domain and task, or
to instead synthesize a dataset specifically to match those properties. In our
own early work designing recommender algorithms for Usenet News [Konstan
et al. 1997; Miller et al. 1997], we experimented with a variety of synthesized
datasets. We modeled news articles as having a fixed number of “properties”
and users as having preferences for those properties. Our data set genera-
tor could cluster users together, spread them evenly, or present other distri-
butions. While these simulated data sets gave us an easy way to test algo-
rithms for obvious flaws, they in no way accurately modeled the nature of real
users and real data. In their research on horting as an approach for collabora-
tive filtering, Aggarwal et al. [1999] used a similar technique, noting however
that such synthetic data is “unfair to other algorithms” because it fits their
approach too well, and that this is a placeholder until they can deploy their
trial.
Synthesized data sets may be required in some limited cases, but only as early
steps while gathering data sets or constructing complete systems. Drawing
comparative conclusions from synthetic datasets is risky, because the data may
fit one of the algorithms better than the others.
On the other hand, there is new opportunity now to explore more advanced
techniques for modeling user interest and generating synthetic data from those
models, now that there exists data on which to evaluate the synthetically gen-
erated data and tune the models. Such research could also lead to the develop-
ment of more accurate recommender algorithms with clearly defined theoretical
properties.
ACM Transactions on Information Systems, Vol. 22, No. 1, January 2004.](https://image.slidesharecdn.com/evaluatingcollaborativefilteringrecommendersystems-2004r-091212144717-phpapp02/75/Evaluating-Collaborative-Filtering-Recommender-Systems-9-2048.jpg)
![14 • J. L. Herlocker et al.
3.3 Properties of Data Sets
The final question we address in this section on data sets is “what properties
should the dataset have in order to best model the tasks for which the rec-
ommender is being evaluated?” We find it useful to divide data set properties
into three categories: Domain features reflect the nature of the content being
recommended, rather than any particular system. Inherent features reflect the
nature of the specific recommender system from which data was drawn (and
possibly from its data collection practices). Sample features reflect distribution
properties of the data, and often can be manipulated by selecting the appropri-
ate subset of a larger data set. We discuss each of these three categories here,
identifying specific features within each category.
Domain Features of interest include
(a) the content topic being recommended/rated and the associated context in
which rating/recommendation takes place;
(b) the user tasks supported by the recommender;
(c) the novelty need and the quality need;
(d) the cost/benefit ratio of false/true positives/negatives;
(e) the granularity of true user preferences.
Most commonly, recommender systems have been built for entertainment
content domains (movies, music, etc.), though some testbeds exist for filtering
document collections (Usenet news, for example). Within a particular topic,
there may be many contexts. Movie recommenders may operate on the web, or
may operate entirely within a video rental store or as part of a set-top box or
digital video recorder.
In our experience, one of the most important generic domain features to con-
sider lies in the tradeoff between desire for novelty and desire for high quality.
In certain domains, the user goal is dominated by finding recommendations for
things she doesn’t already know about. McNee et al. [2002] evaluated recom-
menders for research papers and found that users were generally happy with
a set of recommendations if there was a single item in the set that appeared
to be useful and that the user wasn’t already familiar with. In some ways, this
matches the conventional wisdom about supermarket recommenders—it would
be almost always correct, but useless, to recommend bananas, bread, milk, and
eggs. The recommendations might be correct, but they don’t change the shop-
per’s behavior. Opposite the desire for novelty is the desire for high quality. In-
tuitively, this end of the tradeoff reflects the user’s desire to rely heavily upon
the recommendation for a consumption decision, rather than simply as one
decision-support factor among many. At the extreme, the availability of high-
confidence recommendations could enable automatic purchase decisions such as
personalized book- or music-of-the-month clubs. Evaluations of recommenders
for this task must evaluate the success of high-confidence recommendations,
and perhaps consider the opportunity costs of excessively low confidence.
Another important domain feature is the cost/benefit ratio faced by users
in the domain from which items are being recommended. In the video recom-
mender domain, the cost of false positives is low ($3 and two to three hours of
ACM Transactions on Information Systems, Vol. 22, No. 1, January 2004.](https://image.slidesharecdn.com/evaluatingcollaborativefilteringrecommendersystems-2004r-091212144717-phpapp02/75/Evaluating-Collaborative-Filtering-Recommender-Systems-10-2048.jpg)
![Evaluating Collaborative Filtering Recommender Systems • 15
your evening), the cost of false negatives is almost zero, and the benefit of recom-
mendations is huge (an enormous quantity of movies have been released over
the years, and browsing in the video store can be quite stressful—particularly
for families). This analysis explains to a large extent why video recommenders
have been so successful. Other domains with similar domain features, such as
books of fiction, are likely to have datasets similar to the video domain and re-
sults demonstrated on video data may likely translate somewhat well to those
other domains (although books of fiction are likely to have different sample
features—see below). See Konstan et al. [1997] for a slightly more detailed dis-
cussion of cost/benefit tradeoff analysis in collaborative filtering recommender
systems.
Another subtle but important domain feature is the granularity of true user
preferences. How many different levels of true user preference exist? With bi-
nary preferences, users only care to distinguish between good and bad items
(“I don’t necessarily need the best movie, only a movie I will enjoy”). In such a
case, distinguishing among good items is not important, nor is distinguishing
among bad items. Note that the granularity of user preference may be different
than the range and granularity of the ratings (which is an inherent feature of
data sets). Users may rank movies on a 1–10 scale, but then only really care if
recommendations are good (I had a good time watching the movie) or bad (I was
bored out of my mind!).
Overall, it would probably be a mistake to evaluate an algorithm on data
with significantly different domain features. In particular, it is very important
that the tasks your algorithm is designed to support are similar to the tasks
supported by the system from which the data was collected. If the user tasks
are mismatched, then there are likely to be many other feature mismatches.
For example, the MovieLens system supported primarily the Find Good Items
user task. As the result, the user was always shown the “best bets” and thus
there are many more ratings for good items than bad items (the user had to
explicitly request to rate a poor item in most cases). So MovieLens data is
less likely to have many ratings for less popular items. It would probably be
inappropriate to use this data to evaluate a new algorithm whose goal was to
support Annotation In Context. Of course, if an algorithm is being proposed
for general use, it is best to select data sets that span a variety of topics and
contexts.
Inherent features include several features about ratings:
(a) whether ratings are explicit, implicit, or both;
(b) the scale on which items are rated;
(c) the dimensions of rating; and
(d) the presence or absence of a timestamp on ratings.
Explicit ratings are entered by a user directly (i.e., “Please rate this on a
scale of 1–5”), while implicit ratings are inferred from other user behavior. For
example, a music recommender may use implicit data such as play lists or
music listened to, or it may use explicit scores for songs or artists, or a combi-
nation of both. The ratings scale is the range and granularity of ratings. The
ACM Transactions on Information Systems, Vol. 22, No. 1, January 2004.](https://image.slidesharecdn.com/evaluatingcollaborativefilteringrecommendersystems-2004r-091212144717-phpapp02/75/Evaluating-Collaborative-Filtering-Recommender-Systems-11-2048.jpg)
![16 • J. L. Herlocker et al.
simplest scale is unary-liked items are marked, all others are unknown. Unary
is common in commerce applications, where all that is known is whether the
user purchased an item or not. We call the data unary instead of binary because
a lack of purchase of item X does not necessarily mean that the user would not
like X. Binary items include a separate designation for disliked. Systems that
operate on explicit ratings often support 5-point, 7-point, or 100-point scales.
While most recommenders have had only a single rating dimension (described
by Miller et al. [1997] as “what predictions should we have displayed for this
item?”), both research and commercial systems are exploring systems where
users can enter several ratings for a single item. Zagat’s restaurant guides, for
example, traditionally use food, service, and d´ cor as three independent dimen-
e
sions. Movie recommenders may separate story, acting, and special effects. Data
sets with multiple dimensions are still difficult to find, but we expect several
to become available in the future. Timestamps are a property of the data col-
lection, and are particularly important in areas where user tastes are expected
to change or where user reactions to items likely depend on their history of
interaction with other items.
Other inherent features concern the data collection practices:
(e) whether the recommendations displayed to the user were recorded; and
(f) the availability of user demographic information or item content
information.
Unfortunately, few datasets recorded the recommendations that were dis-
played, making it difficult to retrospectively isolate, for example, ratings that
could not have been biased by previously displayed predictions. Some logs may
keep time-stamped queries, which could be used to reconstruct recommenda-
tions if the algorithm is known and fully deterministic. The availability of demo-
graphic data varies with the specific system, and with the specific data collected.
The EachMovie and MovieLens datasets both collected limited demographics.
Researchers speculate, however, that a large percentage of the demographic
answers may be false (based on user suspicion of “marketing questions”). We
would expect greater reliability for demographic data that users believe actually
serves a constructive purpose in the recommender (either for recommendation
or for related purposes). A film recommender that uses zip code to narrow the
theater search, such as Miller et al.’s [2003] MovieLens Unplugged, seems more
likely to provide meaningful data.
Finally, we consider:
(g) the biases involved in data collection.
Most data sets have biases based on the mechanism by which users have the
opportunity to rate items. For example, Jester [Goldberg et al. 2001] asked all
users to rate the same initial jokes, creating a set of dense ratings for those
jokes which would not otherwise occur. MovieLens has experimented with dif-
ferent methods to select items to have the first-time user rate before using the
recommender system [Rashid et al. 2002], and in the process demonstrated that
each method leads to a different bias in initial ratings.
ACM Transactions on Information Systems, Vol. 22, No. 1, January 2004.](https://image.slidesharecdn.com/evaluatingcollaborativefilteringrecommendersystems-2004r-091212144717-phpapp02/75/Evaluating-Collaborative-Filtering-Recommender-Systems-12-2048.jpg)
![Evaluating Collaborative Filtering Recommender Systems • 17
Sample features include many of the statistical properties that are commonly
considered in evaluating a data set:
(a) the density of the ratings set overall, sometimes measured as the average
percentage of items that have been rated per user; since many datasets have
uneven popularity distributions, density may be artificially manipulated by
including or excluding items;
(b) the number or density of ratings from the users for whom recommendations
are being made, which represents the experience of the user in the system at
the time of recommendation; ratings from users with significant experience
can be withheld to simulate the condition when they were new users; and
(c) the general size and distribution properties of the data set—some data sets
have more items than users, though most data sets have many more users
than items.
Each of these sample features can have substantial effect on the success
of different algorithms, and can reflect specific policies of the recommender.
Density (both individual and overall) reflects both the overall size of the recom-
mender’s item space and the degree to which users have explored it. One policy
decision that significantly affects density is the level of rating required to par-
ticipate in the community. Systems that either require an extensive level of
start-up rating or require recurring ratings to maintain membership or status
levels will generally have greater density than low-commitment recommenders
in the same domain. Density also interacts with the type of rating—implicit rat-
ings are likely to lead to greater density, since less effort is needed by the user.
Finally, system that allow automated software “agents” to participate may have
a significantly higher density than other systems, even if the underlying item
space is similar (see, e.g., Good et al. [1999]). Because software agents are not
limited in attention, they can rate much more extensively than humans.
Two particular distribution properties are known to be highly important.
The relationship between the numbers of users and numbers of items can de-
termine whether it is easier to build correlations among users or among items—
this choice can lead to different relative performance among algorithms. The
ratings distribution of items and users also may affect both algorithm and eval-
uation metric choice. Systems where there is an exponential popularity curve
(some items have exponentially more ratings than others) may be able to find
agreement among people or items in the dense subregion and use that agree-
ment to recommend in the sparse space. (Jester, mentioned above, does this
directly by creating a highly dense region of jokes rated by all users.) Systems
with a more even ratings distribution may be more challenged to cope with
sparsity unless they incorporate dimensionality reduction techniques.
To complete the discussion of domain features, inherent features, and sample
features, it is important to note that there are significant interactions between
these categories of features. For example, the type of task supported by a rec-
ommender system (a domain feature) will significantly affect the distribution of
ratings collected (a sample feature). However, each of these features represents
a dimension which may be useful in explaining differences in evaluation results.
ACM Transactions on Information Systems, Vol. 22, No. 1, January 2004.](https://image.slidesharecdn.com/evaluatingcollaborativefilteringrecommendersystems-2004r-091212144717-phpapp02/75/Evaluating-Collaborative-Filtering-Recommender-Systems-13-2048.jpg)
![18 • J. L. Herlocker et al.
Evaluation of a recommender algorithm on a data set with features that
conflict with the end goal of the recommender algorithm could still be useful.
By explicitly identifying the features that conflict, we can reason about whether
those conflicts will unreasonably bias the evaluation results.
3.4 Past and Current Trends in Datasets
The most widely used common dataset was the EachMovie Dataset (http://
research.compaq.com/SRC/eachmovie/). This extensive dataset has over
2.8 million ratings from over 70,000 users, and it includes information such
as timestamps and basic demographic data for some of the users. In addition
to seeding our MovieLens system (http://www.movielens.org), the EachMovie
Dataset was used in dozens of machine learning and algorithmic research
projects to study new and potentially better ways to predict user ratings.
Examples include Canny’s [2002] factor analysis algorithm, Domingos and
Richardson’s [2003] algorithm for computing network value, and Pennock et al’s
[2000] work on recommending through personality diagnosis algorithms.
Extracts (100,000 ratings and 1 million ratings) of the MovieLens dataset
have also been released for research use; these extracts have been used by
several researchers, including Schein et al. [2001] in their investigation of cold-
start recommendations, Sarwar et al. [2001] in their evaluation of item-based
algorithms, Reddy et al. [2002] in their community extraction research, and
Mui et al. [2001] in their work on “collaborative sanctioning.”
More recently, several researchers have been using the Jester dataset, which
was collected from the Jester joke recommendation website [Goldberg et al.
2001]. Statistically, the Jester dataset has different characteristics than the
MovieLens and Eachmovie data. First of all, there is a set of training items
(jokes) that are rated by every single user, providing complete data on that sub-
set of items. Second, in the Jester user interface, the user clicks on a unlabeled
scale bar to rate a joke, so the ratings are much less discrete and may suffer
from different kinds of biases since it is hard for the user to intentionally create
a ranking among their rated items.
The majority of publications related to collaborative filtering recommender
algorithms have used one of the three data sets described above. A few other
data sets have been used, but most of them are not publicly available for ver-
ification. The lack of variety in publicly available collaborative filtering data
sets (particularly with significant numbers of ratings) remains one of the most
significant challenges in the field. Most researchers do not have the resources
to build production-quality systems that are capable of collecting enough data
to validate research hypotheses, and thus are often forced to constrain their
research to hypotheses that can be explored using the few existing datasets.
With the maturation of collaborative filtering recommender technology, more
live systems have been built that incorporate recommender algorithms. As a re-
sult, we have recently seen an increased number of studies that have used live
systems. Herlocker’s explanation experiments [Herlocker et al. 2000] explored
the use of 23 different graphical displays to “explain” why each recommenda-
tion was given. Schafer’s MetaLens [Schafer et al. 2002] was built to incorporate
ACM Transactions on Information Systems, Vol. 22, No. 1, January 2004.](https://image.slidesharecdn.com/evaluatingcollaborativefilteringrecommendersystems-2004r-091212144717-phpapp02/75/Evaluating-Collaborative-Filtering-Recommender-Systems-14-2048.jpg)
![Evaluating Collaborative Filtering Recommender Systems • 19
MovieLens and other systems into a new interface; his evaluation focused en-
tirely on the interface and user experience. Other recent work has combined
different evaluations. Our work on “value of information” [Rashid et al. 2002]
leads users through different sign-up processes, and then evaluates both the
quality of resulting predictions and the subjective user experience.
In the near future, we expect to see a lot more results from live experiments,
as recommender algorithms make their way into more production systems. We
also hope that new datasets will be released with data from new domains, caus-
ing new explosions in collaborative filtering recommender algorithm research
similar to what happened with the release of the EachMovie data.
4. ACCURACY METRICS
Establishing the user tasks to be supported by a system, and selecting a data
set on which performance enables empirical experimentation—scientifically re-
peatable evaluations of recommender system utility. A majority of the published
empirical evaluations of recommender systems to date has focused on the eval-
uation of a recommender system’s accuracy. We assume that if a user could
examine all items available, they could place those items in a ordering of pref-
erence. An accuracy metric empirically measures how close a recommender
system’s predicted ranking of items for a user differs from the user’s true rank-
ing of preference. Accuracy measures may also measure how well a system can
predict an exact rating value for a specific item.
Researchers who want to quantitatively compare the accuracy of different
recommender systems must first select one or more metrics. In selecting a met-
ric, researchers face a range of questions. Will a given metric measure the effec-
tiveness of a system with respect to the user tasks for which it was designed?
Are results with the chosen metric comparable to other published research
work in the field? Are the assumptions that a metric is based on true? Will a
metric be sensitive enough to detect real differences that exist? How large a
difference does there have to be in the value of a metric for a statistically sig-
nificant difference to exist? Complete answers to these questions have not yet
been substantially addressed in the published literature.
The challenge of selecting an appropriate metric is compounded by the large
diversity of published metrics that have been used to quantitatively evaluate
the accuracy of recommender systems. This lack of standardization is damag-
ing to the progress of knowledge related to collaborative filtering recommender
systems. With no standardized metrics within the field, researchers have con-
tinued to introduce new metrics when they evaluate their systems. With a
large diversity of evaluation metrics in use, it becomes difficult to compare re-
sults from one publication to the results in another publication. As a result, it
becomes hard to integrate these diverse publications into a coherent body of
knowledge regarding the quality of recommender system algorithms.
To address these challenges, we examine in the advantages and disadvan-
tages of past metrics with respect to the user tasks and data set features that
have been introduced in Sections 2 and 3. We follow up the conceptual discus-
sion of advantages and disadvantages with empirical results comparing the
ACM Transactions on Information Systems, Vol. 22, No. 1, January 2004.](https://image.slidesharecdn.com/evaluatingcollaborativefilteringrecommendersystems-2004r-091212144717-phpapp02/75/Evaluating-Collaborative-Filtering-Recommender-Systems-15-2048.jpg)
![20 • J. L. Herlocker et al.
performance of different metrics when applied to results from one class of algo-
rithm in one domain. The empirical results demonstrate that some conceptual
differences among accuracy evaluation metrics can be more significant than
others.
4.1 Evaluation of Previously Used Metrics
Recommender system accuracy has been evaluated in the research literature
since 1994 [Resnick et al. 1994]. Many of the published evaluations of rec-
ommender systems used different metrics. We will examine some of the most
popular metrics used in those publications, identifying the strengths and the
weaknesses of the metrics. We broadly classify recommendation accuracy met-
rics into three classes: predictive accuracy metrics, classification accuracy met-
rics, and rank accuracy metrics.
4.1.1 Predictive Accuracy Metrics. Predictive accuracy metrics measure
how close the recommender system’s predicted ratings are to the true user
ratings. Predictive accuracy metrics are particularly important for evaluating
tasks in which the predicting rating will be displayed to the user such as An-
notation in Context. For example, the MovieLens movie recommender [Dahlen
et al. 1998] predicts the number of stars that a user will give each movie and
displays that prediction to the user. Predictive accuracy metrics will evaluate
how close MovieLens’ predictions are to the user’s true number of stars given
to each movie. Even if a recommender system was able to correctly rank a
user’s movie recommendations, the system could fail if the predicted ratings it
displays to the user are incorrect.1 Because the predicted rating values create
an ordering across the items, predictive accuracy can also be used to measure
the ability of a recommender system to rank items with respect to user prefer-
ence. On the other hand, evaluators who wish to measure predictive accuracy
are necessarily limited to a metric that computes the difference between the
predicted rating and true rating such as mean absolute error.
Mean Absolute Error and Related Metrics. Mean absolute error (often re-
ferred to as MAE) measures the average absolute deviation between a predicted
rating and the user’s true rating. Mean absolute error (Eq. (1)) has been used to
evaluate recommender systems in several cases [Breese et al. 1998, Herlocker
et al. 1999, Shardanand and Maes 1995].
N
| pi − ri |
|E| = i=1
(1)
N
Mean absolute error may be less appropriate for tasks such as Find Good Items
where a ranked result is returned to the user, who then only views items at the
top of the ranking. For these tasks, users may only care about errors in items
that are ranked high, or that should be ranked high. It may be unimportant
how accurate predictions are for items that the system correctly knows the user
will have no interest in. Mean absolute error may be less appropriate when the
1 Thisis a primary reason that many implementations of recommender systems in a commercial
setting only display a recommended-items list and do not display predicted values.
ACM Transactions on Information Systems, Vol. 22, No. 1, January 2004.](https://image.slidesharecdn.com/evaluatingcollaborativefilteringrecommendersystems-2004r-091212144717-phpapp02/75/Evaluating-Collaborative-Filtering-Recommender-Systems-16-2048.jpg)
![Evaluating Collaborative Filtering Recommender Systems • 21
granularity of true preference (a domain feature) is small, since errors will only
affect the task if they result in erroneously classifying a good item as a bad one
or vice versa; for example, if 3.5 stars is the cut-off between good and bad, then
a one-star error that predicts a 4 as 5 (or a 3 as 2) makes no difference to the
user.
Beyond measuring the accuracy of the predictions at every rank, there are
two other advantages to mean absolute error. First, the mechanics of the com-
putation are simple and easy to understand. Second, mean absolute error has
well studied statistical properties that provide for testing the significance of a
difference between the mean absolute errors of two systems.
Three measures related to mean absolute error are mean squared error, root
mean squared error, and normalized mean absolute error. The first two varia-
tions square the error before summing it. The result is more emphasis on large
errors. For example, an error of one point increases the sum of error by one, but
an error of two points increases the sum by four. The third related measure,
normalized mean absolute error [Goldberg et al. 2001], is mean absolute error
normalized with respect to the range of rating values, in theory allowing com-
parison between prediction runs on different datasets (although the utility of
this has not yet been investigated).
In addition to mean absolute error across all predicted ratings, Shardanand
and Maes [1995] measured separately mean absolute error over items to which
users gave extreme ratings. They partitioned their items into two groups, based
on user rating (a scale of 1 to 7). Items rated below three or greater than five were
considered extremes. The intuition was that users would be much more aware
of a recommender system’s performance on items that they felt strongly about.
From Shardanand and Maes’ results, the mean absolute error of the extremes
provides a different ranking of algorithms than the normal mean absolute error.
Measuring the mean absolute error of the extremes can be valuable. However,
unless users are concerned only with how their extremes are predicted, it should
not be used in isolation.
4.1.2 Classification Accuracy Metrics. Classification metrics measure the
frequency with which a recommender system makes correct or incorrect deci-
sions about whether an item is good. Classification metrics are thus appropriate
for tasks such as Find Good Items when users have true binary preferences.
When applied to nonsynthesized data in offline experiments, classification
accuracy metrics may be challenged by data sparsity. The problem occurs when
the collaborative filtering system being evaluated is generating a list of top
recommended items. When the quality of the list is evaluated, recommendations
may be encountered that have not been rated. How those items are treated in
the evaluation can lead to certain biases.
One approach to evaluation using sparse data sets is to ignore recommenda-
tions for items for which there are no ratings. The recommendation list is first
processed to remove all unrated items. The recommendation task has been al-
tered to “predict the top recommended items that have been rated.” In tasks
where the user only observes the top few recommendations, this could lead to
inaccurate evaluations of recommendation systems with respect to the user’s
ACM Transactions on Information Systems, Vol. 22, No. 1, January 2004.](https://image.slidesharecdn.com/evaluatingcollaborativefilteringrecommendersystems-2004r-091212144717-phpapp02/75/Evaluating-Collaborative-Filtering-Recommender-Systems-17-2048.jpg)
![22 • J. L. Herlocker et al.
Table I. Table Showing the Categorization of Items
in the Document Set with Respect to a Given
Information Need
Selected Not Selected Total
Relevant Nrs Nrn Nr
Irrelevant Nis Nin Ni
Total Ns Nn N
task. The problem is that the quality of the items that the user would actually
see may never be measured.
In an example of how this could be significant, consider the following situa-
tion that could occur when using the nearest neighbor algorithm described in
Herlocker et al. [2002]: when only one user in the dataset has rated an eclectic
item I, then the prediction for item I for all users will be equal to the rating
given by that user. If a user gave item I a perfect rating of 5, then the algorithm
will predict a perfect 5 for all other users. Thus, item I will immediately be
placed at the top of the recommendation list for all users, in spite of the lack of
confirming data. However, since no other user has rated this item, the recom-
mendation for item I will be ignored by the evaluation metric, which thus will
entirely miss the flaw in the algorithm.
Another approach to evaluation of sparse data sets is to assume default
ratings, often slightly negative, for recommended items that have not been
rated [Breese et al. 1998]. The downside of this approach is that the default
rating may be very different from the true rating (unobserved) for an item.
A third approach that we have seen in the literature is to compute how many
of the highly rated items are found in the recommendation list generated by
the recommender system. In essence, we are measuring how well the system
can identify items that the user was already aware of. This evaluation approach
may result in collaborative filtering algorithms that are biased towards obvious,
nonnovel recommendations or perhaps algorithms that are over fitted—fitting
the known data perfectly, but new data poorly. In Section 5 of this article, we
discuss metrics for evaluating novelty of recommendations.
Classification accuracy metrics do not attempt to directly measure the ability
of an algorithm to accurately predict ratings. Deviations from actual ratings
are tolerated, as long as they do not lead to classification errors. The particular
metrics that we discuss are Precision and Recall and related metrics and ROC.
We also briefly discuss some ad hoc metrics.
Precision and Recall and Related Measures
Precision and recall are the most popular metrics for evaluating informa-
tion retrieval systems. In 1968, Cleverdon proposed them as the key metrics
[Cleverdon and Kean 1968], and they have held ever since. For the evaluation
of recommender systems, they have been used by Billsus and Pazzani [1998],
Basu et al. [1998], and Sarwar et al. [2000a, 2000b].
Precision and recall are computed from a 2 × 2 table, such as the one shown
in Table I. The item set must be separated into two classes—relevant or not
relevant. That is, if the rating scale is not already binary, we need to transform
ACM Transactions on Information Systems, Vol. 22, No. 1, January 2004.](https://image.slidesharecdn.com/evaluatingcollaborativefilteringrecommendersystems-2004r-091212144717-phpapp02/75/Evaluating-Collaborative-Filtering-Recommender-Systems-18-2048.jpg)
![Evaluating Collaborative Filtering Recommender Systems • 23
it into a binary scale. For example, the MovieLens dataset [Dahlen et al. 1998]
has a rating scale of 1–5 and is commonly transformed into a binary scale by
converting every rating of 4 or 5 to “relevant” and all ratings of 1–3 to “not-
relevant.” For precision and recall, we also need to separate the item set into
the set that was returned to the user (selected/recommended), and the set that
was not. We assume that the user will consider all items that are retrieved.
Precision is defined as the ratio of relevant items selected to number of items
selected, shown in Eq. (2)
Nrs
P= . (2)
Ns
Precision represents the probability that a selected item is relevant. Recall,
shown in Eq. (3), is defined as the ratio of relevant items selected to total
number of relevant items available. Recall represents the probability that a
relevant item will be selected
Nrs
R= . (3)
Nr
Precision and recall depend on the separation of relevant and nonrelevant
items. The definition of “relevance” and the proper way to compute it has been a
significant source of argument within the field of information retrieval [Harter
1996]. Most information retrieval evaluation has focused on an objective ver-
sion of relevance, where relevance is defined with respect to a query, and is
independent of the user. Teams of experts can compare documents to queries
and determine which documents are relevant to which queries. However, objec-
tive relevance makes no sense in recommender systems. Recommender systems
recommend items based on the likelihood that they will meet a specific user’s
taste or interest. That user is the only person who can determine if an item
meets his taste requirements. Thus, relevance is more inherently subjective in
recommender systems than in traditional document retrieval.
In addition to user tastes being different, user rating scales may also be differ-
ent. One user may consider a rating of 3- on a 5-point scale to be relevant, while
another may consider it irrelevant. For this reason, much research using multi-
point scales (such as in Hill et al. [1995], Resnick et al. [1994], and Shardanand
and Maes [1995]) has focused on other metrics besides Precision/Recall. One
interesting approach that has been taken to identify the proper threshold is to
assume that a top percentile of items rated by a user are relevant [Basu et al.
1998].
Recall, in its purest sense, is almost always impractical to measure in a
recommender system. In the pure sense, measuring recall requires knowing
whether each item is relevant; for a movie recommender, this would involve
asking many users to view all 5000 movies to measure how successfully we rec-
ommend each one to each user. IR evaluations have been able to estimate recall
by pooling relevance ratings across many users, but this approach depends
on the assumption that all users agree on which items are relevant, which is
inconsistent with the purpose of recommender systems.
Several approximations to recall have been developed and used to evalu-
ate recommender systems. Sarwar et al. [2000a] evaluate their algorithms by
ACM Transactions on Information Systems, Vol. 22, No. 1, January 2004.](https://image.slidesharecdn.com/evaluatingcollaborativefilteringrecommendersystems-2004r-091212144717-phpapp02/75/Evaluating-Collaborative-Filtering-Recommender-Systems-19-2048.jpg)
![24 • J. L. Herlocker et al.
taking a dataset of user ratings which they divide into a training set and a test
set. They train the recommender algorithm on the training set, and then predict
the top N items that the user is likely to find valuable, where N is some fixed
value. They then compute recall as the percentage of known relevant items
from the test set that appear in the top N predicted items. Since the number
of items that each user rates is much smaller than the number of items in the
entire dataset (see the discussion on data sparsity at the beginning of this sec-
tion), the number of relevant items in the test set may be a small fraction of the
number of relevant items in the entire dataset. While this metric can be useful,
it has underlying biases that researchers must be aware of. In particular, the
value of this metric depends heavily on the percentage of relevant items that
each user has rated. If a user has rated only a small percentage of relevant
items, a recommender with high “true recall” may yield a low value for mea-
sured recall, since the recommender may have recommended unrated relevant
items. Accordingly, this metric should only be used in a comparative fashion on
the same dataset; it should not be interpreted as an absolute measure.
We have also seen precision measured in the same fashion [Sarwar et al.
2000a] with relevant items being selected from a small pool of rated items
and predicted items being selected from a much larger set of items. Simi-
larly, this approximation to precision suffers from the same biases as the recall
approximation.
Perhaps a more appropriate way to approximate precision and recall would
be to predict the top N items for which we have ratings. That is, we take a
user’s ratings, split them into a training set and a test set, train the algorithm
on the training set, then predict the top N items from that user’s test set. If we
assume that the distribution of relevant items and nonrelevant items within
the user’s test set is the same as the true distribution for the user across all
items, then the precision and recall will be much closer approximations of the
true precision and recall. This approach is taken in Basu et al. [1998].
In information retrieval, precision and recall can be linked to probabilities
that directly affect the user. If an algorithm has a measured precision of 70%,
then the user can expect that, on average, 7 out of every 10 documents returned
to the user will be relevant. Users can more intuitively comprehend the meaning
of a 10% difference in precision than they can a 0.5-point difference in mean
absolute error.
One of the primary challenges to using precision and recall to compare dif-
ferent algorithms is that precision and recall must be considered together to
evaluate completely the performance of an algorithm. It has been observed that
precision and recall are inversely related [Cleverdon and Kean 1968] and are
dependent on the length of the result list returned to the user. When more
items are returned, then the recall increases and precision decreases. There-
fore, if the information system doesn’t always return a fixed number of items,
we must provide a vector of precision/recall pairs to fully describe the perfor-
mance of the system. While such an analysis may provide a detailed picture of
the performance of a system, it makes comparison of systems complicated, te-
dious, and variable between different observers. Furthermore, researchers may
ACM Transactions on Information Systems, Vol. 22, No. 1, January 2004.](https://image.slidesharecdn.com/evaluatingcollaborativefilteringrecommendersystems-2004r-091212144717-phpapp02/75/Evaluating-Collaborative-Filtering-Recommender-Systems-20-2048.jpg)
![Evaluating Collaborative Filtering Recommender Systems • 25
carefully choose at which levels of recall (or search length) they report precision
and recall to match the strengths in their system.
Several approaches have been taken to combine precision and recall into a
single metric. One approach is the F1 metric (Eq. (4)), which combines precision
and recall into a single number The F1 has been used to evaluate recommender
systems in Sarwar et al. [2000a, 2000b]. An alternate approach taken by the
TREC community is to compute the average precision across several different
levels of recall or the average precision at the rank of each relevant document
[Harman 1995]. The latter approach was taken in all but the initial TREC
conference. This approach is commonly referred to as Mean Average Precision
or MAP. F1 and mean average precision may be appropriate if the underly-
ing precision and recall measures on which it is based are determined to be
appropriate
2PR
F1 = . (4)
P+R
Precision alone at a single search length or a single recall level can be ap-
propriate if the user does not need a complete list of all potentially relevant
items, such as in the Find Good Items task. If the task is to find all relevant
items in an area, then recall becomes important as well. However, the search
length at which precision is measured should be appropriate for the user task
and content domain.
As with all classification metrics, precision and recall are less appropriate
for domains with non-binary granularity of true preference. For those tasks, at
any point in the ranking, we want the current item to be more relevant than
all items lower in the ranking. Since precision and recall only measure binary
relevance, they cannot measure the quality of the ordering among items that
are selected as relevant.
ROC Curves, Swets’ A Measure, and Related Metrics
ROC curve-based metrics provide a theoretically grounded alternative to
precision and recall. There are two different popularly held definitions for the
acronym ROC. Swets [1963, 1969] introduced the ROC metric to the information
retrieval community under the name “relative operating characteristic.” More
popular however, is the name “receiver operating characteristic,” which evolved
from the use of ROC curves in signal detection theory [Hanley and McNeil 1982].
Regardless, in both cases, ROC refers to the same underlying metric.
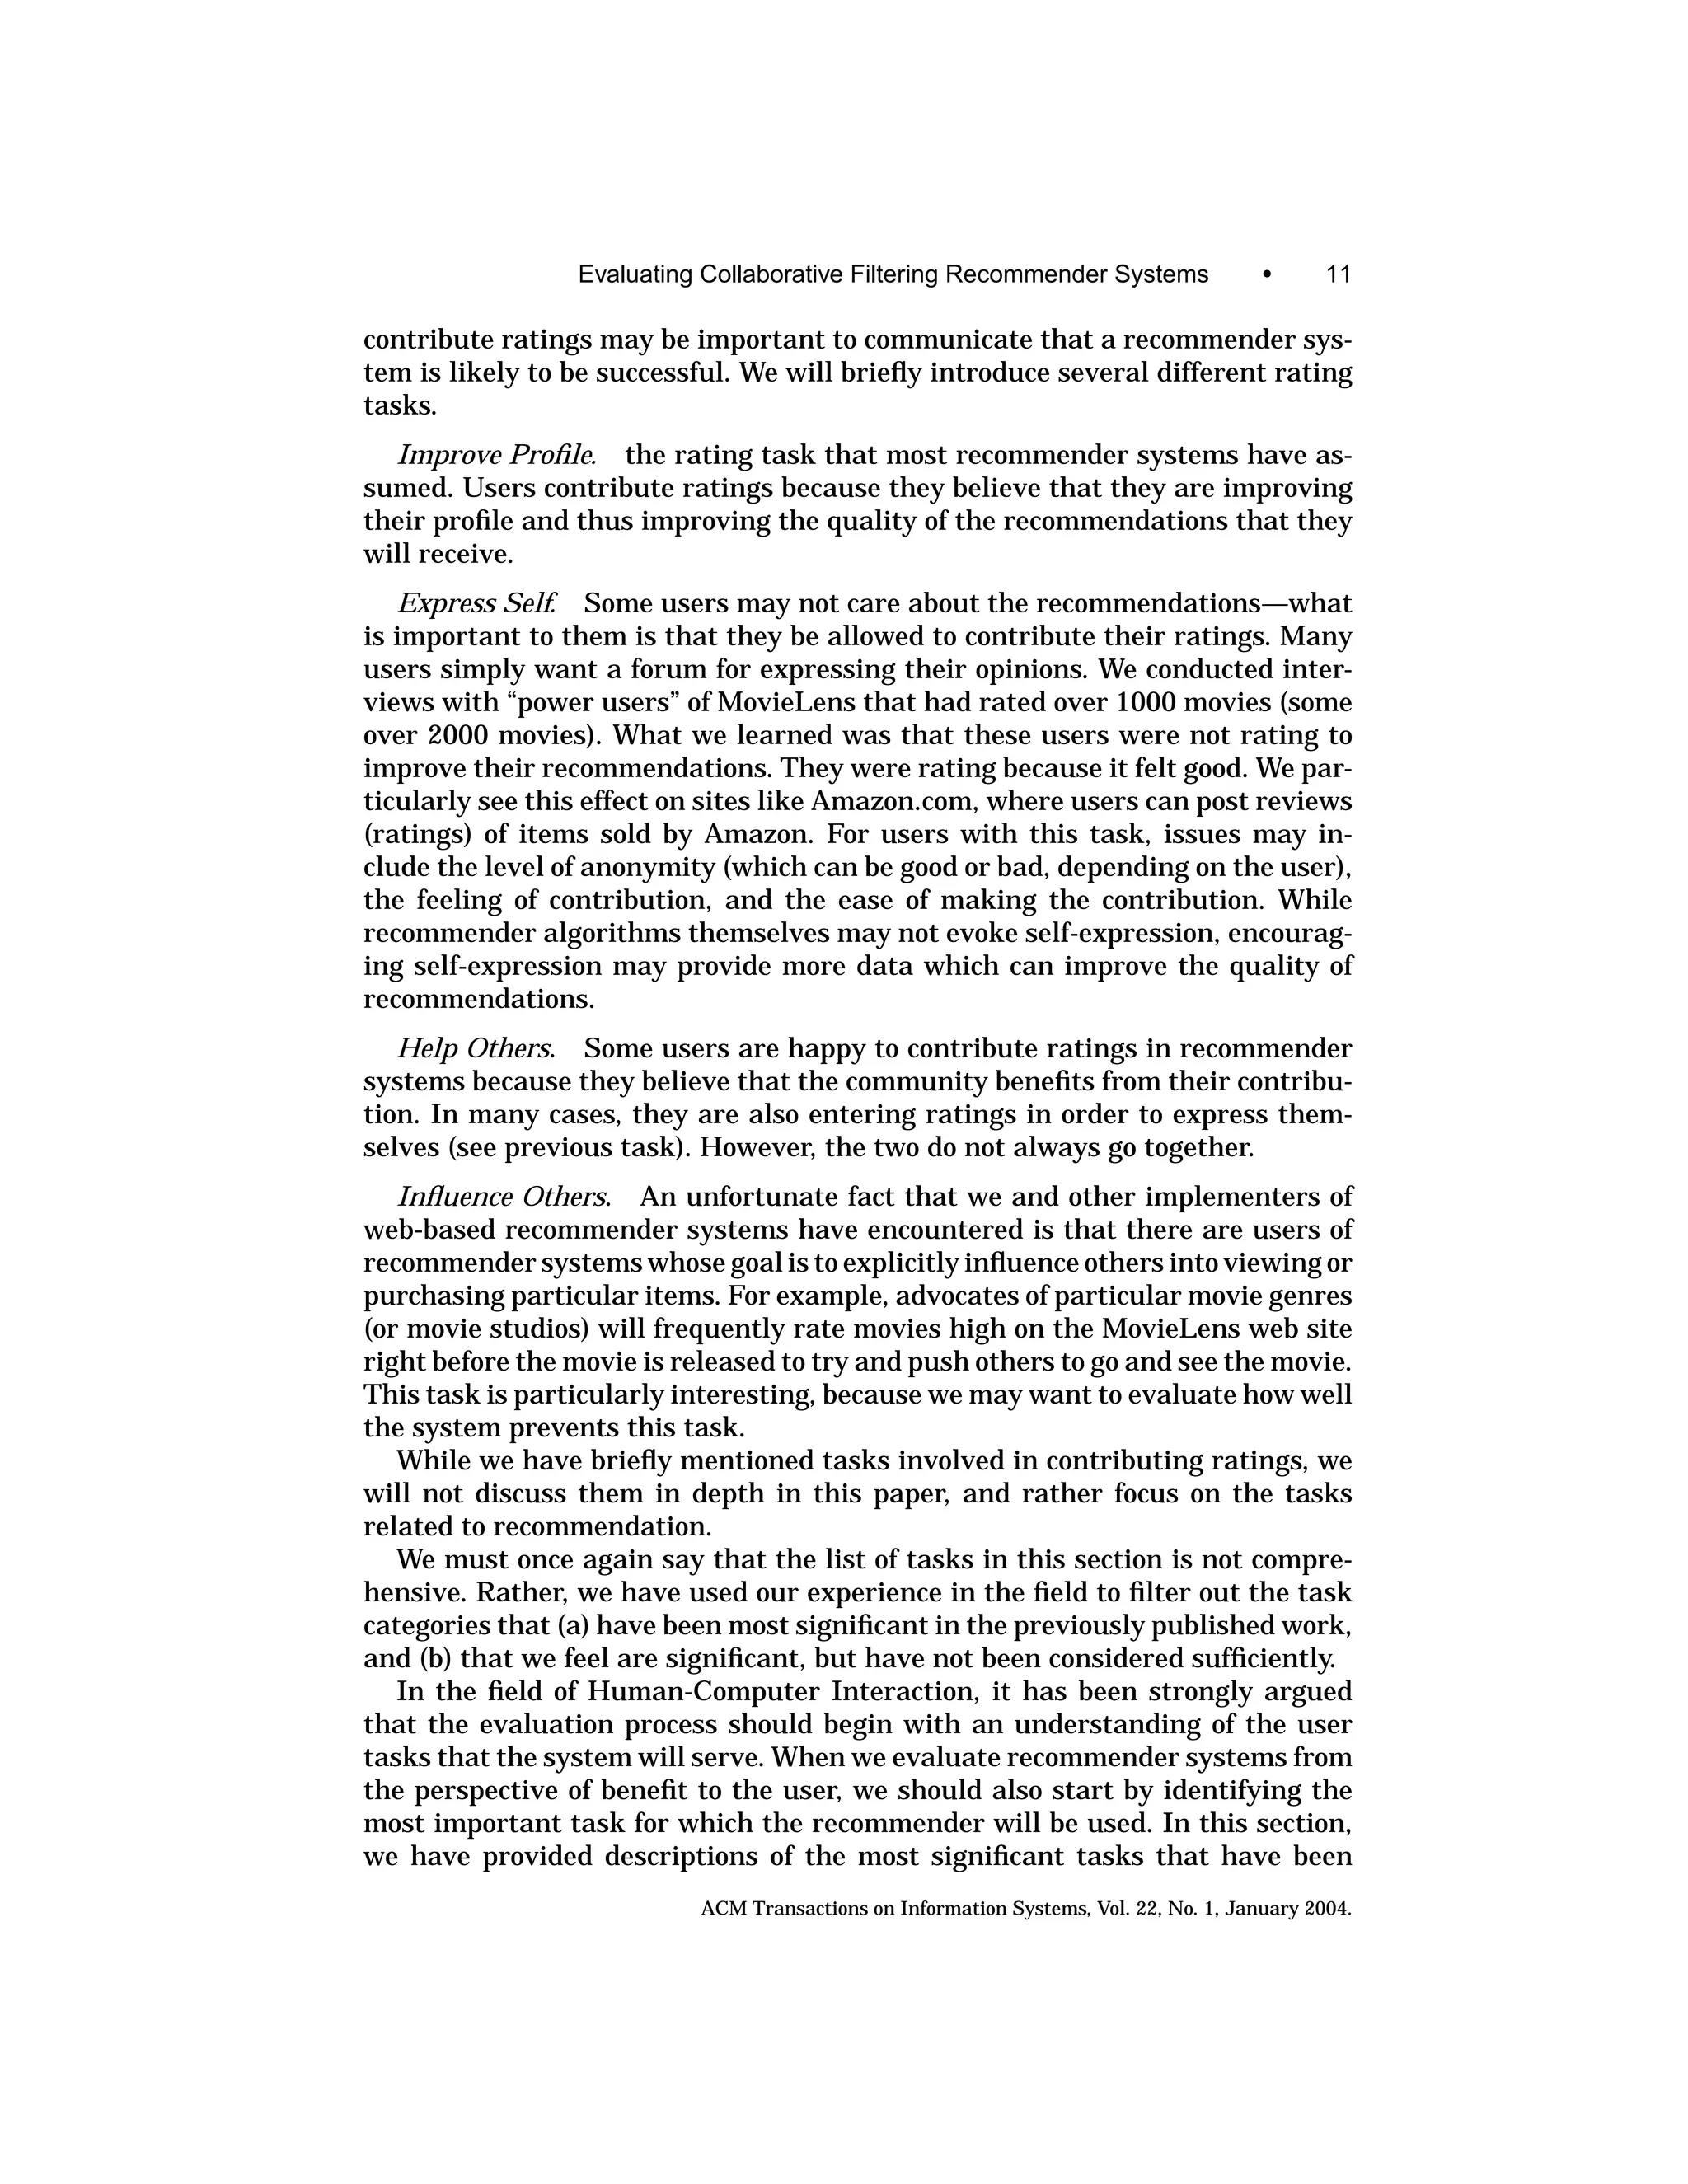
The ROC model attempts to measure the extent to which an information
filtering system can successfully distinguish between signal (relevance) and
noise. The ROC model assumes that the information system will assign a pre-
dicted level of relevance to every potential item. Given this assumption, we can
see that there will be two distributions, shown in Figure 1. The distribution
on the left represents the probability that the system will predict a given level
of relevance (the x-axis) for an item that is in reality not relevant to the in-
formation need. The distribution on the right indicates the same probability
distribution for items that are relevant. Intuitively, we can see that the further
ACM Transactions on Information Systems, Vol. 22, No. 1, January 2004.](https://image.slidesharecdn.com/evaluatingcollaborativefilteringrecommendersystems-2004r-091212144717-phpapp02/75/Evaluating-Collaborative-Filtering-Recommender-Systems-21-2048.jpg)
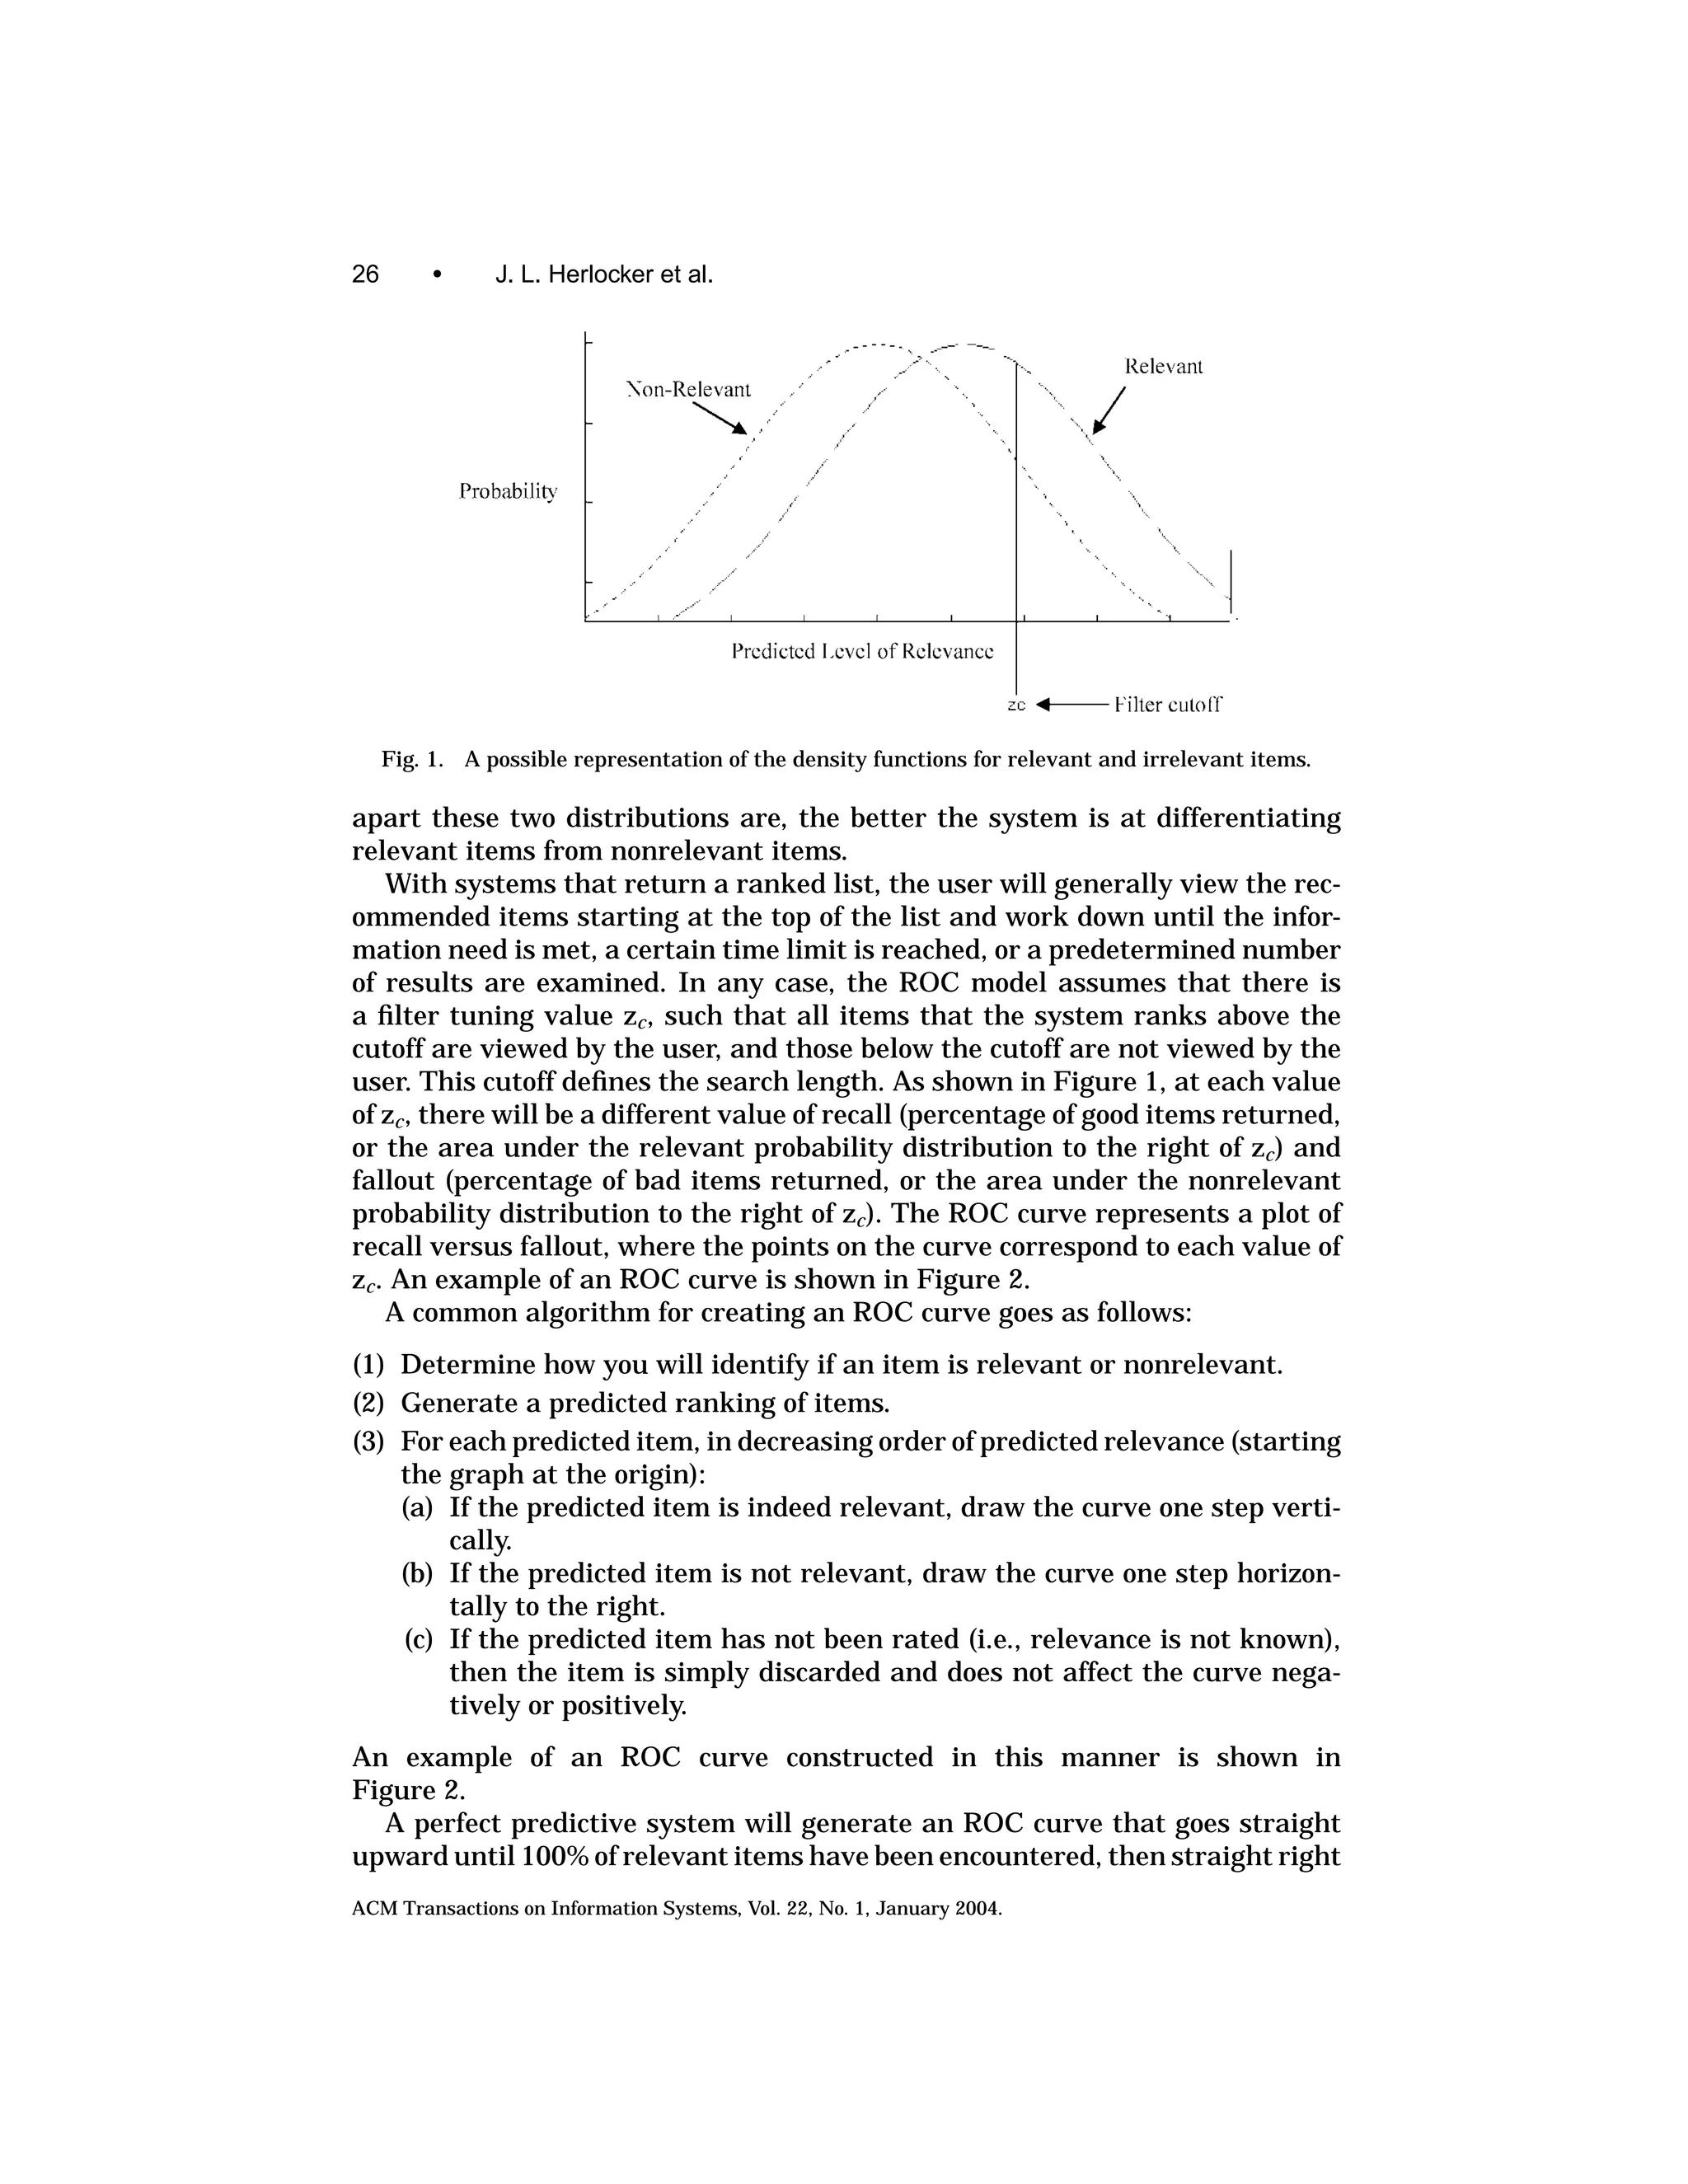
![Evaluating Collaborative Filtering Recommender Systems • 27
Fig. 2. An example of an ROC curve. The p-values shown on the curve represent different pre-
diction cutoffs. For example, if we chose to select all items with predictions of 4 or higher, then we
experience approximately 45% of all relevant items and 20% of all nonrelevant items.
for the remaining items. A random predictor is expected to produce a straight
line from the origin to the upper right corner.2
ROC curves are useful for tuning the signal/noise tradeoff in information
systems. For example, by looking at an ROC curve, you might discover that
your information filter performs well for an initial burst of signal at the top of
the rankings, and then produces only small increases of signal for moderate
increases in noise from then on.
Similar to Precision and Recall measures, ROC curves make an assump-
tion of binary relevance. Items recommended are either successful recommen-
dations (relevant) or unsuccessful recommendation (nonrelevant). One conse-
quence of this assumption is that the ordering among relevant items has no
consequence on the ROC metric—if all relevant items appear before all non-
relevant items in the recommendation list, you will have a perfect ROC curve.
Comparing multiple systems using ROC curves becomes tedious and subjec-
tive, just as with precision and recall. However, a single summary performance
2 Schein et al. [2002] present an alternate method of computing an ROC—a Customer ROC (CROC).
A CROC measurement applied to a perfect recommender may not produce a perfect ROC graph as
described. The reasoning is that some recommender systems may display more recommendations
then there exist “relevant” items to the recommender, and that these additional recommendations
should be counted as false-positives.
ACM Transactions on Information Systems, Vol. 22, No. 1, January 2004.](https://image.slidesharecdn.com/evaluatingcollaborativefilteringrecommendersystems-2004r-091212144717-phpapp02/75/Evaluating-Collaborative-Filtering-Recommender-Systems-23-2048.jpg)
![28 • J. L. Herlocker et al.
number can be obtained from an ROC curve. The area underneath an ROC
curve, also known as Swet’s A measure, can be used as a single metric of the sys-
tem’s ability to discriminate between good and bad items, independent of the
search length. According to Hanley and McNeil [1982], the area underneath the
ROC curve is equivalent to the probability that the system will be able to choose
correctly between two items, one randomly selected from the set of bad items,
and one randomly selected from the set of good items. Intuitively, the area un-
derneath the ROC curve captures the recall of the system at many different
levels of fallout. It is also possible to measure the statistical significance of the
difference between two areas [Hanley and McNeil 1982; Le and Lindren 1995].
The ROC area metric has the disadvantage that equally distant swaps in
the rankings will have the same affect on ROC area regardless of whether they
occur near the top of the ranking or near the end of the ranking. For example,
if a good item is ranked 15 instead of 10, it will have roughly the same affect on
the ROC area as if a good item is ranked 200 instead of 195. This disadvantage
could be significant for tasks such as Find Good Items where the first situation
is likely to have a greater negative affect on the user. This disadvantage is
somewhat minimized by the fact that relevance is binary and exchanges within
a relevance class have no affect (if items ranked 10–15 are all relevant, an
exchange between 10 and 15 will have no affect at all). On the other hand,
for tasks such as Find All Good Items, the discussed disadvantage may not be
significant.
Hanley and McNeil [1982] present a method by which one can determine
the number of data points necessary to ensure that a comparison between two
areas has good statistical power (defined as a high probability of identifying
a difference if one exists). Hanley’s data suggests that many data points may
be required to have a high level of statistical power. The number of required
data points for significance becomes especially large when the two areas being
compared are very close in value. Thus, to confidently compare the results of
different algorithms using ROC area, the potential result set for each user must
also be large.
The advantages of ROC area metric are that it (a) provides a single number
representing the overall performance of an information filtering system, (b)
is developed from solid statistical decision theory designed for measuring the
performance of tasks such as those that a recommender system performs, and
(c) covers the performance of the system over all different recommendation list
lengths.
To summarize the disadvantages of the ROC area metric: (a) a large set of po-
tentially relevant items is needed for each query; (b) for some tasks, such as Find
Good Items users are only interested in performance at one setting, not all possi-
ble settings; (c) equally distant swaps in rankings have the same effect no mat-
ter where in the ranking they occur; and (d) it may need a large number of data
points to ensure good statistical power for differentiating between two areas.
The ROC area measure is most appropriate when there is a clear binary
relevance relationship and the task is similar to Find Good Items, where the
user wants to see as many of the relevant answers as possible within certain
resource limitations.
ACM Transactions on Information Systems, Vol. 22, No. 1, January 2004.](https://image.slidesharecdn.com/evaluatingcollaborativefilteringrecommendersystems-2004r-091212144717-phpapp02/75/Evaluating-Collaborative-Filtering-Recommender-Systems-24-2048.jpg)
![Evaluating Collaborative Filtering Recommender Systems • 29
Ad Hoc Classification Accuracy Measures
Ad hoc measures of classification accuracy have attempted to identify error
rates and, in particular, large errors. Error rate can be measured in a manner
derived from Precision and Recall. Specifically, the error rate for a system is the
number of incorrect recommendations it makes divided by the total number of
recommendations. If a system recommends only a few items, it is possible to
measure error rate experimentally. Jester, for example, which presents jokes to
users, can evaluate the error rate based on the immediate feedback users give
to each joke [Goldberg et al. 2001]. More commonly, the error rate computation
is limited to the subset of recommended items for which a rating is available;
this approach introduces the bias that users commonly avoid consuming (and
therefore rating) items that don’t interest them, and therefore this approximate
error rate is likely to be lower than the true error rate.
Another ad hoc technique specifically identifies large errors. Sarwar et al.
[1998] measured reversals when studying agent-boosted recommendations. Er-
rors of three or more points on a five-point scale were considered significant
enough to potentially undermine user confidence, and therefore were tallied
separately. Such a measurement mixes aspects of classification and prediction
accuracy, but has not been generally used by later researchers. It might be
particularly appropriate for the Evaluate Recommender task.
4.1.3 Rank Accuracy Metrics. Rank accuracy metrics measure the ability
of a recommendation algorithm to produce a recommended ordering of items
that matches how the user would have ordered the same items. Unlike classi-
fication metrics, ranking metrics are more appropriate to evaluate algorithms
that will be used to present ranked recommendation lists to the user, in domains
where the user’s preferences in recommendations are nonbinary.
Rank accuracy metrics may be overly sensitive for domains where the user
just wants an item that is “good enough” (binary preferences) since the user
won’t be concerned about the ordering of items beyond the binary classification.
For example, even if the top ten items ranked by the system were relevant, a
rank accuracy metric might give a nonperfect value because the best item is
actually ranked 10th. By the same token, rank accuracy metrics can distinguish
between the “best” alternatives and just “good” alternatives and may be more
appropriate for domains where that distinction is important. In such domains
it is possible for all the top recommended items to be relevant, but still not be
the “best” items.
Ranking metrics do not attempt to measure the ability of an algorithm to
accurately predict the rating for a single item—they are not predictive accu-
racy metrics and are not appropriate for evaluating the Annotation in Context
task. If a recommender system will be displaying predicted rating values, it
is important to additionally evaluate the system using a predictive accuracy
metric as described above. We examine several correlation metrics, a half-life
utility metric, and the NDPM metric.
4.1.4 Prediction-Rating Correlation. Two variables are correlated if the
variance in one variable can be explained by the variance in the second. Three
ACM Transactions on Information Systems, Vol. 22, No. 1, January 2004.](https://image.slidesharecdn.com/evaluatingcollaborativefilteringrecommendersystems-2004r-091212144717-phpapp02/75/Evaluating-Collaborative-Filtering-Recommender-Systems-25-2048.jpg)
![30 • J. L. Herlocker et al.
of the most well known correlation measures are Pearson’s product–moment
correlation, Spearman’s ρ, and Kendall’s Tau.
Pearson correlation measures the extent to which there is a linear relation-
ship between two variables. It is defined as the covariance of the z-scores, shown
in Eq. (5).
(x − x)( y − y )
¯ ¯
c= . (5)
n ∗ stdev(x) stdev( y)
Rank correlations, such as Spearman’s ρ (Eq. (6)) and Kendall’s Tau, measure
the extent to which two different rankings agree independent of the actual
values of the variables. Spearman’s ρ is computed in the same manner as the
Pearson product–moment correlation, except that the x’s and y’s are trans-
formed into ranks, and the correlations are computed on the ranks.
(u − u)(v − v)
¯ ¯
ρ= . (6)
n ∗ stdev(u) stdev(v)
Kendall’s Tau represents a different approach to computing the correlation of
the rankings that is independent of the variable values. One approximation
to Kendall’s Tau is shown in Eq. (7). C stands for the number of concondant
pairs—pairs of items that the system predicts in the proper ranked order. D
stands for the number of discordant pairs—pairs that the system predicts in
the wrong order. TR is number of pairs of items in the true ordering (the ranking
determined by the user’s ratings) that have tied ranks (i.e., the same rating)
while TP is the number of pairs of items in the predicted ordering that have
tied ranks (the same prediction value)
C−D
Tau = . (7)
sqrt((C + D + TR)(C + D + TP))
In spite of their simplicity, the above correlation metrics have not been used
extensively in the measurement of recommender systems or information re-
trieval systems. Pearson correlation was used by Hill et al. [1995] to evaluate
the performance of their recommender system.
The advantages of correlation metrics are (a) they compare a non-binary
system ranking to a non-binary user ranking, (b) they are well understood by
the scientific community, and (c) they provide a single measurement score for
the entire system.
There may be weaknesses in the way in which the “badness” of an inter-
change is calculated with different correlation metrics. For example, Kendall’s
Tau metric applies equal weight to any interchange of equal distance, no matter
where it occurs (similar to the ROC area metric). Therefore, an interchange be-
tween recommendations 1 and 2 will be just as bad as an interchange between
recommendations 1000 and 1001. However, if the user is much more likely to
consider the first five, and will probably never examine items ranked in the
thousands, the interchange between 1 and 2 should have a more substantial
negative impact on the outcome of the metric.
The Spearman correlation metric does not handle weak (partial) orderings
well. Weak orderings occur whenever there are at least two items in the ranking
ACM Transactions on Information Systems, Vol. 22, No. 1, January 2004.](https://image.slidesharecdn.com/evaluatingcollaborativefilteringrecommendersystems-2004r-091212144717-phpapp02/75/Evaluating-Collaborative-Filtering-Recommender-Systems-26-2048.jpg)
![Evaluating Collaborative Filtering Recommender Systems • 31
such that neither item is preferred over the other. If a ranking is not a weak
ordering then it is called a complete ordering. If the user’s ranking (based on
their ratings) is a weak ordering and the system ranking is a complete ordering,
then the Spearman correlation will be penalized for every pair of items which
the user has rated the same, but the system ranks at different levels. This is
not ideal, since the user shouldn’t care how the system orders items that the
user has rated at the same level. Kendall’s Tau metric also suffers the same
problem, although to a lesser extent than the Spearman correlation.
Half-life Utility Metric
Breese et al. [1998], presented a new evaluation metric for recommender
systems that is designed for tasks where the user is presented with a ranked
list of results, and is unlikely to browse very deeply into the ranked list. Another
description of this metric can be found in Heckerman et al. [2000]. The task for
which the metric is designed is an Internet web-page recommender. They claim
that most Internet users will not browse very deeply into results returned by
search engines.
This half-life utility metric attempts to evaluate the utility of a ranked list
to the user. The utility is defined as the difference between the user’s rating for
an item and the “default rating” for an item. The default rating is generally a
neutral or slightly negative rating. The likelihood that a user will view each
successive item is described with an exponential decay function, where the
strength of the decay is described by a half-life parameter. The expected utility
(Ra ) is shown in Eq. (8). ra, j represents the rating of user a on item j of the
ranked list, d is the default rating, and α is the half-life. The half-life is the
rank of the item on the list such that there is a 50% chance that the user will
view that item. Breese et al. [1998] used a half-life of 5 for his experiments, but
noted that using a half-life of 10 caused little additional sensitivity of results
max(ra, j − d , 0)
Ra = . (8)
j
2( j −1)/(α−1)
max
The overall score for a dataset across all users (R) is shown in Eq. (9). Ra
is the maximum achievable utility if the system ranked the items in the exact
order that the user ranked them
Ra
R = 100 a
max
. (9)
a Ra
The half-life utility metric is best for tasks domains where there is an expo-
nential drop in true utility (one could consider utility from a cost/benefit ratio
analysis) as the search length increases, assuming that the half-life α and de-
fault vote d are chosen appropriately in the utility metric. The utility metric
applies most of the weight to early items, with every successive rank having
exponentially less weight in the measure. To obtain high values of the metric,
the first predicted rankings must consist of items rated highly by the user. The
downside is that if the true function describing the likelihood of accessing each
rank is significantly different from the exponential used in the metric then the
measured results may not be indicative of actual performance. For example, if
ACM Transactions on Information Systems, Vol. 22, No. 1, January 2004.](https://image.slidesharecdn.com/evaluatingcollaborativefilteringrecommendersystems-2004r-091212144717-phpapp02/75/Evaluating-Collaborative-Filtering-Recommender-Systems-27-2048.jpg)
![32 • J. L. Herlocker et al.
the user almost always searches 20 items into the ranked recommendation list,
then the true likelihood function is a step function which is constant for the
first 20 items and 0 afterwards.
The half-life utility metric may be overly sensitive in domains with binary
user preferences where the user only requires that top recommendations be
“good enough” or for user tasks such as Find All Good Items where the user
wants to see all good items.
There are other disadvantages to the half-life utility metric. First, weak
orderings created by the system will result in different possible scores for the
same system ranking. Suppose the system outputs a recommendation list, with
three items sharing the top rank. If the user rated those three items differently,
then depending on what order the recommender outputs those items, the metric
could have very different values (if the ratings were significantly different).
Second, due to the application of the max() function in the metric (Eq. (8)),
all items that are rated less than the default vote contribute equally to the
score. Therefore, an item occurring at system rank 2 that is rated just slightly
less than the default rating (which usually indicates ambivalence) will have
the same effect on the utility as an item that has the worst possible rating.
The occurrence of extremely wrong predictions in the high levels of a system
ranking can undermine the confidence of the user in the system. Metrics that
penalize such mistakes more severely are preferred.
To summarize, the half-life utility metric is the only one that we have ex-
amined that takes into account non-uniform utility. Thus, it could be appropri-
ate for evaluation of the Find Good Items tasks in domains such nonuniform
utility is believed to exist. On the other hand, it has many disadvantages, in
particular when considering standardization across different researchers. Dif-
ferent researchers could use significantly different values of alpha or the default
vote—making it hard to compare results across researchers and making it easy
to manipulate results. Furthermore, the half-life parameter is unlikely to be
the same for all users (different users need/desire different numbers of results).
The NDPM Measure
NDPM was used to evaluate the accuracy of the FAB recommender system
[Balabanov´c and Shoham 1997]. It was originally proposed by Yao [1995]. Yao
ı
developed NDPM theoretically, using an approach from decision and measure-
ment theory. NDPM stands for “normalized distance-based performance mea-
sure.” NDPM (Eq. (10)) can be used to compare two different weakly ordered
rankings
..
2C − + C
NDPM = . (10)
2Ci
C − is the number of contradictory preference relations between the system
ranking and the user ranking. A contradictory preference relation happens
when the system says that item 1 will be preferred to item 2, and the user
ranking says the opposite. C u is the number of compatible preference rela-
tions, where the user rates item 1 higher than item 2, but the system ranking
ACM Transactions on Information Systems, Vol. 22, No. 1, January 2004.](https://image.slidesharecdn.com/evaluatingcollaborativefilteringrecommendersystems-2004r-091212144717-phpapp02/75/Evaluating-Collaborative-Filtering-Recommender-Systems-28-2048.jpg)
![Evaluating Collaborative Filtering Recommender Systems • 33
has item 1 and item 2 at equal preference levels. Ci is the total number of
“preferred” relationships in the user’s ranking (i.e., pairs of items rated by the
user for which one is rated higher than the other). This metric is comparable
among different datasets (it is normalized), because the numerator represents
the distance, and the denominator represents the worst possible distance.
NDPM is similar in form to the Spearman and Kendall’s Tau rank corre-
lations, but provides a more accurate interpretation of the effect of tied user
ranks. However, it does suffer from the same interchange weakness as the rank
correlation metrics (interchanges at the top of the ranking have the same weight
as interchanges at the bottom of the ranking).
Because NDPM does not penalize the system for system orderings when the
user ranks are tied, NDPM may be more appropriate than the correlation met-
rics for domains where the user is interested in items that are “good-enough.”
User ratings could be transformed to binary ratings (if they were not already),
and NDPM could be used to compare the results to the system ranking.
As NDPM only evaluates ordering and not prediction value, it is not appro-
priate for evaluating tasks where the goal is to predict an actual rating value.
4.1.5 An Empirical Comparison of Evaluation Metrics. After conceptually
analyzing the advantages and disadvantages, a natural question is: “which of
these advantages and disadvantages have a significant effect on the outcome of
a metric?” In an effort to quantify the differences between the above-mentioned
evaluation metrics, we computed a set of different evaluation metrics on a set of
results from different variants of a collaborative filtering prediction algorithm
and examined the extent to which the different evaluation metrics agreed or
disagreed.
We examined the predictions generated by variants of a classic nearest-
neighbor collaborative filtering algorithm formed by perturbing many different
key parameters. We used this data for examination of evaluation metrics. There
were 432 different variants of the algorithm tested, resulting in the same num-
ber of sets of predictions. The parameters of the algorithms that were varied
to produce the different results included: size of neighborhood, similarity mea-
sure used to compute closeness of neighbors, threshold over which other users
were considered neighbors, and type of normalization used on the ratings. (see
Herlocker et al. [2002] for more information on the algorithm)
For each of these result sets, we computed mean absolute error, Pearson cor-
relation, Spearman rank correlation, area underneath an ROC-4 and ROC-53
curve, the half-life utility metric, mean average precision at relevant docu-
ments and the NDPM metric. For several of the metrics, there are two different
variants: overall and per-user. The difference between these two variants is
the manner in which averaging was performed. In the overall case, predic-
tions for all the users were pooled together into a single file and then sorted.
Likewise, the ratings for those items were pooled into a single file and sorted.
A ranking metric was then applied once to compare those two files. In the
3 ROC-4 refers to an ROC curve where ratings of 4 and above are considered signal and 3 and below
are considered noise.
ACM Transactions on Information Systems, Vol. 22, No. 1, January 2004.](https://image.slidesharecdn.com/evaluatingcollaborativefilteringrecommendersystems-2004r-091212144717-phpapp02/75/Evaluating-Collaborative-Filtering-Recommender-Systems-29-2048.jpg)
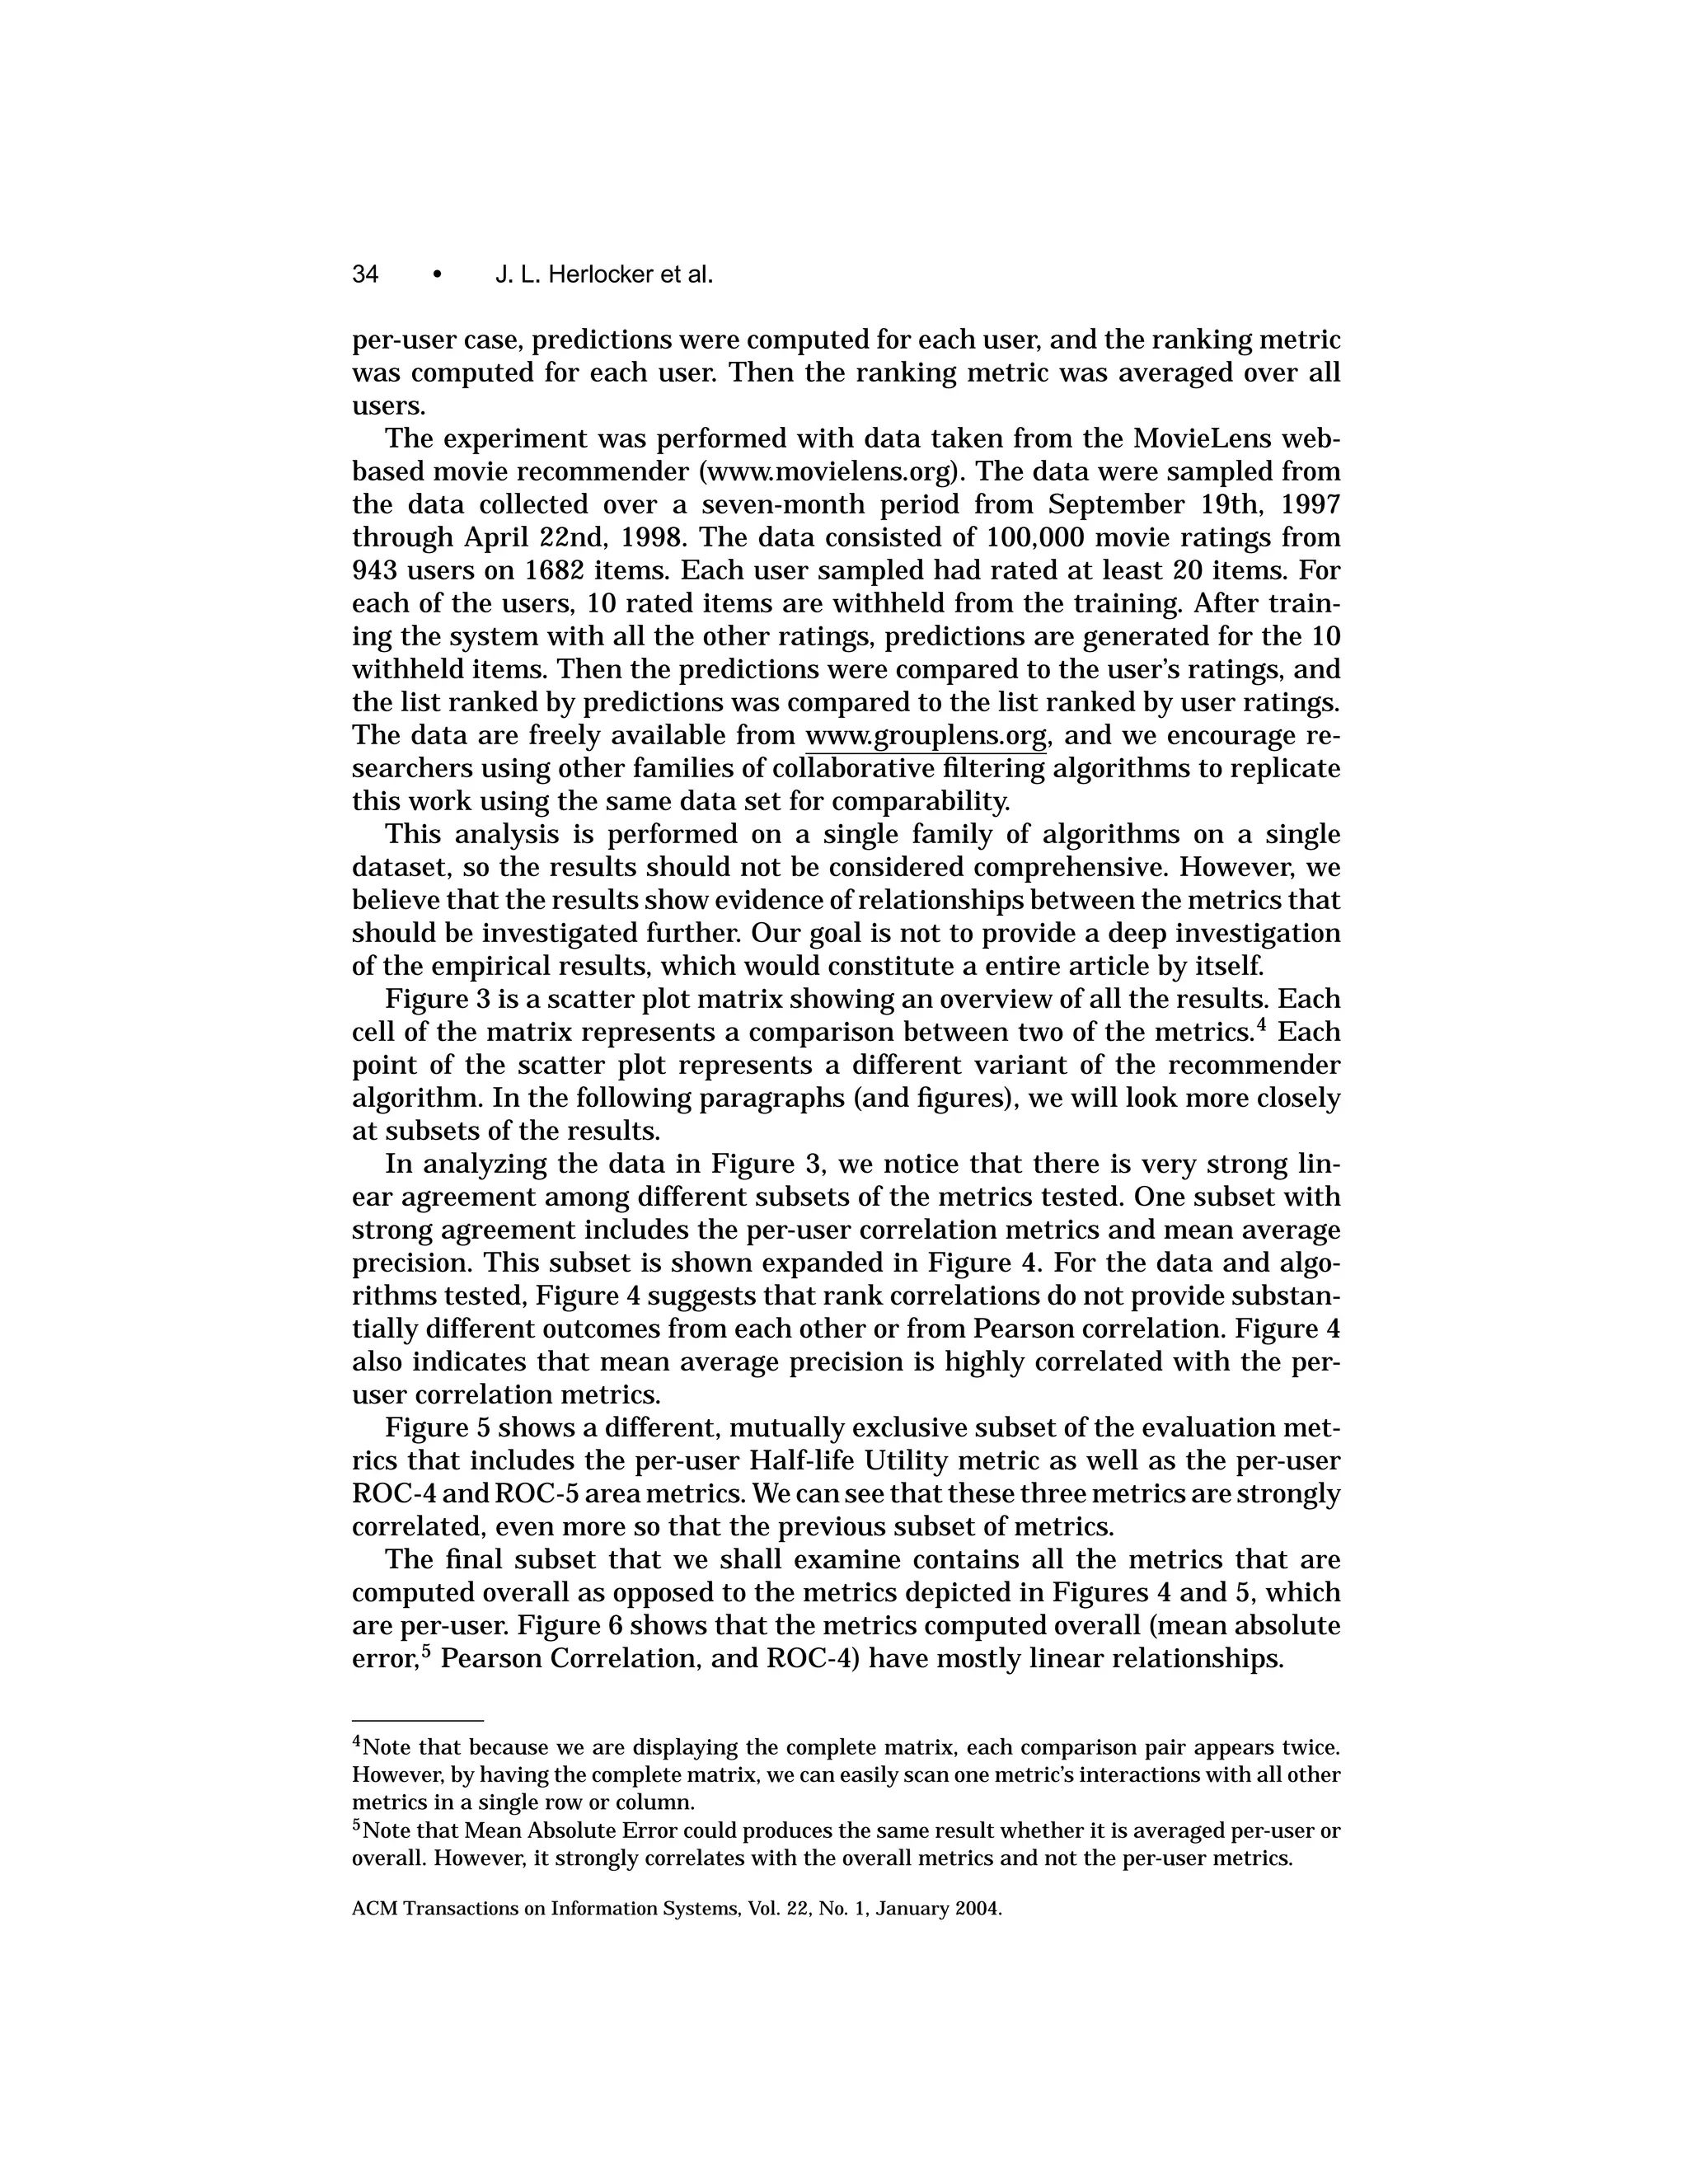
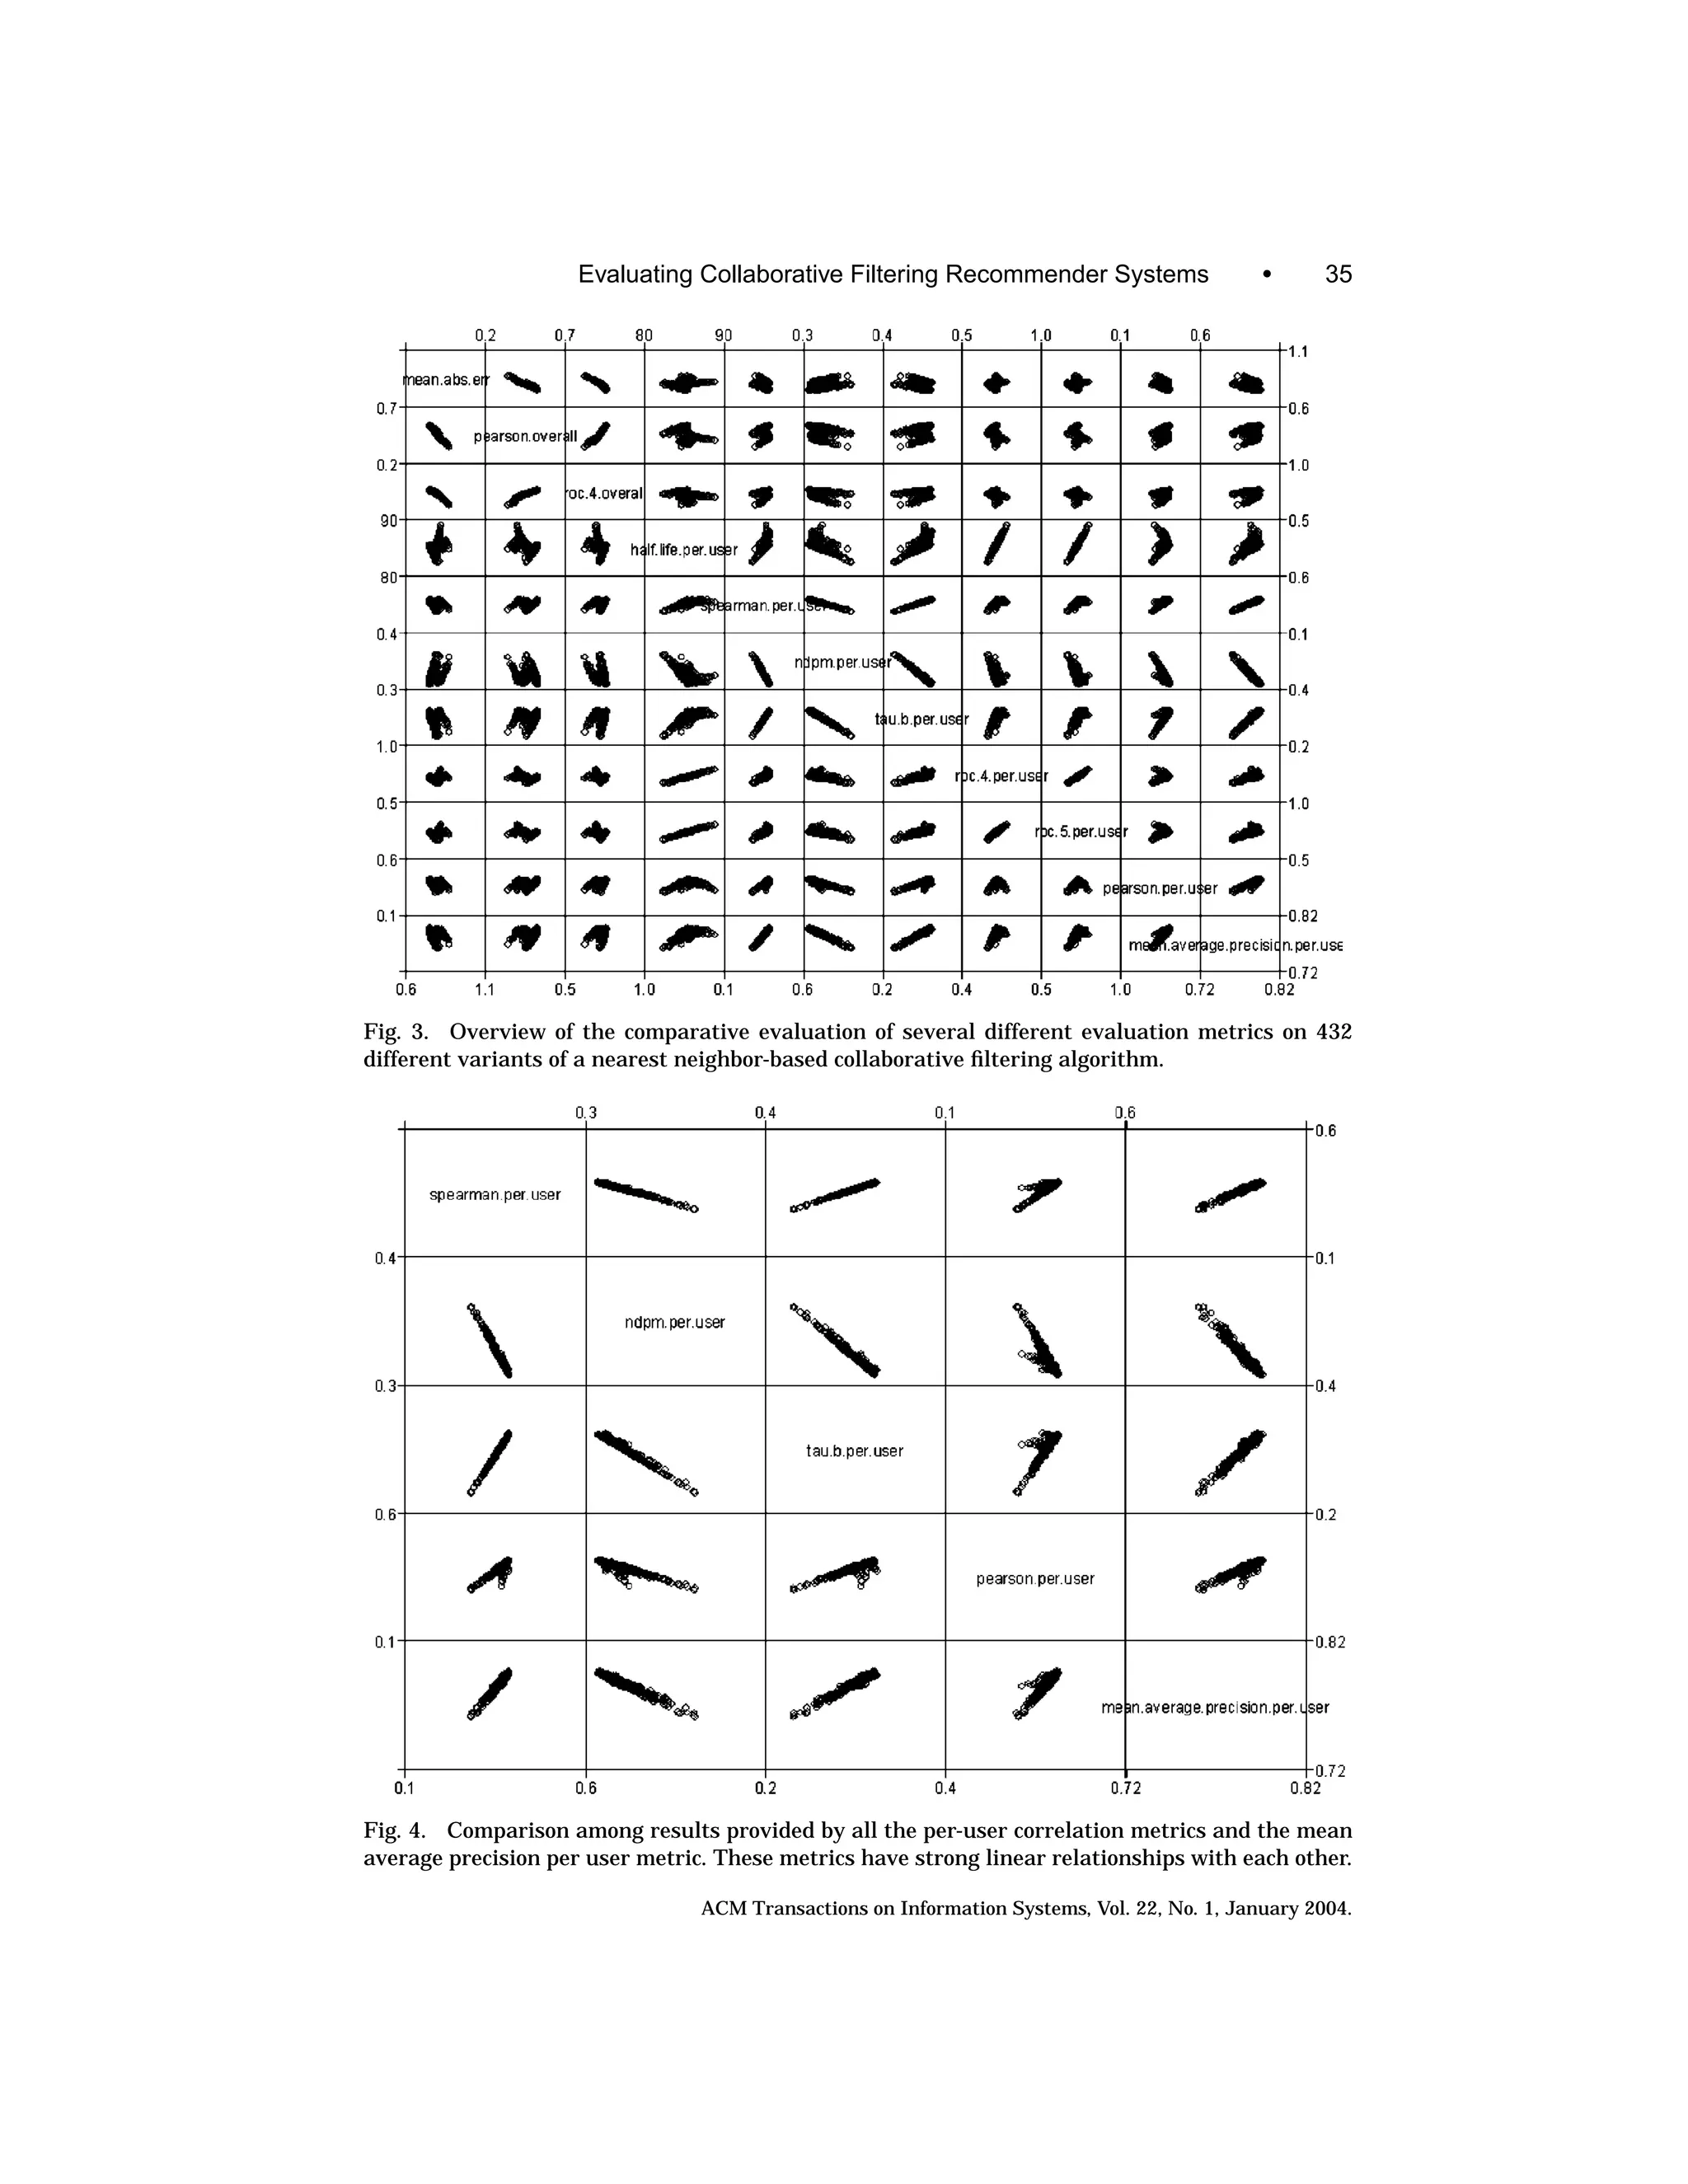
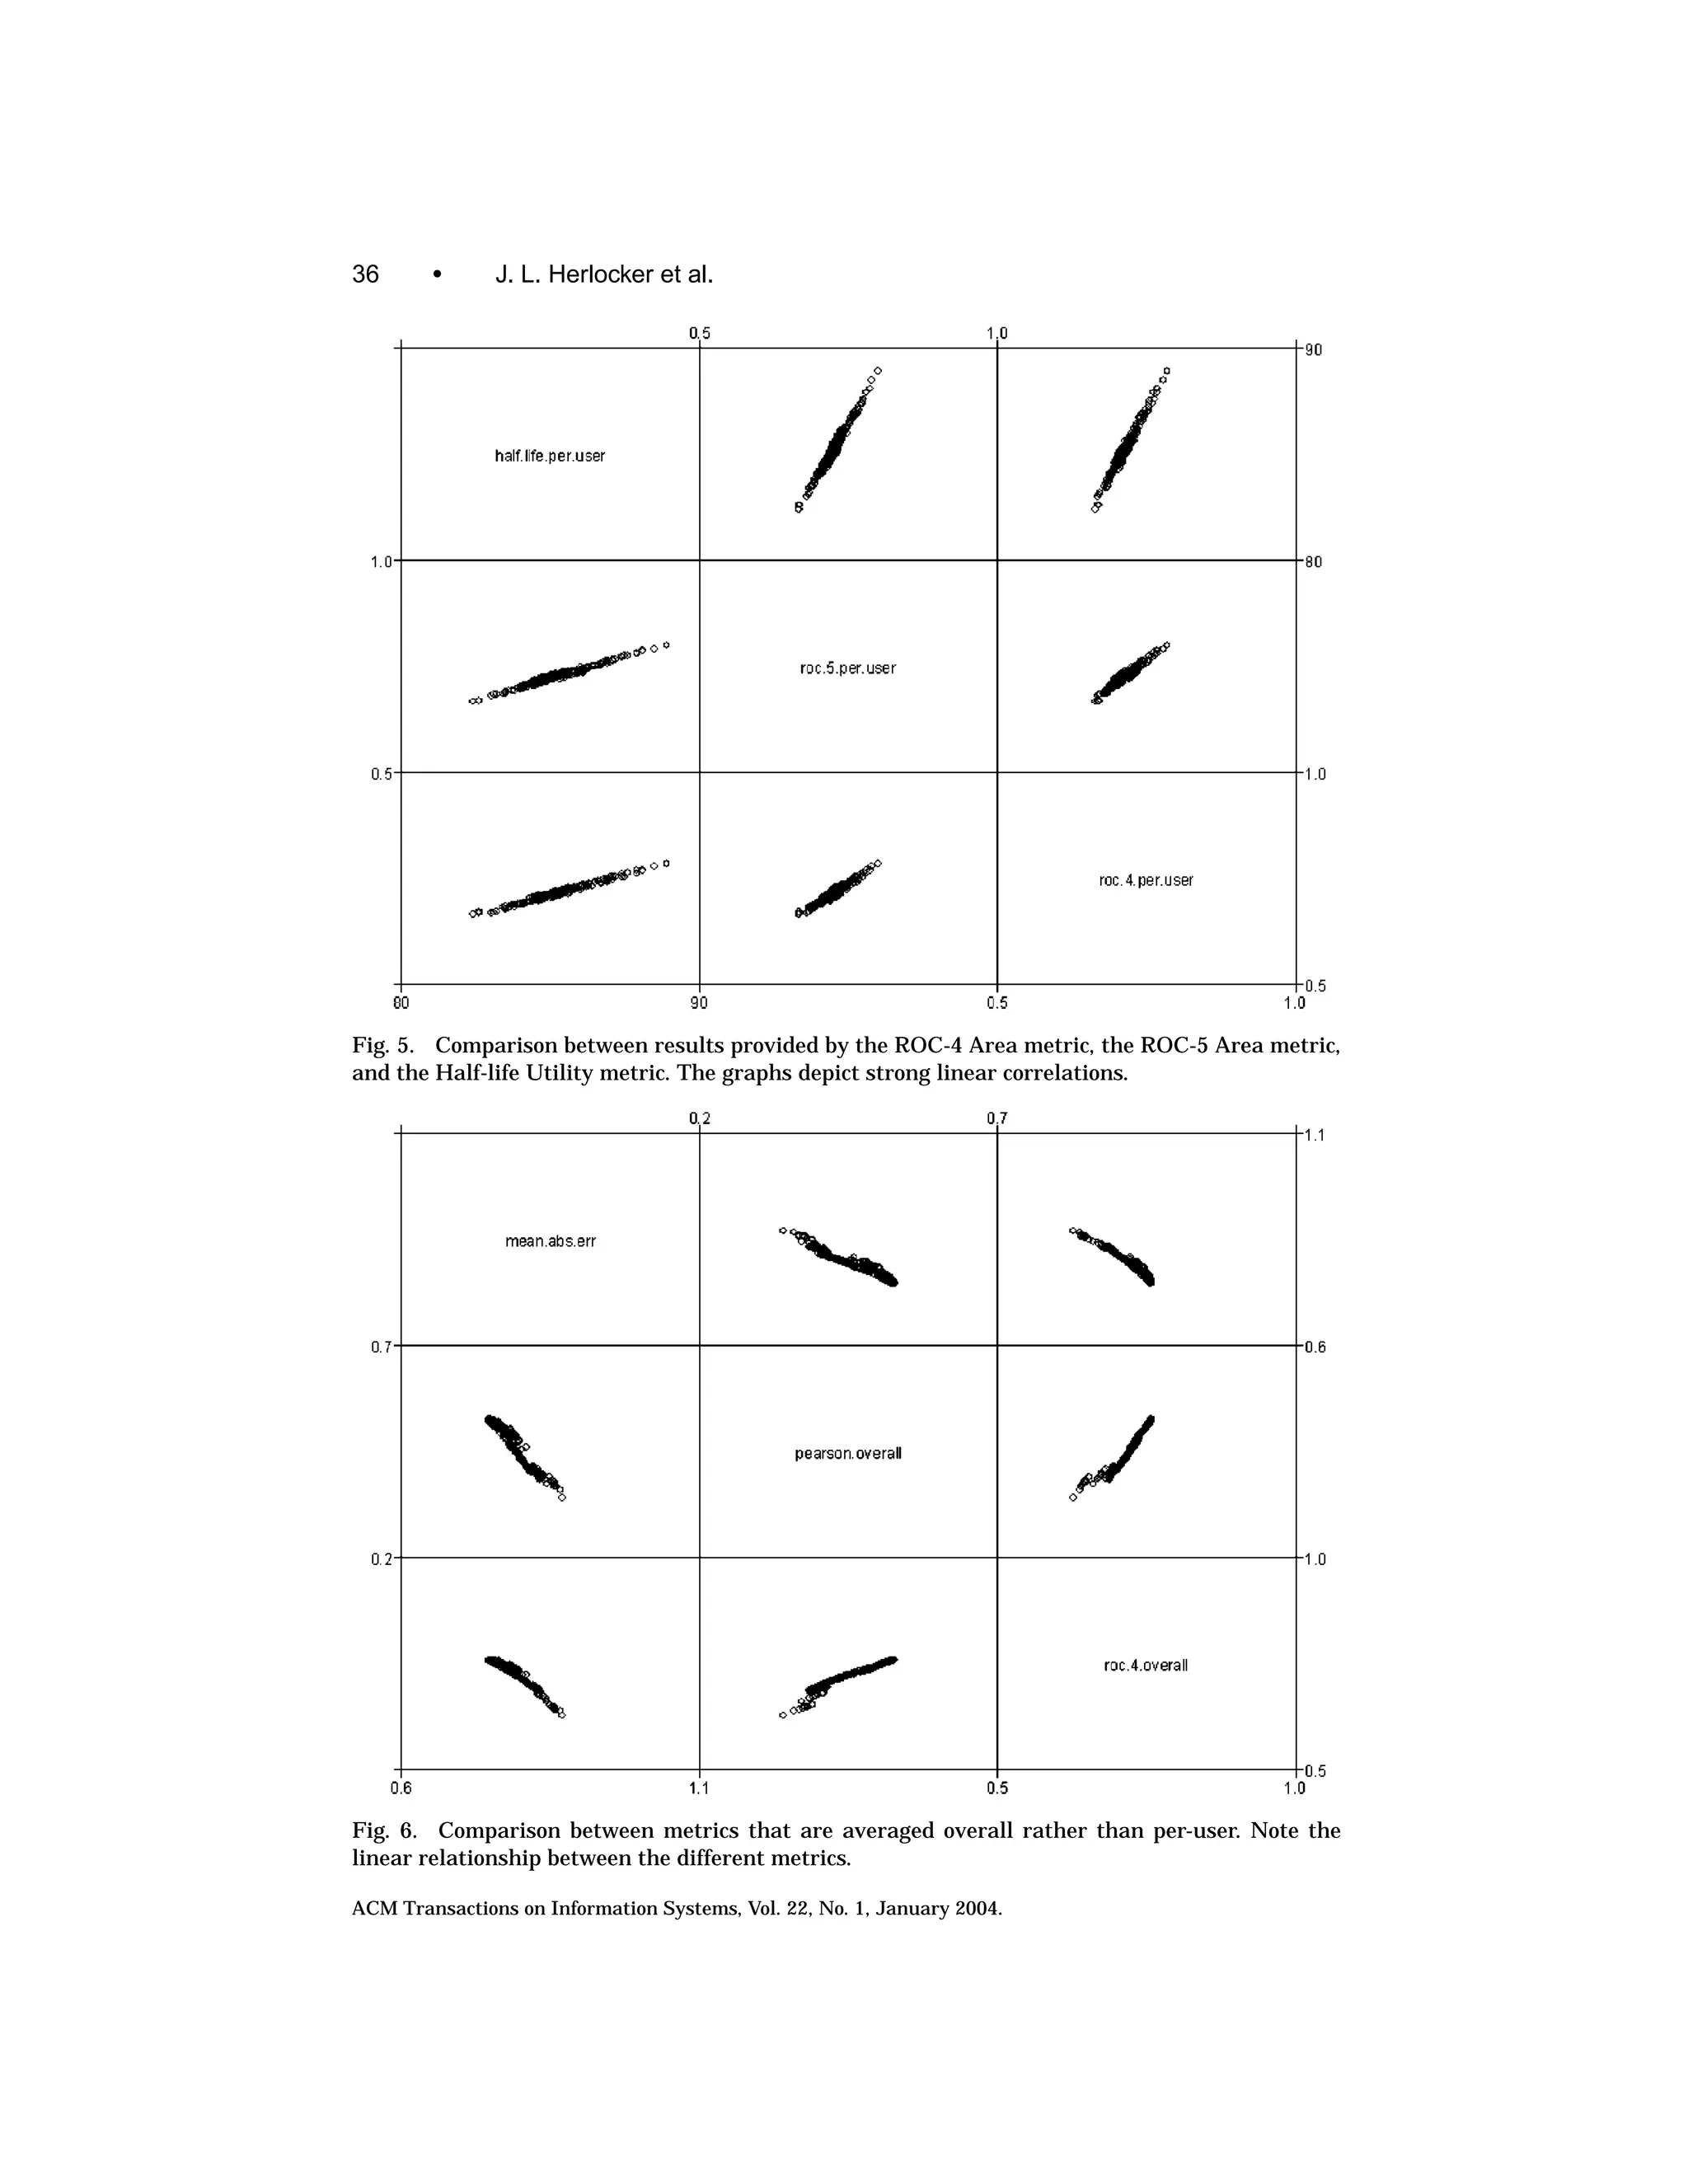
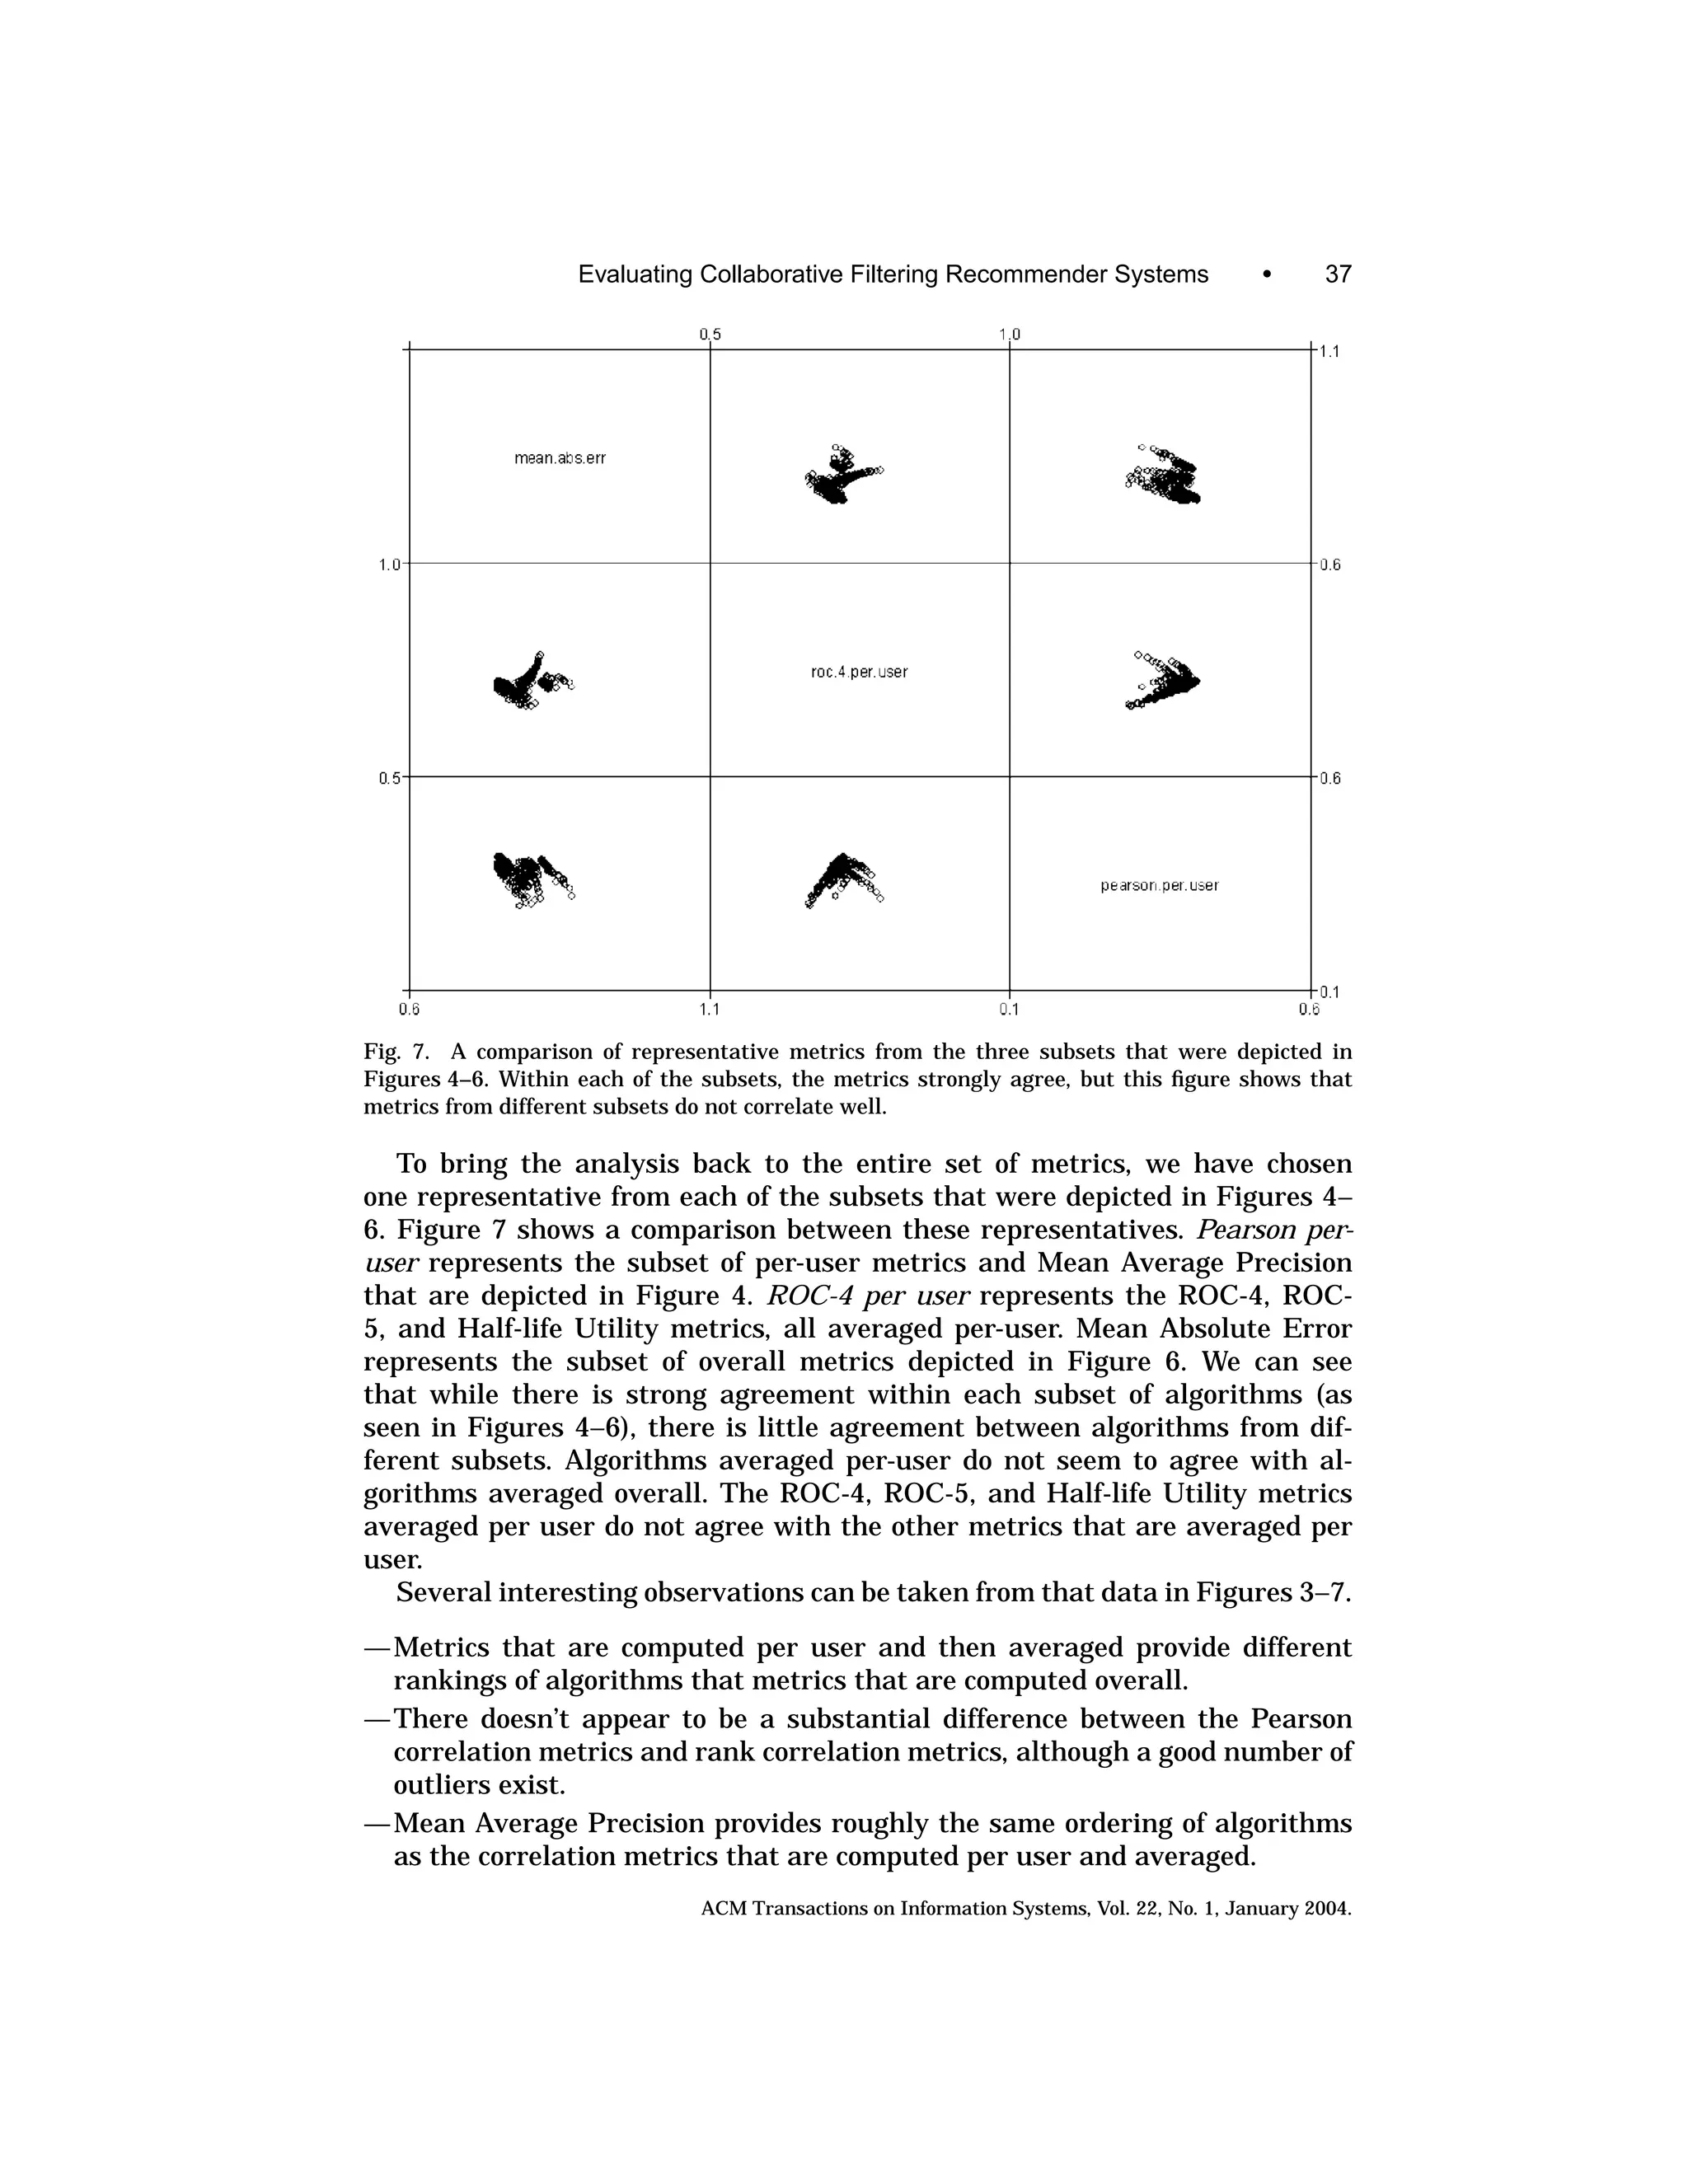
![38 • J. L. Herlocker et al.
— The ROC area metrics (ROC-4 and ROC-5) when computed overall perform
very similar to the other overall metrics, such as Mean Absolute Error and
Pearson Overall. However, when they are averaged per user, they provide
different rankings of algorithms than other per-user metrics, with the excep-
tion of the Half-life Utility metric
— The Half-life utility metric, which is averaged per user provides different
rankings of algorithms than the per-user correlation metrics and mean aver-
age precision, yet produces rankings similar to the ROC area metrics when
computed per user.
In support of these observations, Schein et al. [2002] have also observed
that overall metrics and per-user metric can provide conflicting results. They
observed differences between an overall ROC (which they call Global ROC) and
a per-user ROC (which they call a Customer ROC).
One should hold in mind that these empirical results, while based on nu-
merous data points, all represent perturbations of the same base algorithm.
The range in rank scores do not vary that much. Future work could extend
the comparison of these evaluation metrics across significantly different rec-
ommendation algorithms.
4.2 Accuracy Metrics—Summary
We have examined a variety of accuracy evaluation metrics that have been
used before to evaluate collaborative filtering systems. We have examined them
both conceptually and empirically. The conceptual analysis suggests that cer-
tain evaluation metrics are more appropriate for certain tasks. Based on this
analysis, there appears to be a potential for inaccurate measurement of certain
tasks if the wrong metric is used. Our empirical analysis of one class of collab-
orative filtering algorithm demonstrates that many of the argued conceptual
mismatches between metrics and tasks do not manifest themselves when eval-
uating the performance of predictive algorithms on movie rating data. On the
other hand, we were able to demonstrate that different outcomes in evaluation
can be obtained by carefully choosing evaluation metrics from different classes
that we identified.
The empirical analysis that we have performed represents only a sample—
one class of algorithm and one dataset. A TREC-like environment for collab-
orative filtering algorithms, with different tracks (and datasets) for different
tasks would provide algorithmic results from many different algorithms and
systems. These results would provide valuable data for the further verification
of the properties of metrics discussed in this section.
A final note is that a similar (but very brief) analysis has been performed on
metrics for evaluating text retrieval systems. Voorhees and Harman [1999] re-
port the strength of correlations computed between different evaluation metrics
used in the TREC-7 analysis. Instead of showing scatterplots relating metrics,
they computed correlation values between different metrics. Their results fo-
cused primarily on different variants of precision/recall that we do not discuss
here. As the domain features of the document retrieval context are significantly
ACM Transactions on Information Systems, Vol. 22, No. 1, January 2004.](https://image.slidesharecdn.com/evaluatingcollaborativefilteringrecommendersystems-2004r-091212144717-phpapp02/75/Evaluating-Collaborative-Filtering-Recommender-Systems-34-2048.jpg)
![Evaluating Collaborative Filtering Recommender Systems • 39
different from the recommender systems context, we do not attempt to incor-
porate their results here.
5. BEYOND ACCURACY
There is an emerging understanding that good recommendation accuracy alone
does not give users of recommender systems an effective and satisfying experi-
ence. Recommender systems must provide not just accuracy, but also usefulness.
For instance, a recommender might achieve high accuracy by only computing
predictions for easy-to-predict items—but those are the very items for which
users are least likely to need predictions. Further, a system that always recom-
mends very popular items can promise that users will like most of the items
recommended—but a simple popularity metric could do the same thing. (Rec-
ommending only very unpopular items and promising that users won’t like
them is even less useful.)
By recalling that performance of a recommender system must be evaluated
with respect to specific user tasks and the domain context, we can deepen the
argument for moving beyond accuracy. For example, consider the Find Good
Items task in a domain where the user wants to select a single item whose value
exceeds a threshold—and suppose that the system follows a typical strategy of
offering a relatively small, ordered set of recommendations. In this case, it may
be best for the system to try to generate a few highly useful recommendations,
even at the risk of being off the mark with the others. If the supporting infor-
mation about the items is good enough, then the user will be able to identify
the best recommendation quickly. Turpin and Hersh’s [2001] study of search
engines provides support for this position. Their subjects were divided into two
sets, with half using a simple, baseline search engine, and the others using a
state of the art engine. While the latter returned significantly more accurate re-
sults, subjects in both cases were about as successful at completing their tasks
(e.g., finding the answer to a question such as “Identify a set of Roman ruins
in present-day France”). Turpin and Hersh believed that this showed that the
difference between (say) 3 and 5 relevant documents in a list of 10 documents
was not really material to the user; nor did it matter much if the relevant
documents were right at the top of the list or a bit further down. Subjects were
able to scan through the titles and brief synopses and quickly locate a relevant
document.
This section considers measures of recommender system usefulness that
move beyond accuracy to include suitability of the recommendations to users.
Suitability includes coverage, which measures the percentage of a dataset that
the recommender system is able to provide predictions for; confidence met-
rics that can help users make more effective decisions; the learning rate,
which measures how quickly an algorithm can produce good recommenda-
tions; and novelty/serendipity, which measure whether a recommendation
is a novel possibility for a user. Finally, we explore measures of recom-
mender system utility based on user satisfaction with and performance on a
system.
ACM Transactions on Information Systems, Vol. 22, No. 1, January 2004.](https://image.slidesharecdn.com/evaluatingcollaborativefilteringrecommendersystems-2004r-091212144717-phpapp02/75/Evaluating-Collaborative-Filtering-Recommender-Systems-35-2048.jpg)
![40 • J. L. Herlocker et al.
5.1 Coverage
The coverage of a recommender system is a measure of the domain of
items in the system over which the system can form predictions or make
recommendations. Systems with lower coverage may be less valuable to users,
since they will be limited in the decisions they are able to help with. Cover-
age is particularly important for the Find All Good Items task, since systems
that cannot evaluate many of the items in the domain cannot find all of the
good items in that domain. Coverage is also very important for the Annotate
In Context task, as no annotation is possible for items where no prediction is
available. Coverage can be most directly defined on predictions by asking “What
percentage of items can this recommender form predictions for?” This type of
coverage is often called prediction coverage. A different sort of coverage metric
can be formed for recommendations, more along the lines of “What percentage
of available items does this recommender ever recommend to users?” For an
e-commerce site, the latter form of coverage measures how much of the mer-
chant’s catalog of items are recommended by the recommender; for this reason
we’ll call it catalog coverage.
Coverage has been measured by a number of researchers in the past [Good
et al. 1999, Herlocker et al. 1999, Sarwar et al. 1998]. The most common mea-
sure for coverage has been the number of items for which predictions can be
formed as a percentage of the total number of items. The easiest way to measure
coverage of this type is to select a random sample of user/item pairs, ask for
a prediction for each pair, and measure the percentage for which a prediction
was provided. Much as precision and recall must be measured simultaneously,
coverage must be measured in combination with accuracy, so recommenders
are not tempted to raise coverage by making bogus predictions for every
item.
An alternative way of computing coverage considers only coverage over items
in which a user may have some interest. Coverage of this type is not usually
measured over all items, but only over those items a user is known to have
examined. For instance, when the predictive accuracy is computed by hiding
a selection of ratings and having the recommender compute a prediction for
those ratings, the coverage can be measured as the percentage of covered items
for which a prediction can be formed. The advantage of this metric is it may
correspond better to user needs, since it is not important whether a system
can recommend items a user has no interest in. (For instance, if a user has
no interest in particle physics, it is not a disadvantage that a particular rec-
ommender system for research papers cannot form predictions for her about
particle physics.)
Catalog coverage, expressed as the percentage of the items in the catalog
that are ever recommended to users, has been measured less often. Catalog
coverage is usually measured on a set of recommendations formed at a single
point in time. For instance, it might be measured by taking the union of the top
10 recommendations for each user in the population. Similarly to all coverage
metrics, this metric distorts if it is not considered in combination with accuracy.
For instance, if there is an item in the catalog that is uninteresting to all users,
ACM Transactions on Information Systems, Vol. 22, No. 1, January 2004.](https://image.slidesharecdn.com/evaluatingcollaborativefilteringrecommendersystems-2004r-091212144717-phpapp02/75/Evaluating-Collaborative-Filtering-Recommender-Systems-36-2048.jpg)
![Evaluating Collaborative Filtering Recommender Systems • 41
a good algorithm should never recommend it, leading to lower coverage—but
higher accuracy.
We know of no perfect, general coverage metric. Such a metric would have
the following characteristics: (1) It would measure both prediction coverage
and catalog coverage; (2) For prediction coverage it would more heavily weight
items for which the user is likely to want predictions; (3) There would be a
way to combine the coverage measure with accuracy measures to yield an over-
all “practical accuracy” measure for the recommender system. Recommender
systems researchers must continue to work to develop coverage metrics with
these properties. In the meantime, we should continue to use the best available
metrics, and it is crucial that we continue to report the coverage of our recom-
mender systems. Best practices are to report the raw percentage of items for
which predictions can be formed, and to also report catalog coverage for recom-
mender algorithms. Where practical, these metrics should be augmented with
measures that more heavily weight likely items. These metrics should be con-
sidered experimental, but will eventually lead to more useful coverage metrics.
Comparing recommenders along these dimensions will ensure that new rec-
ommenders are not achieving accuracy by “cherry-picking” easy-to-recommend
items, but are providing a wide range of useful recommendations to users.
5.2 Learning Rate
Collaborative filtering recommender systems incorporate learning algorithms
that operate on statistical models. As a result, their performance varies based
on the amount of learning data available. As the quantity of learning data
increases, the quality of the predictions or recommendations should increase.
Different recommendation algorithms can reach “acceptable” quality of rec-
ommendations at different rates. Some algorithms may only need a few data
points to start generating acceptable recommendations, while others may need
extensive data points. Three different learning rates have been considered in
recommender systems: overall learning rate, per item learning rate, and per
user learning rate. The overall learning rate is recommendation quality as a
function of the overall number of ratings in the system (or the overall number of
users in the system). The per-item learning rate is the quality of predictions for
an item as a function of the number of ratings available for that item. Similarly
the per-user learning rate is the quality of the recommendations for a user as
a function of the number of ratings that user has contributed.
The issue of evaluating the learning rates in recommender systems has not
been extensively covered in the literature, although researchers such as Schein
et al. [2001] have looked at evaluating the performance of recommender sys-
tems in “cold-start” situations. “Cold-start” situations (commonly referred to as
the startup problem) refer to situations where there are only a few ratings on
which to base recommendations. Learning rates are non-linear and asymptotic
(quality can’t improve forever), and thus it is challenging to represent them
compactly. The most common method for comparing the learning rates of dif-
ferent algorithms is to graph the quality versus the number of ratings (quality
is usually accuracy).
ACM Transactions on Information Systems, Vol. 22, No. 1, January 2004.](https://image.slidesharecdn.com/evaluatingcollaborativefilteringrecommendersystems-2004r-091212144717-phpapp02/75/Evaluating-Collaborative-Filtering-Recommender-Systems-37-2048.jpg)
![42 • J. L. Herlocker et al.
The lack of evaluation of learning rates is due largely to the size of the Each-
movie, MovieLens, and Jester datasets, all of which have a substantial number
of ratings. As recommender systems spread into the more data-sparse domains,
algorithm learning rates will become a much more significant evaluation factor.
5.3 Novelty and Serendipity
Some recommender systems produce recommendations that are highly accu-
rate and have reasonable coverage—and yet that are useless for practical pur-
poses. For instance, a shopping cart recommender for a grocery store might
suggest bananas to any shopper who has not yet selected them. Statistically,
this recommendation is highly accurate: almost everyone buys bananas. How-
ever, everyone who comes to a grocery store to shop has bought bananas in the
past, and knows whether or not they want to purchase more. Further, grocery
store managers already know that bananas are popular, and have already or-
ganized their store so people cannot avoid going past the bananas. Thus, most
of the time the shopper has already made a concrete decision not to purchase
bananas on this trip, and will therefore ignore a recommendation for bananas.
Much more valuable would be a recommendation for the new frozen food the
customer has never heard of—but would love. A similar situation occurs in
a music store around very well known items, like the Beatles’ famous White
Album. Every music aficionado knows about the White Album—and most al-
ready own it. Those who do not own it already have likely made a conscious
decision not to own it. A recommendation to purchase it is therefore unlikely
to lead to a sale. In fact, the White Album is an even worse recommendation
than bananas, since most people only buy one copy of any given album. Much
more valuable would be a recommendation for an obscure garage band that
makes music that this customer would love, but will never hear about through
a review or television ad.
Bananas in a grocery store, and the White Album in a music store, are ex-
amples of recommendations that fail the obviousness test. Obvious recommen-
dations have two disadvantages: first, customers who are interested in those
products have already purchased them; and second, managers in stores do not
need recommender systems to tell them which products are popular overall.
They have already invested in organizing their store so those items are easily
accessible to customers.
Obvious recommendations do have value for new users. Swearingen and
Sinha [2001] found that users liked receiving some recommendations of items
that they already were familiar with. This seems strange since such recom-
mendations do not give users any new information. However, what they do
accomplish is to increase user confidence in the system which is very important
for the Find Credible Recommender task. Additionally, users were more likely
to say they would buy familiar items than novel ones. This contrasts with the
situation when users were asked about downloading material for free (e.g., as
is the case for many technical papers on the Web or for many mp3 music files).
Here, users tended to prefer more novel recommendations. The general lesson
to take away is that a system may want to try to estimate the probability that
a user will be familiar with an item. For some tasks (and perhaps early in the
ACM Transactions on Information Systems, Vol. 22, No. 1, January 2004.](https://image.slidesharecdn.com/evaluatingcollaborativefilteringrecommendersystems-2004r-091212144717-phpapp02/75/Evaluating-Collaborative-Filtering-Recommender-Systems-38-2048.jpg)
![Evaluating Collaborative Filtering Recommender Systems • 43
course of user’s experience with the system), a greater number of familiar items
should be recommended; for others, fewer or none should be included.
We need new dimensions for analyzing recommender systems that consider
the “nonobviousness” of the recommendation. One such dimension is novelty,
which has been addressed before in information retrieval literature (see Baeza-
Yates and Ribiero-Neto [1999] for a brief discussion of novelty in information
retrieval). Another related dimension is serendipity. A serendipitous recom-
mendation helps the user find a surprisingly interesting item he might not
have otherwise discovered. To provide a clear example of the difference be-
tween novelty and serendipity, consider a recommendation system that simply
recommends movies that were directed by the user’s favorite director. If the
system recommends a movie that the user wasn’t aware of, the movie will be
novel, but probably not serendipitous. The user would have likely discovered
that movie on their own. On the other hand, a recommender that recommends
a movie by a new director is more likely to provide serendipitous recommen-
dations. Recommendations that are serendipitous are by definition also novel.
The distinction between novelty and serendipity is important when evaluat-
ing collaborative filtering recommender algorithms, because the potential for
serendipitous recommendations is one facet of collaborative filtering that tradi-
tional content-based information filtering systems do not have. It is important
to note that the term, serendipity, is sometimes incorrectly used in the literature
when novelty is actually being discussed.
Several researchers have studied novelty and serendipity in the context of
collaborative filtering systems [Sarwar et al. 2001]. They have modified their
algorithms to capture serendipity by preferring to recommend items that are
more preferred by a given user than by the population as a whole. A simple
modification is to create a list of “obvious” recommendations, and remove the
obvious ones from each recommendation list before presenting it to users. A dis-
advantage of this approach is that the list of obvious items might be different
for each user, since each person has had different experiences in the past. An
alternative would combine what is known about the user’s tastes with what is
known about the community’s tastes. For instance, consider a hypothetical rec-
ommender that can produce a list of the probabilities for each item in the system
that a given user will like the item. A naive recommender would recommend
the top 10 items in the list—but many of these items would be “obvious” to the
customer. An alternative would be to divide each probability by the probability
that an average member of the community would like the item, and re-sort by
the ratio. Intuitively, each ratio represents the amount that the given user will
like the product more than most other users. Very popular items will be rec-
ommended only if they are likely to be exceptionally interesting to the present
user. Less popular items will often be recommended, if they are particularly
interesting to the present user. This approach will dramatically change the set
of recommendations made to each user, and can help users uncover surprising
items that they like.
Designing metrics to measure serendipity is difficult, because serendipity is a
measure of the degree to which the recommendations are presenting items that
are both attractive to users and surprising to them. In fact, the usual methods
ACM Transactions on Information Systems, Vol. 22, No. 1, January 2004.](https://image.slidesharecdn.com/evaluatingcollaborativefilteringrecommendersystems-2004r-091212144717-phpapp02/75/Evaluating-Collaborative-Filtering-Recommender-Systems-39-2048.jpg)
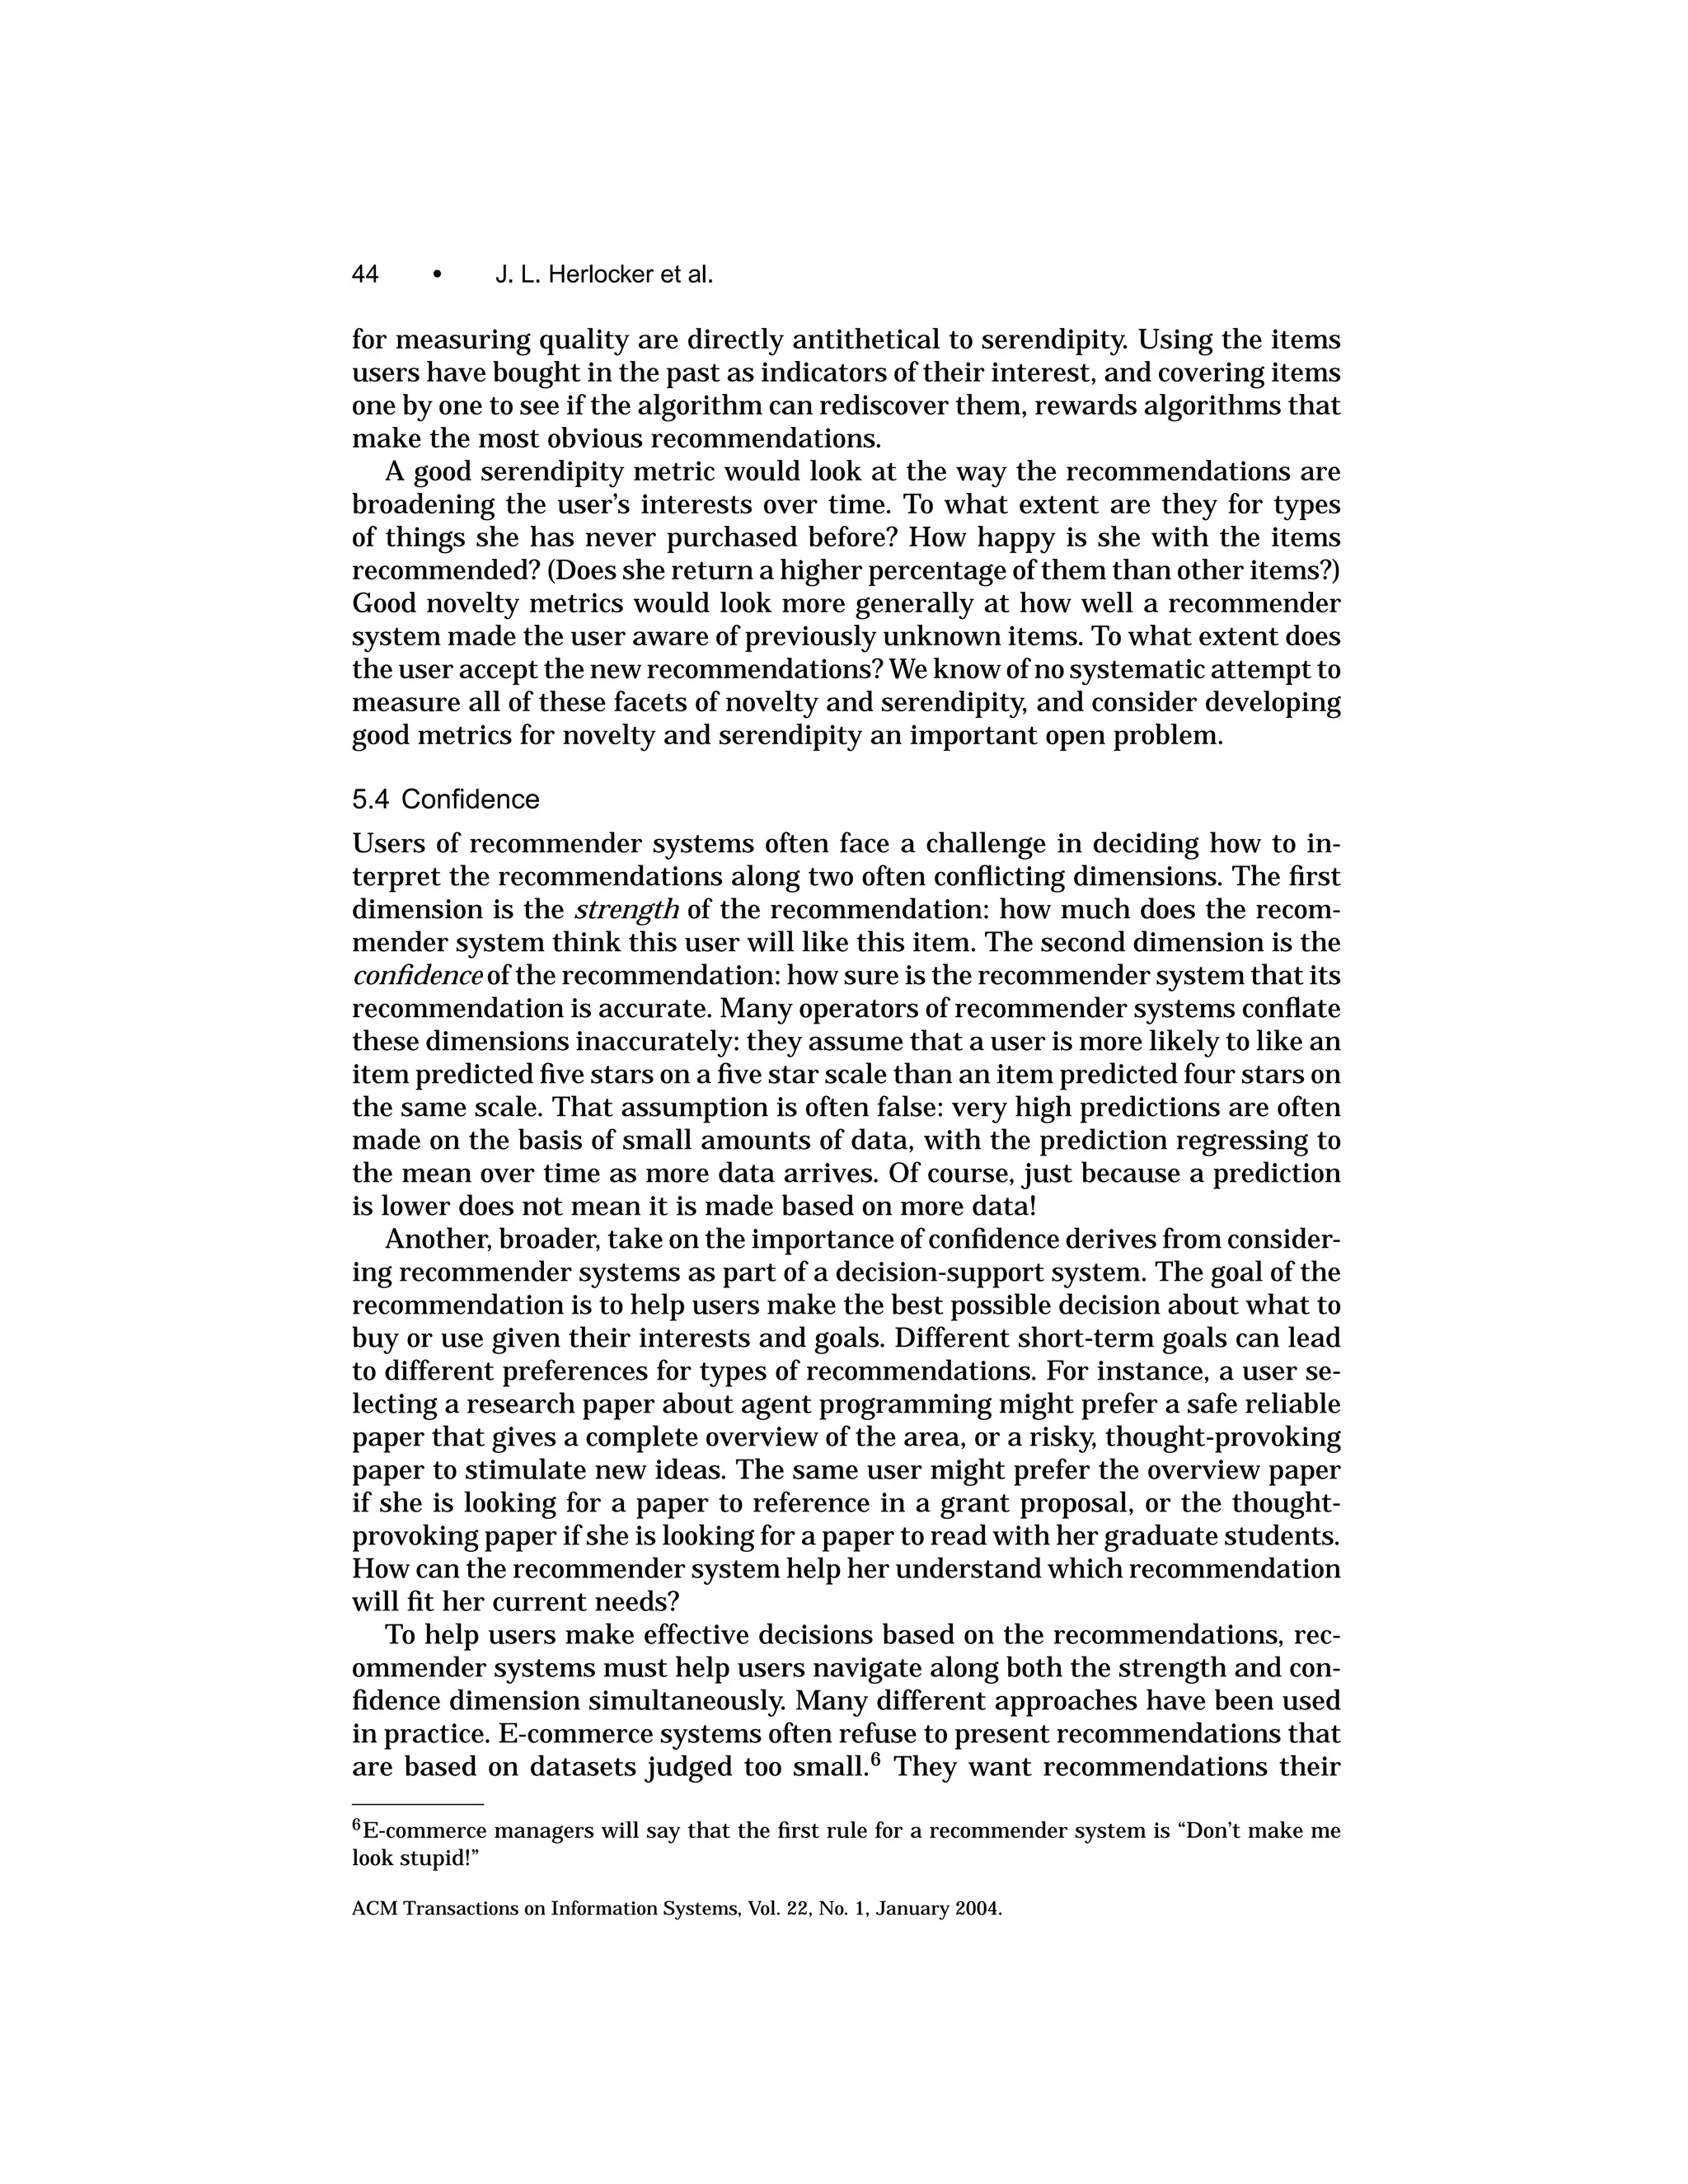
![Evaluating Collaborative Filtering Recommender Systems • 45
customers can rely on. The Movie Critic system provided explicit confidence vi-
sualization with each recommendation: a target with an arrow in it. The closer
the arrow was to the center, the more confident the recommendation. Herlocker
et al. [2000] explored a wide range of different confidence displays, to study
which ones influenced users to make the right decision. The study found that
the choice of confidence display made a significant difference in users’ decision-
making. The best confidence displays were much better than no display. The
worst displays actually worsened decision-making versus simply not displaying
confidence at all.
Measuring the quality of confidence in a system is difficult, since confidence
is itself a complex multidimensional phenomenon that does not lend itself
to simple one-dimensional metrics. However, recommenders that do not in-
clude some measure of confidence are likely to lead to poorer decision-making
by users than systems that do include confidence. If the confidence display
shows users a quantitative or qualitative probability of how accurate the rec-
ommendation will be, the confidence can be tested against actual recommen-
dations made to users. How much more accurate are the recommendations
made with high confidence than those made with lower confidence? If the con-
fidence display is directly supporting decisions, measuring the quality of the
decisions made may be the best way to measure confidence. How much better
is decision-making when users are shown a measure of confidence than when
not?
5.5 User Evaluation
The metrics that we have discussed so far involve measuring variables that we
believe will affect the utility of a recommender system to the user and affect the
reaction of the user to the system. In this section, we face the question of how
to directly evaluate user “reaction” to a recommender system. The full space
of user evaluation is considerably more complex than the space of the previ-
ously discussed metrics, so rather than examining specific metrics in detail, we
broadly review the user evaluation space and past work in user evaluation of
recommender systems. In order to better understand the space of user evalu-
ation methods, we begin by proposing a set of evaluation dimensions. We use
these dimensions to organize our discussion of prior work, showing the types
of knowledge that can be gained through use of different methods. We close by
summarizing what we consider the best current practices for user evaluations
of recommender systems.
Dimensions for User Evaluation
— Explicit (ask) vs. implicit (observe). A basic distinction is between evalua-
tions that explicitly ask users about their reactions to a system and those
that implicitly observe user behavior. The first type of evaluation typically
employs survey and interview methods. The second type usually consists of
logging user behavior, then subjecting it to various sorts of analyses.
—Laboratory studies vs. field studies. Lab studies allow focused investigation
of specific issues; they are good for testing well-defined hypotheses under
ACM Transactions on Information Systems, Vol. 22, No. 1, January 2004.](https://image.slidesharecdn.com/evaluatingcollaborativefilteringrecommendersystems-2004r-091212144717-phpapp02/75/Evaluating-Collaborative-Filtering-Recommender-Systems-41-2048.jpg)
![46 • J. L. Herlocker et al.
controlled conditions. Field studies can reveal what users actually do in their
own real contexts, showing common uses and usage patterns, problems and
unmet needs, and issues that investigators may not have thought of to con-
sider in a lab study. In particular, tasks such as Evaluate Recommender and
Express Self may require field studies because user behavior may be highly
context-sensitive.
— Outcome vs. process. For any task, appropriate metrics must be developed
that define what counts as a successful outcome [Newman 1997]. From a
systems perspective, accuracy may be the fundamental metric. From a user
perspective, however, metrics must be defined relative to their particular
tasks. For most tasks (such as Find Good Items) a successful outcome requires
users to act on the system’s recommendations, and actually purchase a book,
rent a movie, or download a paper. However, to simply measure whether a
goal is achieved is not sufficient. Systems may differ greatly in how efficiently
users may complete their tasks. Such process factors as amount of time and
effort required to complete basic tasks also must be measured to ensure that
the cost of a successful outcome does not outweigh the benefit.
— Short-term vs. long-term. Some issues may not become apparent in a short-
term study, particularly a lab study. For example, recall that Turpin and
Hersh found that subjects were able to perform information retrieval tasks
just as successfully with a less accurate search engine. However, if subjects
continually had to read more summaries and sift through more off-topic in-
formation, perhaps they would grow dissatisfied, get discouraged, and even-
tually stop using the system.
We consider several studies to illustrate the use of these methods. Studies
by Cosley et al. [2003], Swearingen and Sinha [2001], Herlocker et al. [2000],
and McDonald [2001] occupy roughly the same portion of the evaluation space.
They are short-term lab studies that explicitly gather information from users.
They all do some study of both task and process, although this dimension was
not an explicit part of their analysis. Amento et al. [1999, 2003] also did a
short-term lab study, but it gathered both implicit and explicit user information
and explicitly measured both task outcomes and process. Finally, Dahlen et al.
[1998] did a lab study that used offline analysis to “replay” the history of user
interactions, defining and measuring implicit metrics of user participation over
the long term.
Most recommender systems include predicted user ratings with the items
they recommend. Cosley et al. [2003] conducted a lab study to investigate how
these predicted ratings influence the actual ratings that users enter. They pre-
sented subjects with sets of movies they had rated in the past; in some cases,
the predictions were identical to the subjects’ past ratings, in some cases, they
were higher, and in some they were lower. Cosley et al. found that the predicted
ratings did influence user ratings, causing a small, but significant bias in the
direction of the prediction. They also found that presenting inaccurate predic-
tions reduced user satisfaction with the system. Thus, the methods used in this
study yielded some evidence that users are sensitive to the predictive accuracy
of the recommendations they receive.
ACM Transactions on Information Systems, Vol. 22, No. 1, January 2004.](https://image.slidesharecdn.com/evaluatingcollaborativefilteringrecommendersystems-2004r-091212144717-phpapp02/75/Evaluating-Collaborative-Filtering-Recommender-Systems-42-2048.jpg)
![Evaluating Collaborative Filtering Recommender Systems • 47
Swearingen and Sinha [2002, 2001] carried out a study to investigate the
perceived usefulness and usability of recommender systems. Subjects used
either three movie recommenders or three book recommenders. They began
by rating enough items for the system to be able to compute recommenda-
tions for them. They then looked through the recommendations, rating each
one as useful and/or new, until they found at least one item they judged
worth trying. Finally, they completed surveys and were interviewed by the
experimenters.
The methods used in this experiment let the researchers uncover issues other
than prediction accuracy that affected user satisfaction. For example, users
must develop trust in a recommender system, and recommendations of famil-
iar items supports this process. Explanations of why an item was recommended
also helped users gain confidence in a system’s recommendations. Users also
face the problem of evaluating a system’s recommendations—for example, a
movie title alone is insufficient to convince someone to go see it. Thus, the
availability and quality of “supporting information” a system provided—for ex-
ample, synopses, reviews, videos or sound samples—was a significant factor in
predicting how useful users rated the system. A final point shows that user
reactions may have multiple aspects—satisfaction alone may be insufficient.
For example, subjects liked Amazon more than MediaUnbound and were more
willing to purchase from Amazon. However, MediaUnbound was rated as more
useful, most likely to be used again, and as best understanding user tastes.
Further analysis showed that Amazon’s greater use of familiar recommenda-
tions may be the cause of this difference. The general point, however, is that for
some purposes, users prefer one system, and for other purposes, the other.
Herlocker et al. [2000] carried out an in-depth exploration of explanations
for recommender systems. After developing a conceptual model of the factors
that could be used to generate an explanation, they empirically tested a num-
ber of different explanation types. They used traditional usability evaluation
methods, discovering that users preferred explanations based on how a user’s
neighbors rated an item, the past performance of the recommender system, sim-
ilarity of an item to other items the user rated highly, and the appearance of a
favorite actor or actress. Specifically, they led users to increase their estimate
of the probability that they would see a recommended movie.
McDonald [2001] conducted a controlled study of his Expertise Recommender
system. This system was developed within a particular organizational context,
and could suggest experts who were likely to be able to solve a particular prob-
lem and who were “socially close” to the person seeking help. The notable feature
of McDonald’s study was that subjects were given a rich scenario for evaluating
recommendations, which specified a general topic area and a specific problem.
In other words, the study was explicit in attempting to situate users in a task
context that would lead them to evaluate the recommendations within that
context.
Amento et al. [1999, 2003] evaluated their “topic management” system, which
lets users explore, evaluate, and organize collections of websites. They compared
their system to a Yahoo-style interface. They gathered independent expert rat-
ings to serve as a site quality metric and used these ratings to define the task
ACM Transactions on Information Systems, Vol. 22, No. 1, January 2004.](https://image.slidesharecdn.com/evaluatingcollaborativefilteringrecommendersystems-2004r-091212144717-phpapp02/75/Evaluating-Collaborative-Filtering-Recommender-Systems-43-2048.jpg)
![48 • J. L. Herlocker et al.
outcome metric as the number of high-quality sites subjects selected using each
system. In addition, they measured task time and various effort metrics, such
as the number of sites subjects browsed. Thus, a key feature of their methods
was they were able to measure outcomes and process together; they found that
users of their system achieved superior results with less time and effort. Appro-
priate metrics will vary between tasks and domains; however, often effort can
be conceived in terms of the number of queries issued or the number of items
for which detailed information is examined during the process of evaluating
recommendations.
Dahlen et al. [1998] studied the value of jump-starting a recommender sys-
tem by including “dead data”—that is, ratings from users of another, inactive
system. Their experimental procedure involved “replaying” the history of both
systems, letting them evaluate the early experience of users in terms of their
participation. This was the only course of action open, since it was impossible to
survey users of the previous system. They found that early users of the “jump-
started” system participated more extensively—they used the system more of-
ten, at shorter intervals, and over a long period of time, and they also entered
more ratings. We believe that, in general, user contribution to and participa-
tion in recommender systems in the long term is quite important and relatively
under-appreciated. And we believe that the metrics used in the jumpstarting
study can be applied quite broadly.
To summarize our observations on user evaluation, we emphasize that accu-
rate recommendations alone do not guarantee users of recommender systems
an effective and satisfying experience. Instead, systems are useful to the ex-
tent that they help users complete their tasks. A fundamental point proceeds
from this basis: to do an effective user evaluation of a recommender system,
researchers must clearly define the tasks the system is intended to support.7
Observations of actual use (if available) and interviews with (actual or prospec-
tive) users are appropriate techniques, since it often is the case that systems
end up being used differently than the designers anticipated. Once tasks are
defined, they can be used in several ways. First, they can be used to tailor algo-
rithm performance. Second, clearly defined tasks can increase the effectiveness
of lab studies. Subjects can be assigned a set of tasks to complete, and various
algorithms or interfaces can be tested to find out which ones lead to the best
task outcomes.
We also recommend that evaluations combine explicit and implicit data col-
lection whenever possible. This is important because user preferences and per-
formance may diverge: users may prefer one system to another, even when their
performance is the same on both, or vice versa. One advantage of gathering data
about both performance and preferences is that the two can be correlated. (This
is analogous to work on correlating implicit and explicit ratings [Claypool et al.
2001, Morita and Shinoda 1994]) Having done this, future evaluations that can
gather only one of these types of data can have some estimate of what the other
type of data would show.
7 Whittaker et al. [2000] elaborate on this theme to develop a research agenda for Human-Computer
Interaction centered around the notion of “reference tasks”.
ACM Transactions on Information Systems, Vol. 22, No. 1, January 2004.](https://image.slidesharecdn.com/evaluatingcollaborativefilteringrecommendersystems-2004r-091212144717-phpapp02/75/Evaluating-Collaborative-Filtering-Recommender-Systems-44-2048.jpg)
![Evaluating Collaborative Filtering Recommender Systems • 49
6. CONCLUSION
Effective and meaningful evaluation of recommender systems is challenging.
To date, there has been no published attempt to synthesize what is known
about the evaluation of recommender systems, nor to systematically under-
stand the implications of evaluating recommender systems for different tasks
and different contexts. In this article, we have attempted to overview the fac-
tors that have been considered in evaluations as well as introduced new factors
that we believe should be considered in evaluation. In addition, we have intro-
duced empirical results on accuracy metrics that provide some initial insight
into how results from different evaluation metrics might vary. Our hope is that
this article will increase the awareness of potential biases in reported evalu-
ations, increase the diversity of evaluation dimensions examined where it is
necessary, and encourage the development of more standardized methods of
evaluation.
6.1 Future Work
While there are many open research problems in recommender systems, we
find four evaluation-related problems to be particularly worthy of attention.
User Sensitivity to Algorithm Accuracy. We know from recent work by
Cosley et al. [2003] that user satisfaction is decreased when a significant level of
error is introduced into a recommender system. The level of error introduced in
that study, however, was many times larger than the differences between the
best algorithms. Key questions deserving attention include: (a) For different
metrics, what is the level of change needed before users notice or user behav-
ior changes? (b) To which metrics are users most sensitive? (c) How does user
sensitivity to accuracy depend on other factors such as the interface? (d) How
do factors such as coverage and serendipity affect user satisfaction? If these
questions are answered, it may be possible to build a predictive model of user
satisfaction that would permit more extensive offline evaluation.
Algorithmic Consistency Across Domains. While a few studies have looked
at multiple datasets, no researchers have systematically compared a set of
algorithms across a variety of different domains to understand the extent to
which different domains are better served by different classes of algorithms.
If such research did not find differences, it would simplify the evaluation of
algorithms—system designers could select a dataset with the desired properties
without needing domain-specific testing.
Comprehensive Quality Measures. Most metrics to date focus on accuracy,
and ignore issues such as serendipity and coverage. There are well-known tech-
niques by which algorithms can trade-off reduced serendipity and coverage for
improved accuracy (such as only recommending items for which there are many
ratings). Since users value all three attributes in many applications, these algo-
rithms may be more accurate, but less useful. We need comprehensive quality
measures that combine accuracy with other serendipity and coverage, so algo-
rithm designers can make sensible trade-offs to serve users better.
ACM Transactions on Information Systems, Vol. 22, No. 1, January 2004.](https://image.slidesharecdn.com/evaluatingcollaborativefilteringrecommendersystems-2004r-091212144717-phpapp02/75/Evaluating-Collaborative-Filtering-Recommender-Systems-45-2048.jpg)


![Desarrollo de exploit para infraestructura crítica [GuadalajaraCON 2013]](https://cdn.slidesharecdn.com/ss_thumbnails/infraestructuracriticas-130429104519-phpapp02-thumbnail.jpg?width=640&height=640&fit=bounds)


