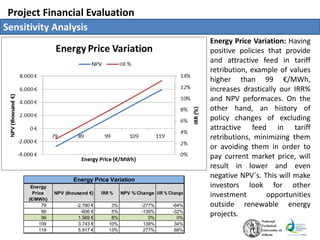
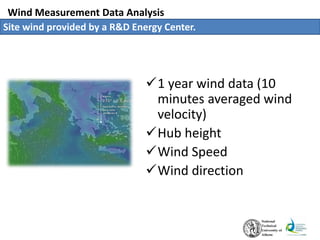
- A wind farm study analyzed 1 year of wind data from a site including average wind speed, direction, and other parameters.
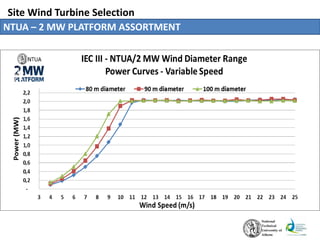
- Based on the data, a 100m diameter 2MW wind turbine was selected as the optimal design with the lowest LCOE and highest annual energy output.
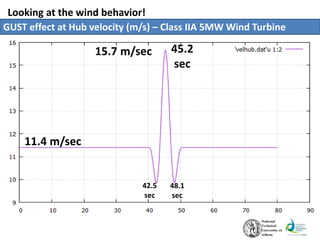
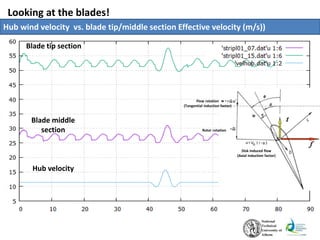
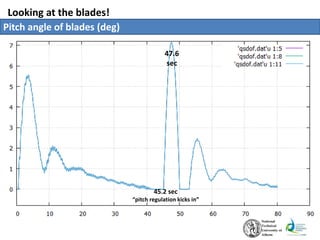
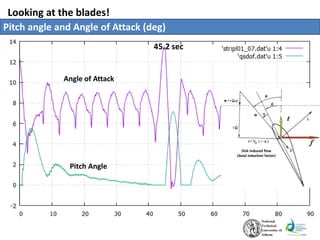
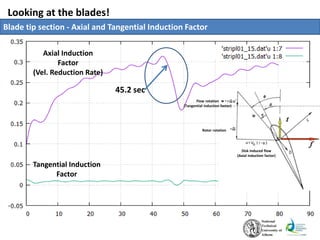
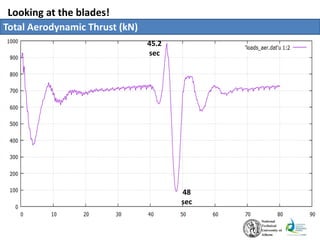
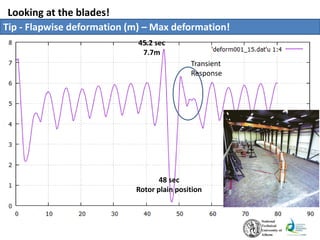
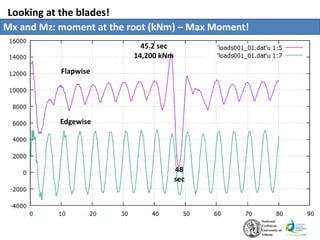
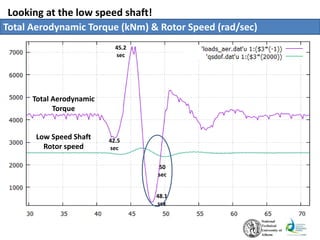
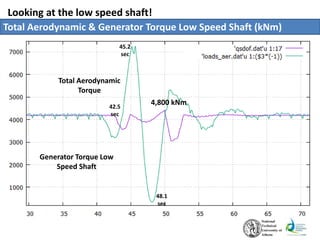
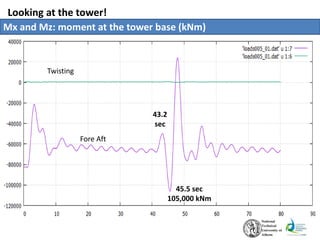
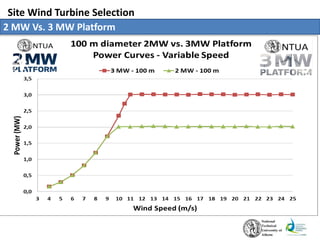
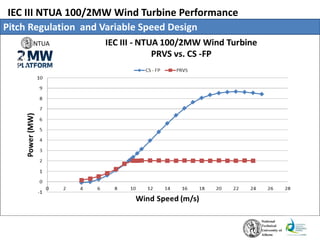
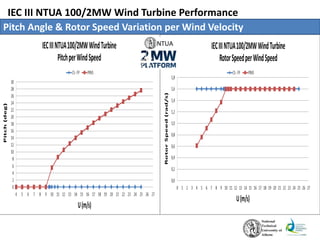
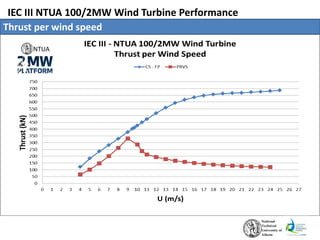
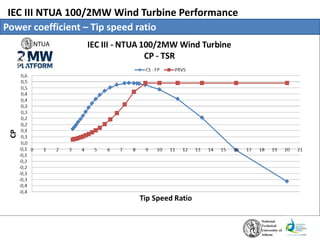
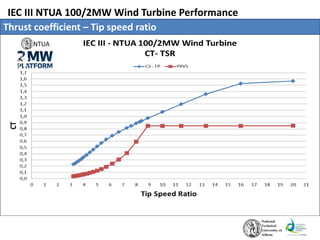
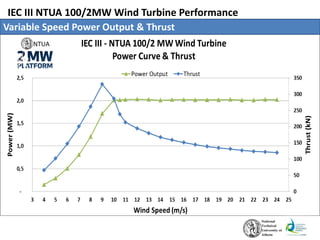
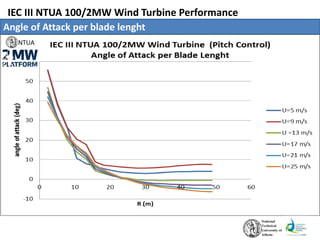
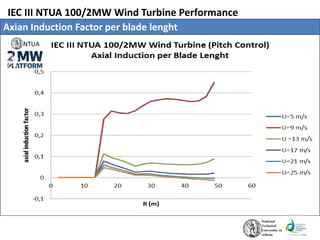
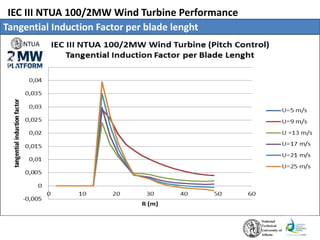
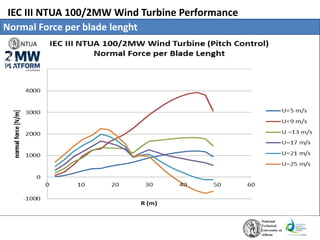
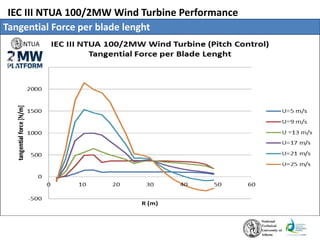
- Performance simulations were conducted on the turbine, showing how its pitch, speed, power, and forces vary with wind speed.
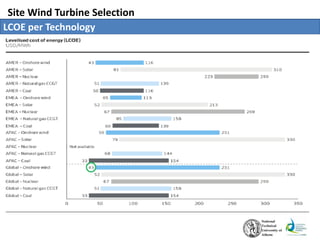
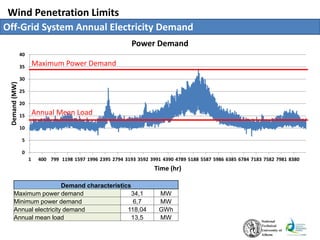
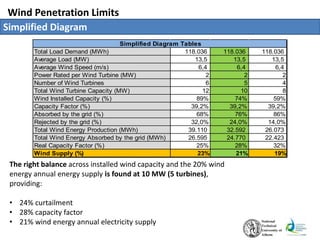
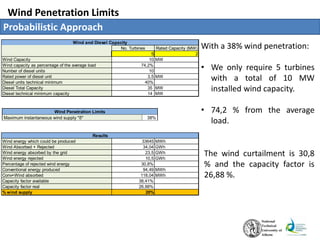
- For integrating wind power onto the existing grid, the maximum penetration was found to be 10MW of wind (5 turbines), providing around 20% of annual electricity with 30.8% curtailment and a 26.88% capacity factor.

![Wind Measurement Data Analysis
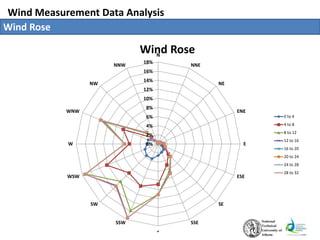
Avg. Probability and Wind Speed Roses.
0%
5%
10%
15%
20%
N
NNE
NE
ENE
E
ESE
SE
SSE
S
SSW
SW
WS
W
W
WN
W
NW
NN
W
Avg. Probability
-
2,0
4,0
6,0
8,0
N
NNE
NE
ENE
E
ESE
SE
SSE
S
SSW
SW
WSW
W
WNW
NW
NNW
Avg. Wind Speed
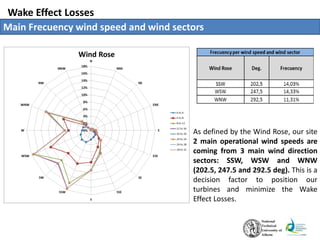
• WNW - S = 80 % from Operational Time!
• NW – WNW = Strongest AWS (7.2 m/s)
• WSW – SSW = Highest Operational Demand! (6.8 m/s)
Wind Rose Parameters
No. Wind Segments 16
Total angle [°] 360
Angle/direction [°] 22,5
First Segment Angle [°] 348,75
Uave [m/s] 6,41
Std.Dev 3,35](https://image.slidesharecdn.com/c9128ba6-02f0-4c32-a61f-44f8294e6eb0-160802211811/85/EUREC-NTUA-Projects-Carlos-Silva-4-320.jpg)
![-
1
2
3
4
5
6
7
8
9
WindSpeed[m/s]
Month
Mean monthly wind speed variation
Wind Measurement Data Analysis
Mean monthly wind speed variation.
Month Uave [m/s]
January 7,33
February 7,52
March 6,18
April 5,40
May 6,58
June 6,51
July 6,99
August 8,23
September 5,38
October 6,13
November 6,39
December 4,23
Total
Uave 6,41](https://image.slidesharecdn.com/c9128ba6-02f0-4c32-a61f-44f8294e6eb0-160802211811/85/EUREC-NTUA-Projects-Carlos-Silva-6-320.jpg)
![Wind Measurement Data Analysis
Weibull Semi-Empirical, Least Square Fit method and Bins Probability
Bowden Semi-Empirical
Shape Factor K 2,02
Scale Factor C 7,23
Uave [m/s] 6,41
Least Square
Shape Factor K 1,85
Scale Factor C 7,52
Uave [m/s] 6,67
Semi Empirical
Least Square
0%
2%
4%
6%
8%
10%
12%
14%
0 2 4 6 8 10 12 14 16 18 20 22 24 26 28
Probability%
Wind Speed m/s
Weibull Distribution Comparison
Bowden Semi-Empirical Probability per bins Least Square](https://image.slidesharecdn.com/c9128ba6-02f0-4c32-a61f-44f8294e6eb0-160802211811/85/EUREC-NTUA-Projects-Carlos-Silva-8-320.jpg)
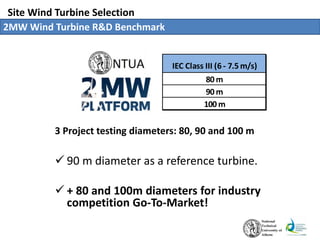
![Site Wind Turbine Selection
2MW Wind Turbine R&D Benchmark
Test Turbine Selection
Vave [m/s] 6,4
Hub Height [m] 90
Diameter [m] 90
Vmax[m/s] 32
Reference cost for the test turbine (€/kW) 950
TEST TURBINE
DESIGN CHARACTERISTICS
Power (kW) 2000
Diameter (m) 90,0
Max Tip Speed (m/s) 80,0
Drive Train Efficiency 94,00%
Omega Rotor max (rad/s) 1,78
RPM Rotor max 16,98
Rated Rotor Torque (kNm) 1197
x = 1,50
COMPONENTS MASS & COST
MASS (kg) COST (euro)
Three Blades 19.677 255.801
Gearbox 10.308 123.690
Generator 5.550 80.478
Cost of blades, Gearbox, Generator 459.969
Rest cost of drive train (nacelle, power electronics, pitch etc)459.969
Subtotal drive train 919.938
980.062
Total cost of wind turbine 1.900.000
Share of BL, GB, Gen in the total WT cost 24,2%
Cost of the hub
90 m diameter as a
reference turbine!
Class III Wind Turbine!
ave refV 0.2V](https://image.slidesharecdn.com/c9128ba6-02f0-4c32-a61f-44f8294e6eb0-160802211811/85/EUREC-NTUA-Projects-Carlos-Silva-10-320.jpg)
![Site Wind Turbine Selection and Power Curves
What the competition has available for IEC III 2 MW Wind Turbines?
Project Wind Data
Vave [m/s] 6,41
C 7,23
Std.Dev 3,4
K 2,021](https://image.slidesharecdn.com/c9128ba6-02f0-4c32-a61f-44f8294e6eb0-160802211811/85/EUREC-NTUA-Projects-Carlos-Silva-11-320.jpg)
![Site Wind Turbine Selection
LCOE per 2 MW Product Range Diameters
Lowest LCOE !
Highest Annual Energy Output !
39,2 % Capacity Factor!
+14 % Wind Turbine Cost vs. 90m diameter!
Selection of our IEC III- NTUA/2MW 100 m diameter & tower height wind turbine:
WIN – WIN
SOLUTION!!!!!
80 90 100 100 Vs. 80 100 Vs. 90
Avg. Wind Speed [m/s] 6,41 6,41 6,41
Avg. Power Output [kW] 592 697 783 32% 12%
Avg. Power Output per RA[kW/m^2] 0,03 0,03 0,02 -15% -9%
Annual Energy Output [GWh] 4,93 5,80 6,52 32% 12%
Capacity Factor (%) 29,6% 34,8% 39,2% 32% 12%
LCOE [€/kWh] 0,064 0,060 0,058 -9% -3%
LCOE [€/MWh] 63,86 59,56 57,93 -9% -3%
Wind Turbine Cost [€] 1.638.360 1.900.000 2.174.272 33% 14%
Wind Turbine Project Indicators
Wind Turbine Diameters 100 m diameter performace
2 MW Wind Turbines Range](https://image.slidesharecdn.com/c9128ba6-02f0-4c32-a61f-44f8294e6eb0-160802211811/85/EUREC-NTUA-Projects-Carlos-Silva-14-320.jpg)
![Site Wind Turbine Selection
3 MW Platform LCOE
X More Expensive LCOE vs 2 MW!
18% Higher Annual Energy Output vs. 2MW platform!
X 30,7 % Capacity Factor!
+17 % Wind Turbine Cost vs. 2 MW platform!
What happens If we upscale the wind turbine to a 3 MW platform!
2 MW 3 MW Difference
100 100 100 Vs. 80
Avg. Wind Speed [m/s] 6,41 6,41
Avg. Power Output [kW] 783 922 18%
Avg. Power Output per RA[kW/m^2] 0,02 0,03 18%
Annual Energy Output [GWh] 6,52 7,67 18%
Capacity Factor (%) 39,2% 30,7% -22%
LCOE [€/kWh] 0,058 0,063 9%
LCOE [€/MWh] 57,93 62,85 9%
Wind Turbine Cost [€] 2.174.272 2.543.076 17%
Wind Turbine Project Indicators
100 m diameter 2MW vs. 3MW Platform](https://image.slidesharecdn.com/c9128ba6-02f0-4c32-a61f-44f8294e6eb0-160802211811/85/EUREC-NTUA-Projects-Carlos-Silva-17-320.jpg)
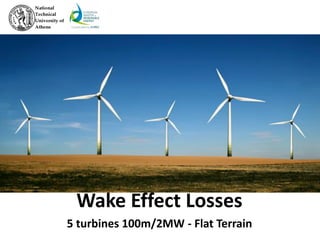
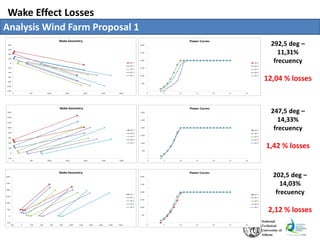
![Wake Effect Losses
Analysis Wind Farm Proposal 1
6.195
5.717
7,71%
Wind Farm Losses
Wind Energy Production [MWh]
Wind Energy Production with Wake Effect [MWh]
Wake Losses
The first project proposal is arranged in order to take the biggest advantage of the SSW and
WSW wind rose directions, the 2 biggest main sectors.](https://image.slidesharecdn.com/c9128ba6-02f0-4c32-a61f-44f8294e6eb0-160802211811/85/EUREC-NTUA-Projects-Carlos-Silva-41-320.jpg)
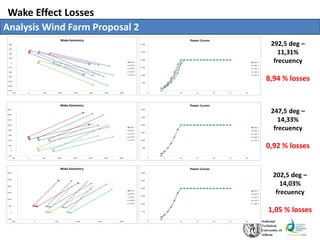
![Wake Effect Losses
Analysis Wind Farm Proposal 2
6.195
5.792
6,51%
Wind Farm Losses
Wind Energy Production [MWh]
Wind Energy Production with Wake Effect [MWh]
Wake Losses
The aim from the second project proposal is to look for a wind turbine arrangement able to
reduce more drastically the losses generated by the 292,5 deg wind direction and the
separation of wind turbines to have an even cleaner wind segments at the 2 main wind
directions 247,5 and 202,5 deg.](https://image.slidesharecdn.com/c9128ba6-02f0-4c32-a61f-44f8294e6eb0-160802211811/85/EUREC-NTUA-Projects-Carlos-Silva-43-320.jpg)
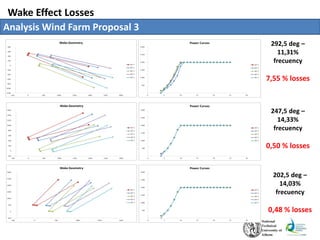
![Wake Effect Losses
Analysis Wind Farm Proposal 3
6.195
5.819
6,07%
Wind Farm Losses
Wind Energy Production [MWh]
Wind Energy Production with Wake Effect [MWh]
Wake Losses
For the final proposal, witch is the project selection, the aim was to find the proper
separation across turbines from the wind direction 292,5 deg that wont harm negatively the
wind turbiness efficiency from the 247,5 and 202,5 deg wind sectors.](https://image.slidesharecdn.com/c9128ba6-02f0-4c32-a61f-44f8294e6eb0-160802211811/85/EUREC-NTUA-Projects-Carlos-Silva-45-320.jpg)