Download as PDF, PPTX

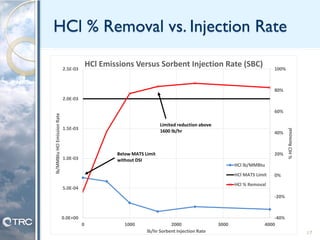
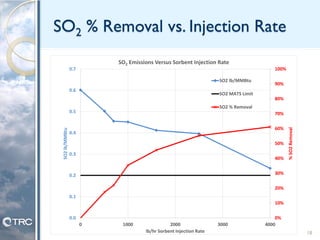
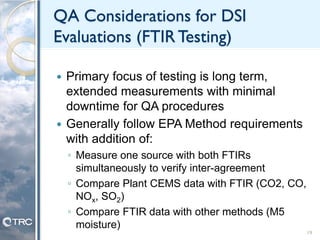
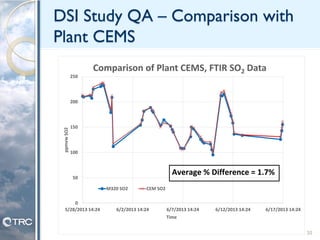
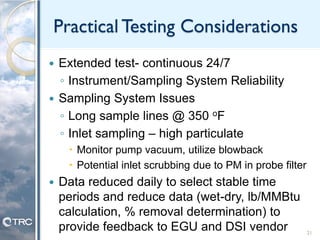
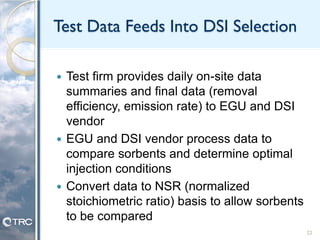
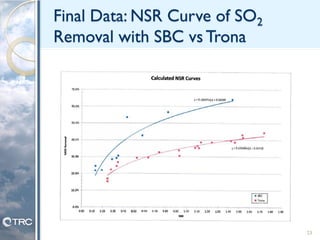


The document discusses the evaluation of dry sorbent injection (DSI) technologies for controlling emissions of sulfur dioxide, acid gases, and mercury in utilities. It emphasizes the need for accurate real-time data on removal efficiency, considering various factors such as sorbent type, injection rate, and testing methods. The paper highlights the importance of advanced stack testing techniques, like FTIR, to provide reliable data for optimal DSI performance.


