Downloaded 11 times


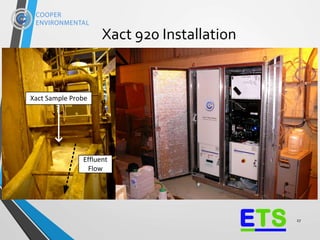
![Laboratory Results – Accuracy in High
TDS
23
[As]Meas = 50.8±4 ng/g (1, N= 435); [As]actual = 52.5±0.3 ng/g; RPE = 3.2 ± 0.2%
TDS=1,619 ppm (1.6 mg/g, 0.16% w/w)
CaSO4
0
10
20
30
40
50
60
70
10/20:00
10/212:00
10/30:00
10/312:00
10/40:00
10/412:00
10/50:00
10/512:00
10/60:00
10/612:00
10/70:00
10/712:00
10/80:00
10/812:00
10/90:00
10/912:00
10/100:00
10/1012:00
10/110:00
10/1112:00
10/120:00
10/1212:00
10/130:00
MeasuredConcentration(ng/g)
Actual As (ppb)
Measured As (ppb)
30
MINUTE
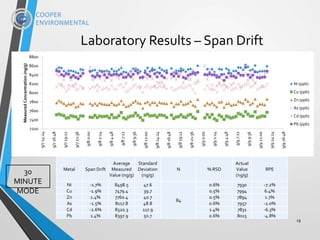
MODE Results show good stability at higherTDS
For Umicore: levels ofTDS are low enough to not be an issue](https://image.slidesharecdn.com/powerplantwatertreatmentxact920-181003143354/85/XRF-Based-Multi-Metals-Continuous-Water-Analyzer-23-320.jpg)
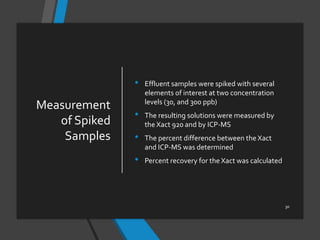
![24
Laboratory Results – Accuracy in
HighTDS
[Pb]Meas = 92.8±6.8 ng/g (1, N= 435); [Pb]actual = 96.2±0.3 ng/g; RPE = 3.5 ± 0.3%
0
20
40
60
80
100
120
10/20:00
10/212:00
10/30:00
10/312:00
10/40:00
10/412:00
10/50:00
10/512:00
10/60:00
10/612:00
10/70:00
10/712:00
10/80:00
10/812:00
10/90:00
10/912:00
10/100:00
10/1012:00
10/110:00
10/1112:00
10/120:00
10/1212:00
10/130:00
MeasuredConcentration(ng/g)
Actual Pb (ppb)
Measured Pb (ppb)
TDS=1,619 ppm (1.6 mg/g, 0.16% w/w) CaSO4
30
MINUTE
MODE
For Umicore: levels ofTDS are low enough to not be an issue](https://image.slidesharecdn.com/powerplantwatertreatmentxact920-181003143354/85/XRF-Based-Multi-Metals-Continuous-Water-Analyzer-24-320.jpg)


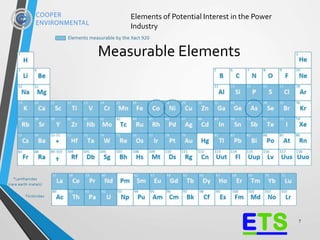
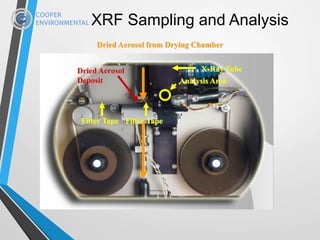
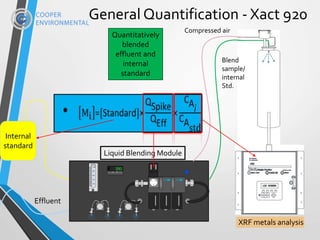
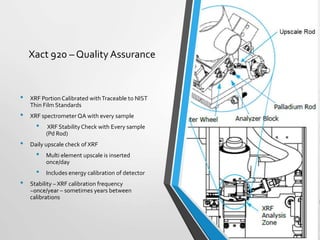
The document presents the xact 920, an XRF-based multi-metals continuous water analyzer designed for real-time monitoring in various water treatment applications, particularly within the power industry. It highlights the analyzer's capabilities, including its ability to measure up to 65 elements simultaneously and its non-destructive, stable, and cost-effective features for compliance and process efficiency. Field tests demonstrate the instrument's accuracy and reliability over extended periods, validating its application in diverse environments such as nuclear power plants and metal melting facilities.


