SlideShare a Scribd company logo
Online Monitoring of Wastewater in Common Effluent Treatment Plant
1. Introduction
Monitoring of wastewater parameters in a Common Effluent
Treatment Plant is a challenging task due to intake of wastes, having
diverse properties & composition, from various industries. Hence it is
difficult to set boundary conditions on the measurement. UV/VIS
spectroscopy is an efficient method for continuous monitoring. This
method is based on Beer-Lambert’s absorption law;
A= Ɛbc
Where, ‘A’ is absorbance (no units, since A = log10 P0 / P)
‘Ɛ’ is the molar absorbtivity with units of L mol-1 cm-1
‘b’ is the path length of the sample - that is, the path length of the
cuvette in which the sample is contained.
‘c’ is the concentration of the compound in solution, expressed in mol
L-1.
Correlations between absorption and equivalent concentrations are
calculated using Multivariate Linear Regression Analysis. These
correlations if calculated for limited effluent matrices, environmental
conditions & industrial operations will be insignificant to establish
correct correlation as it does not allow understanding & evaluating
complete dynamics & variability of different parameter
concentrations. Hence, it is important to collect most of the
wastewater information in the training set for the analyzer. Accuracy
of the measurement showcases the efficacy & reliability of Real
Spectrum Analyzer for application in Common Effluent Treatment
Plants
2. Materials & Methods
Apparatus
An extraction based UV-VIS Spectrometer has been used for
measurement of COD, BOD & TSS in PRIA Common Effluent
Treatment Plant, Patalganga, Maharashtra. The spectrometer
analyzes the sample over complete UV-VIS spectrum (200 – 750
nm), wavelengths being configurable on field, with sample cell path
length as 2mm. Deuterium & Tungsten light sources are used for
generation of ultraviolet & visible light, respectively. Deuterium light
source is quite resistant to stray light for interfering with the
measurements. The sensor uses just one photodiode for
measurement regardless of how many wavelengths are used. For
multiple & full spectrum scanning, a diffraction grating is rotated
through the desired measurement wavelengths one at a time. The
use of single sensor design allows the realization of several optical
measurement improvements & achieves a wavelength resolution
down to 1nm.
The Real Spectrum Analyzer works on innovative Split-Sense Pro
technology. It is designed to take measurement readings through
water sample & reference readings through air. By continuously
moving the sample cell from the test position between the lamp &
sensor and outwards to allow for a reference reading, lamp readings
are inherently compensated for by the measurement process itself,
therefore improving accuracy.
An automatic pump/clean system is used for sample extraction &
analyzer cleansing process; it is advantageous over other pumping
systems as the effluent matrix remains unaffected to a large extend
& it can be used to cleanse the sample lines in the reverse direction
also for any blockages. However, peristaltic pumps are limited to a
maximum vertical lift of about 10-12 ft.
The system utilizes automatic chemical cleaning technique to
cleanse the sample cell & sample tubing, therefore enables choice of
various cleaning fluids suitable for different industrial applications
based on their wastewater composition. The cleaning mechanism is
initiated on user-configured frequency besides a manual trigger.
Software Platform
envirologicIQ is a cloud based remote monitoring software platform onto
which data from field devices is collected. envirologicIQ enables real-time
monitoring & reporting of the data. Smart GPRS/LAN based Cloud
connector is used to capture data from field devices.
Intelligent alarm rules can be set for the field devices based on parameter
readings enabling the user to take preventive measures to ensure proper
observance of regulations.
User management is well defined in the software so that authority is
properly distributed among various stakeholders, besides proper
maintenance of audit logs.
Device management & diagnostics are built in the software for calibration,
diagnosis & authentication of devices. Automatic alerts are generated in
case devices are not working properly.
Calibration
Two calibration methods exist for online analyzers, viz., Global Calibration
& Local Calibration. Global calibration is the default calibration that is
provided by the manufacturer from a similar plant type to get some
readings in the beginning just after the installation. Global Calibrations do
not have relevant weightage in measurement accuracy due to different
composition of wastewaters. Even similar types of industry/plant may have
significant difference in their effluents due various factors like weather
conditions, industrial processes, etc. Therefore, Global calibrations only
give a rough correlation between measured absorption and parameters of
interest.
The local calibration is able to account for specific wastewater compositions
and possible matrix effects. Provisioning to acquire sample data points over
vast operational & environmental conditions, local calibration enhances
measurement quality & accuracy.
Real Spectrum Analyzer is calibrated using Local Calibration procedure.
For this purpose wastewater samples are physically collected from the
plant & different parameters are determined by laboratory analysis using
standard methods & procedures. For the case-study under discussion,
eight samples were collected over a period of 5 days, (Table1) to get a
training set for establishing best correlations for equivalent parameter
measurements. On completion of laboratory analysis of samples, UVA data
from the analyzer is downloaded onto an external storage device.
Online Monitoring of Wastewater in Common Effluent Treatment Plant
Spectra of measured absorbencies is correlated to laboratory results
to achieve a correlation matrices for different parameters (COD,
TSS, etc.) using statistical regression models expressed as;
𝐶𝑒𝑞 = ∑ (𝜆𝑛
𝑖=1 𝑖. 𝐴𝑖) + K
with ‘n’ the number of used wavelength ‘λi’ depending on the
measuring system (for the case under study, n=390). The weighing
factors ‘Ai’ are determined after fitting to laboratory analysis. The
constant offset K can be used for the specific wastewater matrix
adjustment over all single wavelengths. Every calibration model
results from a compromise between generality and robustness.
Usually, particularities in calibration data can be better reproduced by
increasing the value of ‘n’. Therefore, minor deviations between
calculated equivalence values and laboratory values can be
determined.
3. Operational Experiences
After carrying out the local calibration, correlations were fed into the
system. The spectrometer worked absolutely fine for first two days of
operation. The results of spectrometer & laboratory analysis are
compared as in Table 2.
A tremendous overshoot in readings of different parameters
happened on 17th
July. A detailed site and instrument study was
carried out to find the reason for this abrupt change. Primary reason
was found to be the heavy rainfall that happened. Since the effluent
is collected in an open tank before pumping out, rains increased the
component of suspended solids. Second reason was the fouling of
flow cell that occurred due to unsuitable cleaning frequency set for
automatic cleaning. Frequency was set to 12 hour; however the
recommended cleaning frequency for a common effluent treatment
plant is 3 - 4 hours due to high concentration of fouling agents. Third
reason was found to be the improper working of oven in the laboratory that
consequently added to error in readings.
With another unit installed in a CETP at Ahmadabad, Gujarat we faced a
challenge for measuring TSS with visible spectrum method as the effluent
mainly consisted of wastes from pharmaceutical, textile and dye industries.
Therefore, sensor based on IR 90º Scattering principle was used to
measure the TSS accurately. Also, training set for the instrument needs to
cover vast operational changes for better accuracy of COD & BOD
measurements.
4. Results & Discussion
It is of high importance to investigate whole concentration range to get
reliable absorbance-concentration correlation for the system to produce
accurate results. Plot 1 shows laboratory concentration of Chemical
Oxygen Demand & its equivalent online reading.
After local calibration and adjustment work based on taken reference
laboratory samples, the deviations produced by Global calibration could
be reduced. Investigating whole concentration range to get reliable
absorbance-concentration correlation for the system is therefore important
if high accuracy of the spectrometer equivalent values is needed.
However, the dry wastewater matrix adjusted local calibrations does not
inevitably deliver reliable data during wet weather conditions due to the
different composition of wastewater.
For long-term effective operation, cleaning systems are necessary for the
spectrometer itself to prevent measurement drift due to accumulation of
waste material on the measurement optics and for the channel & tubing to
prevent sedimentation & blockages.
Plot 2. depicts the online & laboratory readings for Total Suspended
Solids.
The cited results demonstrate the practicability of UV/VIS analyzers for
online effluent monitoring as the equivalent concentrations for the
parameter COD and TSS measured by the UV/VIS spectrometer are
reliable & accurate.
COD TSS
1 23/06/15 12:05 PM 208 1000
2 24/06/15 11:05 AM 171 340
3 24/06/15 4:00 PM 191 100
4 25/06/15 12:20 PM 235 140
5 25/06/15 4:20 PM 205 960
6 26/06/15 4:15 PM 233 660
7 27/06/15 11:46 AM 541 960
8 27/06/15 3:50 PM 463 1080
Training Set
Table 1. Laboratory Reports for COD & TSS
(PRIA CETP, Patalganga,Maharashtra)
Sample Date
Parameters
Time

More Related Content

What's hot

COD-UV-SPECTROSCOPY-ANN-ANALYSIS
COD-UV-SPECTROSCOPY-ANN-ANALYSISCOD-UV-SPECTROSCOPY-ANN-ANALYSIS
COD-UV-SPECTROSCOPY-ANN-ANALYSIS
Kaushik Patra
 
Aavos international - process analysis
Aavos international - process analysisAavos international - process analysis
Aavos international - process analysis
European Tech Serv
 
Photonics for High-End Gas Analysis - Gasera Ltd.
Photonics for High-End Gas Analysis - Gasera Ltd.Photonics for High-End Gas Analysis - Gasera Ltd.
Photonics for High-End Gas Analysis - Gasera Ltd.
Gasera Ltd.
 
Improve Wastewater Treatment and Save Money with Process Monitoring | YSI IQ ...
Improve Wastewater Treatment and Save Money with Process Monitoring | YSI IQ ...Improve Wastewater Treatment and Save Money with Process Monitoring | YSI IQ ...
Improve Wastewater Treatment and Save Money with Process Monitoring | YSI IQ ...
Xylem Inc.
 
Ship Emissions Monitoring with Laser-Based Cantilever-Enhanced Photoacoustic ...
Ship Emissions Monitoring with Laser-Based Cantilever-Enhanced Photoacoustic ...Ship Emissions Monitoring with Laser-Based Cantilever-Enhanced Photoacoustic ...
Ship Emissions Monitoring with Laser-Based Cantilever-Enhanced Photoacoustic ...
Gasera Ltd.
 
Preview NOx_analysers
Preview NOx_analysersPreview NOx_analysers
Preview NOx_analysers
Santosh Sawant
 
Aavos international - process analysis
Aavos international - process analysisAavos international - process analysis
Aavos international - process analysis
European Tech Serv
 
Simultaneous Measurement of N2O and CH4 Emissions from Agriculture Using Phot...
Simultaneous Measurement of N2O and CH4 Emissions from Agriculture Using Phot...Simultaneous Measurement of N2O and CH4 Emissions from Agriculture Using Phot...
Simultaneous Measurement of N2O and CH4 Emissions from Agriculture Using Phot...
Gasera Ltd.
 
IEEE Sensor journal 2016 Title and Abstract
IEEE Sensor journal 2016 Title and AbstractIEEE Sensor journal 2016 Title and Abstract
IEEE Sensor journal 2016 Title and Abstract
tsysglobalsolutions
 
Measurement of Trace Hydrogen Fluoride in Clean Rooms and Ambient Air
Measurement of Trace Hydrogen Fluoride in Clean Rooms and Ambient AirMeasurement of Trace Hydrogen Fluoride in Clean Rooms and Ambient Air
Measurement of Trace Hydrogen Fluoride in Clean Rooms and Ambient Air
Gasera Ltd.
 
Analysis of Damaged Floor Coverings Emissions in Indoor Air Quality with Cant...
Analysis of Damaged Floor Coverings Emissions in Indoor Air Quality with Cant...Analysis of Damaged Floor Coverings Emissions in Indoor Air Quality with Cant...
Analysis of Damaged Floor Coverings Emissions in Indoor Air Quality with Cant...
Gasera Ltd.
 
Measurement of VOCs for Air Quality Using Widely Tunable Mid-Infrared Laser S...
Measurement of VOCs for Air Quality Using Widely Tunable Mid-Infrared Laser S...Measurement of VOCs for Air Quality Using Widely Tunable Mid-Infrared Laser S...
Measurement of VOCs for Air Quality Using Widely Tunable Mid-Infrared Laser S...
Gasera Ltd.
 
White paper - Continued process verification methods in cleaning validation
White paper - Continued process verification methods in cleaning validationWhite paper - Continued process verification methods in cleaning validation
White paper - Continued process verification methods in cleaning validation
Fedegari Group
 
Detection of Drugs with Cantilever-Enhanced Photoacoustic Spectroscopy
Detection of Drugs with Cantilever-Enhanced Photoacoustic SpectroscopyDetection of Drugs with Cantilever-Enhanced Photoacoustic Spectroscopy
Detection of Drugs with Cantilever-Enhanced Photoacoustic Spectroscopy
Gasera Ltd.
 
Environmental Forensics - Brussels Dioxin Conference Plenary 2011
Environmental Forensics - Brussels Dioxin Conference Plenary 2011Environmental Forensics - Brussels Dioxin Conference Plenary 2011
Environmental Forensics - Brussels Dioxin Conference Plenary 2011
Chemistry Matters Inc.
 
SIFT-MS_Instant_Quant_of_Comps_in_Air
SIFT-MS_Instant_Quant_of_Comps_in_AirSIFT-MS_Instant_Quant_of_Comps_in_Air
SIFT-MS_Instant_Quant_of_Comps_in_AirJason Worden
 
Gasera's gas sensor for the Internet of Things (IoT)
Gasera's gas sensor for the Internet of Things (IoT)Gasera's gas sensor for the Internet of Things (IoT)
Gasera's gas sensor for the Internet of Things (IoT)
Gasera Ltd.
 
A rotational reference cell for high-accuracy real-time spectroscopic trace-g...
A rotational reference cell for high-accuracy real-time spectroscopic trace-g...A rotational reference cell for high-accuracy real-time spectroscopic trace-g...
A rotational reference cell for high-accuracy real-time spectroscopic trace-g...
Clinton Smith
 

What's hot (20)

COD-UV-SPECTROSCOPY-ANN-ANALYSIS
COD-UV-SPECTROSCOPY-ANN-ANALYSISCOD-UV-SPECTROSCOPY-ANN-ANALYSIS
COD-UV-SPECTROSCOPY-ANN-ANALYSIS
 
Ce icp-ms
Ce icp-msCe icp-ms
Ce icp-ms
 
Aavos international - process analysis
Aavos international - process analysisAavos international - process analysis
Aavos international - process analysis
 
Photonics for High-End Gas Analysis - Gasera Ltd.
Photonics for High-End Gas Analysis - Gasera Ltd.Photonics for High-End Gas Analysis - Gasera Ltd.
Photonics for High-End Gas Analysis - Gasera Ltd.
 
Improve Wastewater Treatment and Save Money with Process Monitoring | YSI IQ ...
Improve Wastewater Treatment and Save Money with Process Monitoring | YSI IQ ...Improve Wastewater Treatment and Save Money with Process Monitoring | YSI IQ ...
Improve Wastewater Treatment and Save Money with Process Monitoring | YSI IQ ...
 
Ship Emissions Monitoring with Laser-Based Cantilever-Enhanced Photoacoustic ...
Ship Emissions Monitoring with Laser-Based Cantilever-Enhanced Photoacoustic ...Ship Emissions Monitoring with Laser-Based Cantilever-Enhanced Photoacoustic ...
Ship Emissions Monitoring with Laser-Based Cantilever-Enhanced Photoacoustic ...
 
Preview NOx_analysers
Preview NOx_analysersPreview NOx_analysers
Preview NOx_analysers
 
Aavos international - process analysis
Aavos international - process analysisAavos international - process analysis
Aavos international - process analysis
 
Simultaneous Measurement of N2O and CH4 Emissions from Agriculture Using Phot...
Simultaneous Measurement of N2O and CH4 Emissions from Agriculture Using Phot...Simultaneous Measurement of N2O and CH4 Emissions from Agriculture Using Phot...
Simultaneous Measurement of N2O and CH4 Emissions from Agriculture Using Phot...
 
IEEE Sensor journal 2016 Title and Abstract
IEEE Sensor journal 2016 Title and AbstractIEEE Sensor journal 2016 Title and Abstract
IEEE Sensor journal 2016 Title and Abstract
 
Measurement of Trace Hydrogen Fluoride in Clean Rooms and Ambient Air
Measurement of Trace Hydrogen Fluoride in Clean Rooms and Ambient AirMeasurement of Trace Hydrogen Fluoride in Clean Rooms and Ambient Air
Measurement of Trace Hydrogen Fluoride in Clean Rooms and Ambient Air
 
Analysis of Damaged Floor Coverings Emissions in Indoor Air Quality with Cant...
Analysis of Damaged Floor Coverings Emissions in Indoor Air Quality with Cant...Analysis of Damaged Floor Coverings Emissions in Indoor Air Quality with Cant...
Analysis of Damaged Floor Coverings Emissions in Indoor Air Quality with Cant...
 
Measurement of VOCs for Air Quality Using Widely Tunable Mid-Infrared Laser S...
Measurement of VOCs for Air Quality Using Widely Tunable Mid-Infrared Laser S...Measurement of VOCs for Air Quality Using Widely Tunable Mid-Infrared Laser S...
Measurement of VOCs for Air Quality Using Widely Tunable Mid-Infrared Laser S...
 
White paper - Continued process verification methods in cleaning validation
White paper - Continued process verification methods in cleaning validationWhite paper - Continued process verification methods in cleaning validation
White paper - Continued process verification methods in cleaning validation
 
Detection of Drugs with Cantilever-Enhanced Photoacoustic Spectroscopy
Detection of Drugs with Cantilever-Enhanced Photoacoustic SpectroscopyDetection of Drugs with Cantilever-Enhanced Photoacoustic Spectroscopy
Detection of Drugs with Cantilever-Enhanced Photoacoustic Spectroscopy
 
14.2 Wahlen
14.2 Wahlen14.2 Wahlen
14.2 Wahlen
 
Environmental Forensics - Brussels Dioxin Conference Plenary 2011
Environmental Forensics - Brussels Dioxin Conference Plenary 2011Environmental Forensics - Brussels Dioxin Conference Plenary 2011
Environmental Forensics - Brussels Dioxin Conference Plenary 2011
 
SIFT-MS_Instant_Quant_of_Comps_in_Air
SIFT-MS_Instant_Quant_of_Comps_in_AirSIFT-MS_Instant_Quant_of_Comps_in_Air
SIFT-MS_Instant_Quant_of_Comps_in_Air
 
Gasera's gas sensor for the Internet of Things (IoT)
Gasera's gas sensor for the Internet of Things (IoT)Gasera's gas sensor for the Internet of Things (IoT)
Gasera's gas sensor for the Internet of Things (IoT)
 
A rotational reference cell for high-accuracy real-time spectroscopic trace-g...
A rotational reference cell for high-accuracy real-time spectroscopic trace-g...A rotational reference cell for high-accuracy real-time spectroscopic trace-g...
A rotational reference cell for high-accuracy real-time spectroscopic trace-g...
 

Similar to Online Monitoring of Wastewater in Common Effluent Treatment Plant using UV-VIS Spectrophotometry Technique

Liquid Level Estimation in Dynamic Condition using Kalman Filter
Liquid Level Estimation in Dynamic Condition using Kalman FilterLiquid Level Estimation in Dynamic Condition using Kalman Filter
Liquid Level Estimation in Dynamic Condition using Kalman Filter
IJERA Editor
 
IRJET- Smart Water Monitoring System for Real-Time Water Quality and Usage Mo...
IRJET- Smart Water Monitoring System for Real-Time Water Quality and Usage Mo...IRJET- Smart Water Monitoring System for Real-Time Water Quality and Usage Mo...
IRJET- Smart Water Monitoring System for Real-Time Water Quality and Usage Mo...
IRJET Journal
 
Relative Dosimetry_02.04.2019_ Final.pptx
Relative Dosimetry_02.04.2019_ Final.pptxRelative Dosimetry_02.04.2019_ Final.pptx
Relative Dosimetry_02.04.2019_ Final.pptx
AshikurRahman204838
 
rf based complex impedance measurement
rf based complex impedance measurementrf based complex impedance measurement
rf based complex impedance measurement
INFOGAIN PUBLICATION
 
Difference & derivative spectrometry
Difference & derivative spectrometryDifference & derivative spectrometry
Difference & derivative spectrometry
aishuanju
 
Fredrick Ishengoma - A Novel Design of IEEE 802.15.4 and Solar Based Autonomo...
Fredrick Ishengoma - A Novel Design of IEEE 802.15.4 and Solar Based Autonomo...Fredrick Ishengoma - A Novel Design of IEEE 802.15.4 and Solar Based Autonomo...
Fredrick Ishengoma - A Novel Design of IEEE 802.15.4 and Solar Based Autonomo...
Fredrick Ishengoma
 
Detection of Wastewater Pollution Through Natural Language Generation With a ...
Detection of Wastewater Pollution Through Natural Language Generation With a ...Detection of Wastewater Pollution Through Natural Language Generation With a ...
Detection of Wastewater Pollution Through Natural Language Generation With a ...
Shakas Technologies
 
WATER LEVEL DETECTOR WITH TURBIDITY SENSOR
WATER LEVEL DETECTOR WITH TURBIDITY SENSORWATER LEVEL DETECTOR WITH TURBIDITY SENSOR
WATER LEVEL DETECTOR WITH TURBIDITY SENSORdeepa bhatia
 
Turbidity measurement
Turbidity measurementTurbidity measurement
Turbidity measurementgulfamraza
 
The role of open source technology based equipment in developing reliablereli...
The role of open source technology based equipment in developing reliablereli...The role of open source technology based equipment in developing reliablereli...
The role of open source technology based equipment in developing reliablereli...Paolo Losi
 
Sec Process Control Past Present and Future2222
Sec Process Control Past Present and Future2222Sec Process Control Past Present and Future2222
Sec Process Control Past Present and Future2222Roger Colee
 
IRJET- Indian Water Pollution Monitoring and Forecasting for Anomaly with...
IRJET-  	  Indian Water Pollution Monitoring and Forecasting for Anomaly with...IRJET-  	  Indian Water Pollution Monitoring and Forecasting for Anomaly with...
IRJET- Indian Water Pollution Monitoring and Forecasting for Anomaly with...
IRJET Journal
 
Detection of Water Level, Quality and Leakage using Raspberry Pi with Interne...
Detection of Water Level, Quality and Leakage using Raspberry Pi with Interne...Detection of Water Level, Quality and Leakage using Raspberry Pi with Interne...
Detection of Water Level, Quality and Leakage using Raspberry Pi with Interne...
IRJET Journal
 
Concentration measurements of bubbles in a water column using an optical tomo...
Concentration measurements of bubbles in a water column using an optical tomo...Concentration measurements of bubbles in a water column using an optical tomo...
Concentration measurements of bubbles in a water column using an optical tomo...
ISA Interchange
 
Some critical facets in air pollution
Some critical facets in air pollutionSome critical facets in air pollution
Some critical facets in air pollution
ECRD2015
 
IRJET- Design and Fabrication of Digital Fuel Meter with the Help of Ultrason...
IRJET- Design and Fabrication of Digital Fuel Meter with the Help of Ultrason...IRJET- Design and Fabrication of Digital Fuel Meter with the Help of Ultrason...
IRJET- Design and Fabrication of Digital Fuel Meter with the Help of Ultrason...
IRJET Journal
 
Environmental Monitoring
Environmental MonitoringEnvironmental Monitoring
Environmental Monitoring
European Tech Serv
 
Ragab R 1 - UEI Day 1 - Kochi Jan18
Ragab R 1 - UEI Day 1 - Kochi Jan18Ragab R 1 - UEI Day 1 - Kochi Jan18
Ragab R 1 - UEI Day 1 - Kochi Jan18
India UK Water Centre (IUKWC)
 
SENSOR NETWORK FOR REAL‐TIME MONITORING AND DETECTION CONTAMINATION IN DRINKI...
SENSOR NETWORK FOR REAL‐TIME MONITORING AND DETECTION CONTAMINATION IN DRINKI...SENSOR NETWORK FOR REAL‐TIME MONITORING AND DETECTION CONTAMINATION IN DRINKI...
SENSOR NETWORK FOR REAL‐TIME MONITORING AND DETECTION CONTAMINATION IN DRINKI...
ijiert bestjournal
 
Review Report on Canel and Subcanel Water Level Surveillance
Review Report on Canel and Subcanel Water Level SurveillanceReview Report on Canel and Subcanel Water Level Surveillance
Review Report on Canel and Subcanel Water Level Surveillance
IRJET Journal
 

Similar to Online Monitoring of Wastewater in Common Effluent Treatment Plant using UV-VIS Spectrophotometry Technique (20)

Liquid Level Estimation in Dynamic Condition using Kalman Filter
Liquid Level Estimation in Dynamic Condition using Kalman FilterLiquid Level Estimation in Dynamic Condition using Kalman Filter
Liquid Level Estimation in Dynamic Condition using Kalman Filter
 
IRJET- Smart Water Monitoring System for Real-Time Water Quality and Usage Mo...
IRJET- Smart Water Monitoring System for Real-Time Water Quality and Usage Mo...IRJET- Smart Water Monitoring System for Real-Time Water Quality and Usage Mo...
IRJET- Smart Water Monitoring System for Real-Time Water Quality and Usage Mo...
 
Relative Dosimetry_02.04.2019_ Final.pptx
Relative Dosimetry_02.04.2019_ Final.pptxRelative Dosimetry_02.04.2019_ Final.pptx
Relative Dosimetry_02.04.2019_ Final.pptx
 
rf based complex impedance measurement
rf based complex impedance measurementrf based complex impedance measurement
rf based complex impedance measurement
 
Difference & derivative spectrometry
Difference & derivative spectrometryDifference & derivative spectrometry
Difference & derivative spectrometry
 
Fredrick Ishengoma - A Novel Design of IEEE 802.15.4 and Solar Based Autonomo...
Fredrick Ishengoma - A Novel Design of IEEE 802.15.4 and Solar Based Autonomo...Fredrick Ishengoma - A Novel Design of IEEE 802.15.4 and Solar Based Autonomo...
Fredrick Ishengoma - A Novel Design of IEEE 802.15.4 and Solar Based Autonomo...
 
Detection of Wastewater Pollution Through Natural Language Generation With a ...
Detection of Wastewater Pollution Through Natural Language Generation With a ...Detection of Wastewater Pollution Through Natural Language Generation With a ...
Detection of Wastewater Pollution Through Natural Language Generation With a ...
 
WATER LEVEL DETECTOR WITH TURBIDITY SENSOR
WATER LEVEL DETECTOR WITH TURBIDITY SENSORWATER LEVEL DETECTOR WITH TURBIDITY SENSOR
WATER LEVEL DETECTOR WITH TURBIDITY SENSOR
 
Turbidity measurement
Turbidity measurementTurbidity measurement
Turbidity measurement
 
The role of open source technology based equipment in developing reliablereli...
The role of open source technology based equipment in developing reliablereli...The role of open source technology based equipment in developing reliablereli...
The role of open source technology based equipment in developing reliablereli...
 
Sec Process Control Past Present and Future2222
Sec Process Control Past Present and Future2222Sec Process Control Past Present and Future2222
Sec Process Control Past Present and Future2222
 
IRJET- Indian Water Pollution Monitoring and Forecasting for Anomaly with...
IRJET-  	  Indian Water Pollution Monitoring and Forecasting for Anomaly with...IRJET-  	  Indian Water Pollution Monitoring and Forecasting for Anomaly with...
IRJET- Indian Water Pollution Monitoring and Forecasting for Anomaly with...
 
Detection of Water Level, Quality and Leakage using Raspberry Pi with Interne...
Detection of Water Level, Quality and Leakage using Raspberry Pi with Interne...Detection of Water Level, Quality and Leakage using Raspberry Pi with Interne...
Detection of Water Level, Quality and Leakage using Raspberry Pi with Interne...
 
Concentration measurements of bubbles in a water column using an optical tomo...
Concentration measurements of bubbles in a water column using an optical tomo...Concentration measurements of bubbles in a water column using an optical tomo...
Concentration measurements of bubbles in a water column using an optical tomo...
 
Some critical facets in air pollution
Some critical facets in air pollutionSome critical facets in air pollution
Some critical facets in air pollution
 
IRJET- Design and Fabrication of Digital Fuel Meter with the Help of Ultrason...
IRJET- Design and Fabrication of Digital Fuel Meter with the Help of Ultrason...IRJET- Design and Fabrication of Digital Fuel Meter with the Help of Ultrason...
IRJET- Design and Fabrication of Digital Fuel Meter with the Help of Ultrason...
 
Environmental Monitoring
Environmental MonitoringEnvironmental Monitoring
Environmental Monitoring
 
Ragab R 1 - UEI Day 1 - Kochi Jan18
Ragab R 1 - UEI Day 1 - Kochi Jan18Ragab R 1 - UEI Day 1 - Kochi Jan18
Ragab R 1 - UEI Day 1 - Kochi Jan18
 
SENSOR NETWORK FOR REAL‐TIME MONITORING AND DETECTION CONTAMINATION IN DRINKI...
SENSOR NETWORK FOR REAL‐TIME MONITORING AND DETECTION CONTAMINATION IN DRINKI...SENSOR NETWORK FOR REAL‐TIME MONITORING AND DETECTION CONTAMINATION IN DRINKI...
SENSOR NETWORK FOR REAL‐TIME MONITORING AND DETECTION CONTAMINATION IN DRINKI...
 
Review Report on Canel and Subcanel Water Level Surveillance
Review Report on Canel and Subcanel Water Level SurveillanceReview Report on Canel and Subcanel Water Level Surveillance
Review Report on Canel and Subcanel Water Level Surveillance
 

Online Monitoring of Wastewater in Common Effluent Treatment Plant using UV-VIS Spectrophotometry Technique

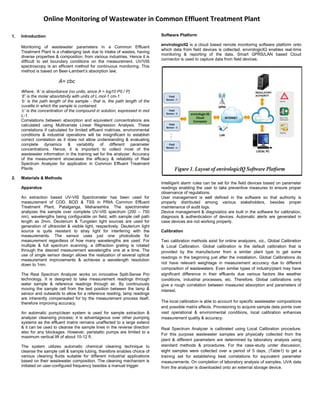
  • 1. Online Monitoring of Wastewater in Common Effluent Treatment Plant 1. Introduction Monitoring of wastewater parameters in a Common Effluent Treatment Plant is a challenging task due to intake of wastes, having diverse properties & composition, from various industries. Hence it is difficult to set boundary conditions on the measurement. UV/VIS spectroscopy is an efficient method for continuous monitoring. This method is based on Beer-Lambert’s absorption law; A= Ɛbc Where, ‘A’ is absorbance (no units, since A = log10 P0 / P) ‘Ɛ’ is the molar absorbtivity with units of L mol-1 cm-1 ‘b’ is the path length of the sample - that is, the path length of the cuvette in which the sample is contained. ‘c’ is the concentration of the compound in solution, expressed in mol L-1. Correlations between absorption and equivalent concentrations are calculated using Multivariate Linear Regression Analysis. These correlations if calculated for limited effluent matrices, environmental conditions & industrial operations will be insignificant to establish correct correlation as it does not allow understanding & evaluating complete dynamics & variability of different parameter concentrations. Hence, it is important to collect most of the wastewater information in the training set for the analyzer. Accuracy of the measurement showcases the efficacy & reliability of Real Spectrum Analyzer for application in Common Effluent Treatment Plants 2. Materials & Methods Apparatus An extraction based UV-VIS Spectrometer has been used for measurement of COD, BOD & TSS in PRIA Common Effluent Treatment Plant, Patalganga, Maharashtra. The spectrometer analyzes the sample over complete UV-VIS spectrum (200 – 750 nm), wavelengths being configurable on field, with sample cell path length as 2mm. Deuterium & Tungsten light sources are used for generation of ultraviolet & visible light, respectively. Deuterium light source is quite resistant to stray light for interfering with the measurements. The sensor uses just one photodiode for measurement regardless of how many wavelengths are used. For multiple & full spectrum scanning, a diffraction grating is rotated through the desired measurement wavelengths one at a time. The use of single sensor design allows the realization of several optical measurement improvements & achieves a wavelength resolution down to 1nm. The Real Spectrum Analyzer works on innovative Split-Sense Pro technology. It is designed to take measurement readings through water sample & reference readings through air. By continuously moving the sample cell from the test position between the lamp & sensor and outwards to allow for a reference reading, lamp readings are inherently compensated for by the measurement process itself, therefore improving accuracy. An automatic pump/clean system is used for sample extraction & analyzer cleansing process; it is advantageous over other pumping systems as the effluent matrix remains unaffected to a large extend & it can be used to cleanse the sample lines in the reverse direction also for any blockages. However, peristaltic pumps are limited to a maximum vertical lift of about 10-12 ft. The system utilizes automatic chemical cleaning technique to cleanse the sample cell & sample tubing, therefore enables choice of various cleaning fluids suitable for different industrial applications based on their wastewater composition. The cleaning mechanism is initiated on user-configured frequency besides a manual trigger. Software Platform envirologicIQ is a cloud based remote monitoring software platform onto which data from field devices is collected. envirologicIQ enables real-time monitoring & reporting of the data. Smart GPRS/LAN based Cloud connector is used to capture data from field devices. Intelligent alarm rules can be set for the field devices based on parameter readings enabling the user to take preventive measures to ensure proper observance of regulations. User management is well defined in the software so that authority is properly distributed among various stakeholders, besides proper maintenance of audit logs. Device management & diagnostics are built in the software for calibration, diagnosis & authentication of devices. Automatic alerts are generated in case devices are not working properly. Calibration Two calibration methods exist for online analyzers, viz., Global Calibration & Local Calibration. Global calibration is the default calibration that is provided by the manufacturer from a similar plant type to get some readings in the beginning just after the installation. Global Calibrations do not have relevant weightage in measurement accuracy due to different composition of wastewaters. Even similar types of industry/plant may have significant difference in their effluents due various factors like weather conditions, industrial processes, etc. Therefore, Global calibrations only give a rough correlation between measured absorption and parameters of interest. The local calibration is able to account for specific wastewater compositions and possible matrix effects. Provisioning to acquire sample data points over vast operational & environmental conditions, local calibration enhances measurement quality & accuracy. Real Spectrum Analyzer is calibrated using Local Calibration procedure. For this purpose wastewater samples are physically collected from the plant & different parameters are determined by laboratory analysis using standard methods & procedures. For the case-study under discussion, eight samples were collected over a period of 5 days, (Table1) to get a training set for establishing best correlations for equivalent parameter measurements. On completion of laboratory analysis of samples, UVA data from the analyzer is downloaded onto an external storage device.
  • 2. Online Monitoring of Wastewater in Common Effluent Treatment Plant Spectra of measured absorbencies is correlated to laboratory results to achieve a correlation matrices for different parameters (COD, TSS, etc.) using statistical regression models expressed as; 𝐶𝑒𝑞 = ∑ (𝜆𝑛 𝑖=1 𝑖. 𝐴𝑖) + K with ‘n’ the number of used wavelength ‘λi’ depending on the measuring system (for the case under study, n=390). The weighing factors ‘Ai’ are determined after fitting to laboratory analysis. The constant offset K can be used for the specific wastewater matrix adjustment over all single wavelengths. Every calibration model results from a compromise between generality and robustness. Usually, particularities in calibration data can be better reproduced by increasing the value of ‘n’. Therefore, minor deviations between calculated equivalence values and laboratory values can be determined. 3. Operational Experiences After carrying out the local calibration, correlations were fed into the system. The spectrometer worked absolutely fine for first two days of operation. The results of spectrometer & laboratory analysis are compared as in Table 2. A tremendous overshoot in readings of different parameters happened on 17th July. A detailed site and instrument study was carried out to find the reason for this abrupt change. Primary reason was found to be the heavy rainfall that happened. Since the effluent is collected in an open tank before pumping out, rains increased the component of suspended solids. Second reason was the fouling of flow cell that occurred due to unsuitable cleaning frequency set for automatic cleaning. Frequency was set to 12 hour; however the recommended cleaning frequency for a common effluent treatment plant is 3 - 4 hours due to high concentration of fouling agents. Third reason was found to be the improper working of oven in the laboratory that consequently added to error in readings. With another unit installed in a CETP at Ahmadabad, Gujarat we faced a challenge for measuring TSS with visible spectrum method as the effluent mainly consisted of wastes from pharmaceutical, textile and dye industries. Therefore, sensor based on IR 90º Scattering principle was used to measure the TSS accurately. Also, training set for the instrument needs to cover vast operational changes for better accuracy of COD & BOD measurements. 4. Results & Discussion It is of high importance to investigate whole concentration range to get reliable absorbance-concentration correlation for the system to produce accurate results. Plot 1 shows laboratory concentration of Chemical Oxygen Demand & its equivalent online reading. After local calibration and adjustment work based on taken reference laboratory samples, the deviations produced by Global calibration could be reduced. Investigating whole concentration range to get reliable absorbance-concentration correlation for the system is therefore important if high accuracy of the spectrometer equivalent values is needed. However, the dry wastewater matrix adjusted local calibrations does not inevitably deliver reliable data during wet weather conditions due to the different composition of wastewater. For long-term effective operation, cleaning systems are necessary for the spectrometer itself to prevent measurement drift due to accumulation of waste material on the measurement optics and for the channel & tubing to prevent sedimentation & blockages. Plot 2. depicts the online & laboratory readings for Total Suspended Solids. The cited results demonstrate the practicability of UV/VIS analyzers for online effluent monitoring as the equivalent concentrations for the parameter COD and TSS measured by the UV/VIS spectrometer are reliable & accurate. COD TSS 1 23/06/15 12:05 PM 208 1000 2 24/06/15 11:05 AM 171 340 3 24/06/15 4:00 PM 191 100 4 25/06/15 12:20 PM 235 140 5 25/06/15 4:20 PM 205 960 6 26/06/15 4:15 PM 233 660 7 27/06/15 11:46 AM 541 960 8 27/06/15 3:50 PM 463 1080 Training Set Table 1. Laboratory Reports for COD & TSS (PRIA CETP, Patalganga,Maharashtra) Sample Date Parameters Time