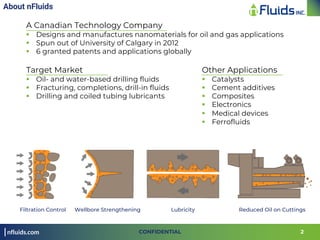
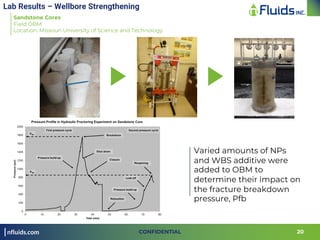
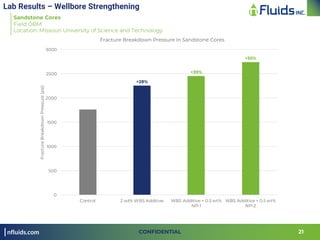
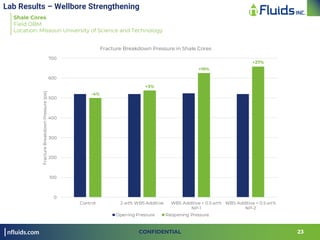
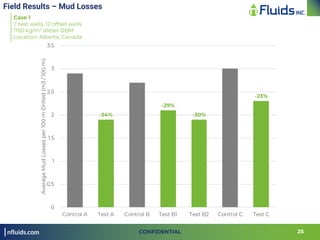
NANOTECHNOLOGY FOR O&G:
A Technical Overview
CONFIDENTIAL
Jeffrey Forsyth, Alex Borisov, Hai Wang
nFluids Inc, Calgary, AB
November 2018
Other Applications
§ Catalysts
§ Cement additives
§ Composites
§ Electronics
§ Medical devices
§ Ferrofluids
Target Market
§ Oil- and water-based drilling fluids
§ Fracturing, completions, drill-in fluids
§ Drilling and coiled tubing lubricants
About nFluids
A Canadian Technology Company
§ Designs and manufactures nanomaterials for oil and gas applications
§ Spun out of University of Calgary in 2012
§ 6 granted patents and applications globally
nfluids.com
Filtration Control Wellbore Strengthening Lubricity Reduced Oil on Cuttings
2CONFIDENTIAL
nFluids Technology Explained
nFluids Technology
§ Based on custom-engineered nanotechnology
§ Patented large-scale manufacturing process
§ Platform technology capabilities
§ nForcer™ - first commercial product based on 5 nm technology
nfluids.com 3CONFIDENTIAL
0
1000
2000
3000
4000
5000
6000
1.0E-09 1.0E-08 1.0E-07 1.0E-06 1.0E-05 1.0E-04 1.0E-03 1.0E-02 1.0E-01 1.0E+00
SpecificSurfaceArea(m2/g)
Particle Diameter (m)
Specific Surface Area of Spherical Particle
10 µm
1 particle
10 nm
109 particles
The nForcer™
Key Benefits
§ Superior performance at low concentrations
§ Significantly reduces spurt and seepage losses
§ Compact, strong and smooth filter cake
§ Enhances lubrication, reduces coefficient of friction (CoF) and wear
§ Increases fracture breakdown pressure in sandstones and shales
§ Reduces oil on cuttings/cuttings oil retention (OOC/COR)
§ Increases thermal conductivity
§ High temperature stability
§ Non-toxic, acid-soluble and suitable for use in environmentally sensitive areas
§ Does not interfere with downhole and MWD equipment
nfluids.com 4CONFIDENTIAL
nForcer is a multi-functional additive for all types of drilling fluids
20 wt% NP stabilized with a surfactant suspended in a carrier oil
Can be manufactured at conventional blending facilities
nForcer™ Characterization
5 nm
SG 3.8
Brown
Spherical
Non-magnetic
Acid-soluble
12 nm
SG 5.2
Black
Spherical
Superparamagnetic
Acid-soluble
50 nm
SG 5.2
Red
Spherical
Weakly paramagnetic
Acid-soluble
Three NP types:
§ 5 nm
§ 12 nm
§ 50 nm
nfluids.com 5CONFIDENTIAL
Filtration Control
nfluids.com 6CONFIDENTIAL
Lab Results – Fluid Loss
Synthetic Mud
Sample Location: Gulf of Mexico + Texas
OWR: 85/15
SBM-1: 1595 kg/m3
SBM-2: 1643 kg/m3
SBM-3: 1940 kg/m3
-79%
-54%
-40%
0
2
4
6
8
10
12
14
16
18
20
22
24
SBM-1 SBM-2 SBM-3
APIFluidLossat30min(mL×2)
HTHP Fluid Loss in Field OBM on Paper
150 °C, 500 psi, hot rolled 16 hrs
Control 0.5 wt% NP
nfluids.com 7CONFIDENTIAL
Lab Results – Fluid Loss
-90%
-56%
0
0.4
0.8
1.2
1.6
2
Field OBM Lab OBM
APIFluidLossat30min(mL×2)
HTHP Fluid Loss in Field and Lab OBM on Paper
120 °C, 500 psi, hot rolled 16 hrs
Control 0.5 wt% NP
Synthetic Mud
Sample Location: Gulf of Mexico
OWR: 85/15
MW: 1350 kg/m3
nfluids.com 8CONFIDENTIAL
Lab Results – Fluid Loss
-81%
-56%
-73%
0
2
4
6
8
10
12
14
16
18
20
Paper 10 μm disk 50 μm disk 250 μm disk
APIFluidLossat30min(mL×2)
HTHP Fluid Loss in Field OBM on Paper and Ceramic Disks
80 °C, 500 psi, hot rolled 16 hrs
Control 0.5 wt% NP
COMPLETE LOSS OF
FLUID IN LESS THAN A
MINUTE
10 µm disk
50 µm disk
Diesel OBM
Sample Location: Alberta
OWR: 85/15
MW: 1295 kg/m3
nfluids.com 9CONFIDENTIAL
Lab Results – Filter Cake
0.0
0.5
1.0
1.5
2.0
2.5
3.0
3.5
4.0
0
2
4
6
8
10
12
14
16
18
0% 0.05% 0.1% 0.15% 0.2% 0.25% 0.3% 0.35% 0.4% 0.5% 0.6% 0.7% 1%
FilterCakeThickness(mm)
APIFluidLossat30min(mL×2)
NP Concentration (wt%)
HTHP Fluid Loss vs Filter Cake Thickness in Field OBM
80 °C, 500 psi, hot rolled 16 hrs
HTHP Fluid Loss Filter Cake
Diesel OBM
Sample Location: Alberta
OWR: 85/15
MW: 1295 kg/m3
nfluids.com 10CONFIDENTIAL
Lab Results – Fluid Loss
WBM
Sample Location: UAE
WBM-1: 1290 kg/m3
WBM-2: 1270 kg/m3
nfluids.com 11CONFIDENTIAL
-23%
-25%
-29%
-37%
0
3
6
9
12
15
Bentonite-Polymer WBM KCl-PHPA WBM
HTHPFluidLossat30min(mLx2)
HTHP Fluid Loss in WBM
250 °F, 500 psi, paper
Control 0.5 wt% NP 1.0 wt% NP
nfluids.com 12CONFIDENTIAL
Lab Results – Fluid Loss
WBM
Sample Location: Texas
-29%
-44%
-60%
0
5
10
15
20
25
30
35
1200 1500 1800
HTHPFluidLossat30min(mLx2)
Mud Weight (kg/m3)
HTHP Fluid Loss in WBM in the presence of NP
250 ℉, 500 psi, hot rolled 16 hrs
Control
0.5 wt% NP
Lab Results – Return Permeability
Mineral OBM
Sample Location: North Sea
-30%
-26%
-36%
+77%
+18%
+92%
0
10
20
30
40
50
60
70
80
90
100
Control 20 kg/m3 FL Additive 5 kg/m3 nForcer 20 kg/m3 FL Additive + 5
kg/m3 nForcer
%
Leak-off and Return Permeability Test on Field OBM
Leak-off (%PV) Return Permeability (%)
nfluids.com 13CONFIDENTIAL
Lubricity
nfluids.com 14CONFIDENTIAL
Lab Results – Tribology
Ball-on-Disk Tribometer
Diesel OBM
Location: Norway
OBM-1: 90/10
OBM-2: 80/20
-23%
-22%
0
0.05
0.1
0.15
0.2
0.25
OBM-1 OBM-2
AverageCoefficientofFriction(au)
Ball-on-Disk Coefficient of Friction in Lab OBM at 55 °C
Control 0.5 wt% NP
nfluids.com 15CONFIDENTIAL
Lab Results – Lubricity
OFI Lubricity & EP Meter
Lab and Field OBM
Sample Location: Alberta
nfluids.com 16CONFIDENTIAL
-48%
-31%
-26%
-15%
0
0.01
0.02
0.03
0.04
0.05
0.06
0.07
Diesel OBM 1 Diesel OBM 2 Mineral OBM Diesel OBM 3
CoefficientofFriction(au) Metal-on-Metal Coefficient of Friction in OBM
OFI Lubricity Tester, 60 rpm, 150 lb-in
Control 0.5 wt% NP
Lab Results – Lubricity
OFI Lubricity & EP Meter
Field Brine
Sample Location: Louisiana
-29% -29%
-56%
-71%
0
0.02
0.04
0.06
0.08
0.1
0.12
0.14
Lubricant A Lubricant B
AverageCoefficientofFriction(au)
Metal-on-Metal Coefficient of Friction in Field Brine
OFI Lubricity Tester, 60 rpm, 150 lb-in
Brine 3 vol% Lube 3 vol% Lube:NP 90:10
nfluids.com 17CONFIDENTIAL
Lab Results – Lubricity
OFI Lubricity & EP Meter
Polymer WBM
Location: Alberta
-65%
-68%
-63%
-54%
n/a
n/a
-83%
-85%
-79%
-66%
n/a
n/a
0.00
0.05
0.10
0.15
0.20
0.25
0.30
0.35
0.40
0.45
100 150 200 300 400 500
AverageCoefficientofFriction(au)
Applied Torque (lb-in)
Metal-on-Metal Coefficient of Friction in Polymer WBM
OFI Lubricity Tester, 60 rpm, varied applied torque
Control 3 vol% Lube 3 vol% Lube:NP 97:3
nfluids.com 18CONFIDENTIAL
Wellbore
Strengthening
nfluids.com 19CONFIDENTIAL
Lab Results – Wellbore Strengthening
Sandstone Cores
Field OBM
Location: Missouri University of Science and Technology
Varied amounts of NPs
and WBS additive were
added to OBM to
determine their impact on
the fracture breakdown
pressure, Pfb
nfluids.com 20CONFIDENTIAL
Lab Results – Wellbore Strengthening
Sandstone Cores
Field OBM
Location: Missouri University of Science and Technology
+28%
+39%
+55%
0
500
1000
1500
2000
2500
3000
Control 2 wt% WBS Additive WBS Additive + 0.5 wt%
NP-1
WBS Additive + 0.5 wt%
NP-2
FractureBreakdownPressure(psi)
Fracture Breakdown Pressure in Sandstone Cores
nfluids.com 21CONFIDENTIAL
Lab Results – Wellbore Strengthening
Shale Cores
Field OBM
Location: Missouri University of Science and Technology
Varied amounts of NPs
and WBS additive were
added to OBM to
determine their impact on
the fracture reopening
pressure, Pfb2
nfluids.com 22CONFIDENTIAL
Lab Results – Wellbore Strengthening
Shale Cores
Field OBM
Location: Missouri University of Science and Technology
-4%
+3%
+19%
+27%
0
100
200
300
400
500
600
700
Control 2 wt% WBS Additive WBS Additive + 0.5 wt%
NP-1
WBS Additive + 0.5 wt%
NP-2
FractureBreakdownPressure(psi)
Fracture Breakdown Pressure in Shale Cores
Opening Pressure Reopening Pressure
nfluids.com 23CONFIDENTIAL
Field Pilots
nfluids.com 24CONFIDENTIAL
Field Results – Mud Losses
Case 1
7 test wells, 12 offset wells
1150 kg/m3
diesel OBM
Location: Alberta, Canada
-34%
-29%
-30%
-23%
0
0.5
1
1.5
2
2.5
3
3.5
Control A Test A Control B Test B1 Test B2 Control C Test C
AverageMudLossesper100mDrilled(m3/100m)
nfluids.com 25CONFIDENTIAL
Field Results – Rate of Penetration
Case 2
2 test wells, 2 offset wells
1250 kg/m3
diesel OBM
Location: Alberta, Canada
Pason data
nfluids.com 26CONFIDENTIAL
600
800
1000
1200
1400
1600
1800
2000
2200
2400
2600
2800
3000
3200
3400
MeasuredHoleDepth(m)
Time (days)
Comparison of Average ROP in Control and Test Wells
Control Test
+5%
+50%
Field Results – Oil on Cuttings
Case 2
2 test wells, 2 offset wells
1250 kg/m3
diesel OBM
Location: Alberta, Canada
nfluids.com 27CONFIDENTIAL
500
1000
1500
2000
2500
3000
3500
4000
4500
0.00 0.20 0.40 0.60 0.80 1.00 1.20 1.40
MesuredHoleDepth(m)
Oil on Cuttings (m3
/m3
)
Oil on Cuttings in Control and Test Wells
Control Well Test Well
30% lower average OOC
Field Results – Fluid Loss and Filter Cake
Case 3
1 test well
1300 kg/m3
mineral OBM
Location: Off-shore North Sea
nfluids.com 28CONFIDENTIAL
0.0
0.5
1.0
1.5
2.0
2.5
3.0
3.5
0.0
0.5
1.0
1.5
2.0
2.5
FilterCakeThickness(mm)
HTHPFluidLoss(mLx2)
HTHP Fluid Loss and Filter Cake Thickness During Field Pilot
Fluid Loss Filter Cake
Average fluid loss
Average filter cake thickness
55% reduction
29% reduction
Field Results – Lubricity
Case 3
1 test well
1300 kg/m3
mineral OBM
Location: Off-shore North Sea
DWOB 3D Analytical Model
nfluids.com 29CONFIDENTIAL
2200
2300
2400
2500
2600
2700
2800
0.1 0.15 0.2 0.25 0.3
MeasuredHoleDepth(m)
Coefficient of Friction (au)
Friction Factors in the Test Well Before and After Addition of NPs
nForcer added
Average
COF prior to
addition of
nForcer
Average
COF
reduced by
~20%
Field Results – ROP
nfluids.com 30CONFIDENTIAL
11000
11500
12000
12500
13000
13500
14000
14500
15000
15500
16000
16500
17000
17500
18000
18500
19000
19500
20000
20500
21000
0 100 200 300 400 500
MeasuredDepth(ft)
Rate of Penetration (ft/hr)
ROP
Control Test
11000
11500
12000
12500
13000
13500
14000
14500
15000
15500
16000
16500
17000
17500
18000
18500
19000
19500
20000
20500
21000
0 10 20 30 40
MeasuredDepth(ft)
On Bottom Hours (hrs)
On Bottom Hours
Control Test
187.6 ft/hr
190.7 ft/hr
233.9 ft/hr
245.7 ft/hr
ROP in the
lateral section
increased by
~25%
Case 4
1 test well
1200 kg/m3
brine
Location: Williston Basin/Bakken
Field Results – ROP
nfluids.com 31CONFIDENTIAL
ROP in the
lateral section
increased by
~25%
12000
13000
14000
15000
16000
17000
18000
19000
20000
21000
22000
150 200 250 300 350
MeasuredDepth(ft)
ROP (ft/hr)
Rate of Penetration
Test Control #1 Control #2 Control #3
Case 5
1 test well
1200 kg/m3
brine
Location: Williston Basin/Three Forks
12000
13000
14000
15000
16000
17000
18000
19000
20000
21000
22000
0 10 20 30 40 50
MeasuredDepth(ft)
On Bottom Hours (hrs)
On Bottom Hours
Test Control #1 Control #2 Control #3
195.1 ft/hr
194.6 ft/hr
196.3 ft/hr
203.4 ft/hr
245.3 ft/hr
202 ft/hr
Appendix A – Magnetic Interference Test
nfluids.com 32CONFIDENTIAL
No change observed compared to the baseline
nfluids.com 33© 2018 nFluids Inc. All rights reserved.
Thank you
jforsyth@nfluids.com
aborisov@nfluids.com
hwang@nfluids.com
nFluids Inc.
253147 Bearspaw Rd
Calgary, AB T3L 2P5

nfluids Master Technical Presentation Dec 2018

  • 1.
    NANOTECHNOLOGY FOR O&G: ATechnical Overview CONFIDENTIAL Jeffrey Forsyth, Alex Borisov, Hai Wang nFluids Inc, Calgary, AB November 2018
  • 2.
    Other Applications § Catalysts §Cement additives § Composites § Electronics § Medical devices § Ferrofluids Target Market § Oil- and water-based drilling fluids § Fracturing, completions, drill-in fluids § Drilling and coiled tubing lubricants About nFluids A Canadian Technology Company § Designs and manufactures nanomaterials for oil and gas applications § Spun out of University of Calgary in 2012 § 6 granted patents and applications globally nfluids.com Filtration Control Wellbore Strengthening Lubricity Reduced Oil on Cuttings 2CONFIDENTIAL
  • 3.
    nFluids Technology Explained nFluidsTechnology § Based on custom-engineered nanotechnology § Patented large-scale manufacturing process § Platform technology capabilities § nForcer™ - first commercial product based on 5 nm technology nfluids.com 3CONFIDENTIAL 0 1000 2000 3000 4000 5000 6000 1.0E-09 1.0E-08 1.0E-07 1.0E-06 1.0E-05 1.0E-04 1.0E-03 1.0E-02 1.0E-01 1.0E+00 SpecificSurfaceArea(m2/g) Particle Diameter (m) Specific Surface Area of Spherical Particle 10 µm 1 particle 10 nm 109 particles
  • 4.
    The nForcer™ Key Benefits §Superior performance at low concentrations § Significantly reduces spurt and seepage losses § Compact, strong and smooth filter cake § Enhances lubrication, reduces coefficient of friction (CoF) and wear § Increases fracture breakdown pressure in sandstones and shales § Reduces oil on cuttings/cuttings oil retention (OOC/COR) § Increases thermal conductivity § High temperature stability § Non-toxic, acid-soluble and suitable for use in environmentally sensitive areas § Does not interfere with downhole and MWD equipment nfluids.com 4CONFIDENTIAL nForcer is a multi-functional additive for all types of drilling fluids 20 wt% NP stabilized with a surfactant suspended in a carrier oil Can be manufactured at conventional blending facilities
  • 5.
    nForcer™ Characterization 5 nm SG3.8 Brown Spherical Non-magnetic Acid-soluble 12 nm SG 5.2 Black Spherical Superparamagnetic Acid-soluble 50 nm SG 5.2 Red Spherical Weakly paramagnetic Acid-soluble Three NP types: § 5 nm § 12 nm § 50 nm nfluids.com 5CONFIDENTIAL
  • 6.
  • 7.
    Lab Results –Fluid Loss Synthetic Mud Sample Location: Gulf of Mexico + Texas OWR: 85/15 SBM-1: 1595 kg/m3 SBM-2: 1643 kg/m3 SBM-3: 1940 kg/m3 -79% -54% -40% 0 2 4 6 8 10 12 14 16 18 20 22 24 SBM-1 SBM-2 SBM-3 APIFluidLossat30min(mL×2) HTHP Fluid Loss in Field OBM on Paper 150 °C, 500 psi, hot rolled 16 hrs Control 0.5 wt% NP nfluids.com 7CONFIDENTIAL
  • 8.
    Lab Results –Fluid Loss -90% -56% 0 0.4 0.8 1.2 1.6 2 Field OBM Lab OBM APIFluidLossat30min(mL×2) HTHP Fluid Loss in Field and Lab OBM on Paper 120 °C, 500 psi, hot rolled 16 hrs Control 0.5 wt% NP Synthetic Mud Sample Location: Gulf of Mexico OWR: 85/15 MW: 1350 kg/m3 nfluids.com 8CONFIDENTIAL
  • 9.
    Lab Results –Fluid Loss -81% -56% -73% 0 2 4 6 8 10 12 14 16 18 20 Paper 10 μm disk 50 μm disk 250 μm disk APIFluidLossat30min(mL×2) HTHP Fluid Loss in Field OBM on Paper and Ceramic Disks 80 °C, 500 psi, hot rolled 16 hrs Control 0.5 wt% NP COMPLETE LOSS OF FLUID IN LESS THAN A MINUTE 10 µm disk 50 µm disk Diesel OBM Sample Location: Alberta OWR: 85/15 MW: 1295 kg/m3 nfluids.com 9CONFIDENTIAL
  • 10.
    Lab Results –Filter Cake 0.0 0.5 1.0 1.5 2.0 2.5 3.0 3.5 4.0 0 2 4 6 8 10 12 14 16 18 0% 0.05% 0.1% 0.15% 0.2% 0.25% 0.3% 0.35% 0.4% 0.5% 0.6% 0.7% 1% FilterCakeThickness(mm) APIFluidLossat30min(mL×2) NP Concentration (wt%) HTHP Fluid Loss vs Filter Cake Thickness in Field OBM 80 °C, 500 psi, hot rolled 16 hrs HTHP Fluid Loss Filter Cake Diesel OBM Sample Location: Alberta OWR: 85/15 MW: 1295 kg/m3 nfluids.com 10CONFIDENTIAL
  • 11.
    Lab Results –Fluid Loss WBM Sample Location: UAE WBM-1: 1290 kg/m3 WBM-2: 1270 kg/m3 nfluids.com 11CONFIDENTIAL -23% -25% -29% -37% 0 3 6 9 12 15 Bentonite-Polymer WBM KCl-PHPA WBM HTHPFluidLossat30min(mLx2) HTHP Fluid Loss in WBM 250 °F, 500 psi, paper Control 0.5 wt% NP 1.0 wt% NP
  • 12.
    nfluids.com 12CONFIDENTIAL Lab Results– Fluid Loss WBM Sample Location: Texas -29% -44% -60% 0 5 10 15 20 25 30 35 1200 1500 1800 HTHPFluidLossat30min(mLx2) Mud Weight (kg/m3) HTHP Fluid Loss in WBM in the presence of NP 250 ℉, 500 psi, hot rolled 16 hrs Control 0.5 wt% NP
  • 13.
    Lab Results –Return Permeability Mineral OBM Sample Location: North Sea -30% -26% -36% +77% +18% +92% 0 10 20 30 40 50 60 70 80 90 100 Control 20 kg/m3 FL Additive 5 kg/m3 nForcer 20 kg/m3 FL Additive + 5 kg/m3 nForcer % Leak-off and Return Permeability Test on Field OBM Leak-off (%PV) Return Permeability (%) nfluids.com 13CONFIDENTIAL
  • 14.
  • 15.
    Lab Results –Tribology Ball-on-Disk Tribometer Diesel OBM Location: Norway OBM-1: 90/10 OBM-2: 80/20 -23% -22% 0 0.05 0.1 0.15 0.2 0.25 OBM-1 OBM-2 AverageCoefficientofFriction(au) Ball-on-Disk Coefficient of Friction in Lab OBM at 55 °C Control 0.5 wt% NP nfluids.com 15CONFIDENTIAL
  • 16.
    Lab Results –Lubricity OFI Lubricity & EP Meter Lab and Field OBM Sample Location: Alberta nfluids.com 16CONFIDENTIAL -48% -31% -26% -15% 0 0.01 0.02 0.03 0.04 0.05 0.06 0.07 Diesel OBM 1 Diesel OBM 2 Mineral OBM Diesel OBM 3 CoefficientofFriction(au) Metal-on-Metal Coefficient of Friction in OBM OFI Lubricity Tester, 60 rpm, 150 lb-in Control 0.5 wt% NP
  • 17.
    Lab Results –Lubricity OFI Lubricity & EP Meter Field Brine Sample Location: Louisiana -29% -29% -56% -71% 0 0.02 0.04 0.06 0.08 0.1 0.12 0.14 Lubricant A Lubricant B AverageCoefficientofFriction(au) Metal-on-Metal Coefficient of Friction in Field Brine OFI Lubricity Tester, 60 rpm, 150 lb-in Brine 3 vol% Lube 3 vol% Lube:NP 90:10 nfluids.com 17CONFIDENTIAL
  • 18.
    Lab Results –Lubricity OFI Lubricity & EP Meter Polymer WBM Location: Alberta -65% -68% -63% -54% n/a n/a -83% -85% -79% -66% n/a n/a 0.00 0.05 0.10 0.15 0.20 0.25 0.30 0.35 0.40 0.45 100 150 200 300 400 500 AverageCoefficientofFriction(au) Applied Torque (lb-in) Metal-on-Metal Coefficient of Friction in Polymer WBM OFI Lubricity Tester, 60 rpm, varied applied torque Control 3 vol% Lube 3 vol% Lube:NP 97:3 nfluids.com 18CONFIDENTIAL
  • 19.
  • 20.
    Lab Results –Wellbore Strengthening Sandstone Cores Field OBM Location: Missouri University of Science and Technology Varied amounts of NPs and WBS additive were added to OBM to determine their impact on the fracture breakdown pressure, Pfb nfluids.com 20CONFIDENTIAL
  • 21.
    Lab Results –Wellbore Strengthening Sandstone Cores Field OBM Location: Missouri University of Science and Technology +28% +39% +55% 0 500 1000 1500 2000 2500 3000 Control 2 wt% WBS Additive WBS Additive + 0.5 wt% NP-1 WBS Additive + 0.5 wt% NP-2 FractureBreakdownPressure(psi) Fracture Breakdown Pressure in Sandstone Cores nfluids.com 21CONFIDENTIAL
  • 22.
    Lab Results –Wellbore Strengthening Shale Cores Field OBM Location: Missouri University of Science and Technology Varied amounts of NPs and WBS additive were added to OBM to determine their impact on the fracture reopening pressure, Pfb2 nfluids.com 22CONFIDENTIAL
  • 23.
    Lab Results –Wellbore Strengthening Shale Cores Field OBM Location: Missouri University of Science and Technology -4% +3% +19% +27% 0 100 200 300 400 500 600 700 Control 2 wt% WBS Additive WBS Additive + 0.5 wt% NP-1 WBS Additive + 0.5 wt% NP-2 FractureBreakdownPressure(psi) Fracture Breakdown Pressure in Shale Cores Opening Pressure Reopening Pressure nfluids.com 23CONFIDENTIAL
  • 24.
  • 25.
    Field Results –Mud Losses Case 1 7 test wells, 12 offset wells 1150 kg/m3 diesel OBM Location: Alberta, Canada -34% -29% -30% -23% 0 0.5 1 1.5 2 2.5 3 3.5 Control A Test A Control B Test B1 Test B2 Control C Test C AverageMudLossesper100mDrilled(m3/100m) nfluids.com 25CONFIDENTIAL
  • 26.
    Field Results –Rate of Penetration Case 2 2 test wells, 2 offset wells 1250 kg/m3 diesel OBM Location: Alberta, Canada Pason data nfluids.com 26CONFIDENTIAL 600 800 1000 1200 1400 1600 1800 2000 2200 2400 2600 2800 3000 3200 3400 MeasuredHoleDepth(m) Time (days) Comparison of Average ROP in Control and Test Wells Control Test +5% +50%
  • 27.
    Field Results –Oil on Cuttings Case 2 2 test wells, 2 offset wells 1250 kg/m3 diesel OBM Location: Alberta, Canada nfluids.com 27CONFIDENTIAL 500 1000 1500 2000 2500 3000 3500 4000 4500 0.00 0.20 0.40 0.60 0.80 1.00 1.20 1.40 MesuredHoleDepth(m) Oil on Cuttings (m3 /m3 ) Oil on Cuttings in Control and Test Wells Control Well Test Well 30% lower average OOC
  • 28.
    Field Results –Fluid Loss and Filter Cake Case 3 1 test well 1300 kg/m3 mineral OBM Location: Off-shore North Sea nfluids.com 28CONFIDENTIAL 0.0 0.5 1.0 1.5 2.0 2.5 3.0 3.5 0.0 0.5 1.0 1.5 2.0 2.5 FilterCakeThickness(mm) HTHPFluidLoss(mLx2) HTHP Fluid Loss and Filter Cake Thickness During Field Pilot Fluid Loss Filter Cake Average fluid loss Average filter cake thickness 55% reduction 29% reduction
  • 29.
    Field Results –Lubricity Case 3 1 test well 1300 kg/m3 mineral OBM Location: Off-shore North Sea DWOB 3D Analytical Model nfluids.com 29CONFIDENTIAL 2200 2300 2400 2500 2600 2700 2800 0.1 0.15 0.2 0.25 0.3 MeasuredHoleDepth(m) Coefficient of Friction (au) Friction Factors in the Test Well Before and After Addition of NPs nForcer added Average COF prior to addition of nForcer Average COF reduced by ~20%
  • 30.
    Field Results –ROP nfluids.com 30CONFIDENTIAL 11000 11500 12000 12500 13000 13500 14000 14500 15000 15500 16000 16500 17000 17500 18000 18500 19000 19500 20000 20500 21000 0 100 200 300 400 500 MeasuredDepth(ft) Rate of Penetration (ft/hr) ROP Control Test 11000 11500 12000 12500 13000 13500 14000 14500 15000 15500 16000 16500 17000 17500 18000 18500 19000 19500 20000 20500 21000 0 10 20 30 40 MeasuredDepth(ft) On Bottom Hours (hrs) On Bottom Hours Control Test 187.6 ft/hr 190.7 ft/hr 233.9 ft/hr 245.7 ft/hr ROP in the lateral section increased by ~25% Case 4 1 test well 1200 kg/m3 brine Location: Williston Basin/Bakken
  • 31.
    Field Results –ROP nfluids.com 31CONFIDENTIAL ROP in the lateral section increased by ~25% 12000 13000 14000 15000 16000 17000 18000 19000 20000 21000 22000 150 200 250 300 350 MeasuredDepth(ft) ROP (ft/hr) Rate of Penetration Test Control #1 Control #2 Control #3 Case 5 1 test well 1200 kg/m3 brine Location: Williston Basin/Three Forks 12000 13000 14000 15000 16000 17000 18000 19000 20000 21000 22000 0 10 20 30 40 50 MeasuredDepth(ft) On Bottom Hours (hrs) On Bottom Hours Test Control #1 Control #2 Control #3 195.1 ft/hr 194.6 ft/hr 196.3 ft/hr 203.4 ft/hr 245.3 ft/hr 202 ft/hr
  • 32.
    Appendix A –Magnetic Interference Test nfluids.com 32CONFIDENTIAL No change observed compared to the baseline
  • 33.
    nfluids.com 33© 2018nFluids Inc. All rights reserved. Thank you jforsyth@nfluids.com aborisov@nfluids.com hwang@nfluids.com nFluids Inc. 253147 Bearspaw Rd Calgary, AB T3L 2P5