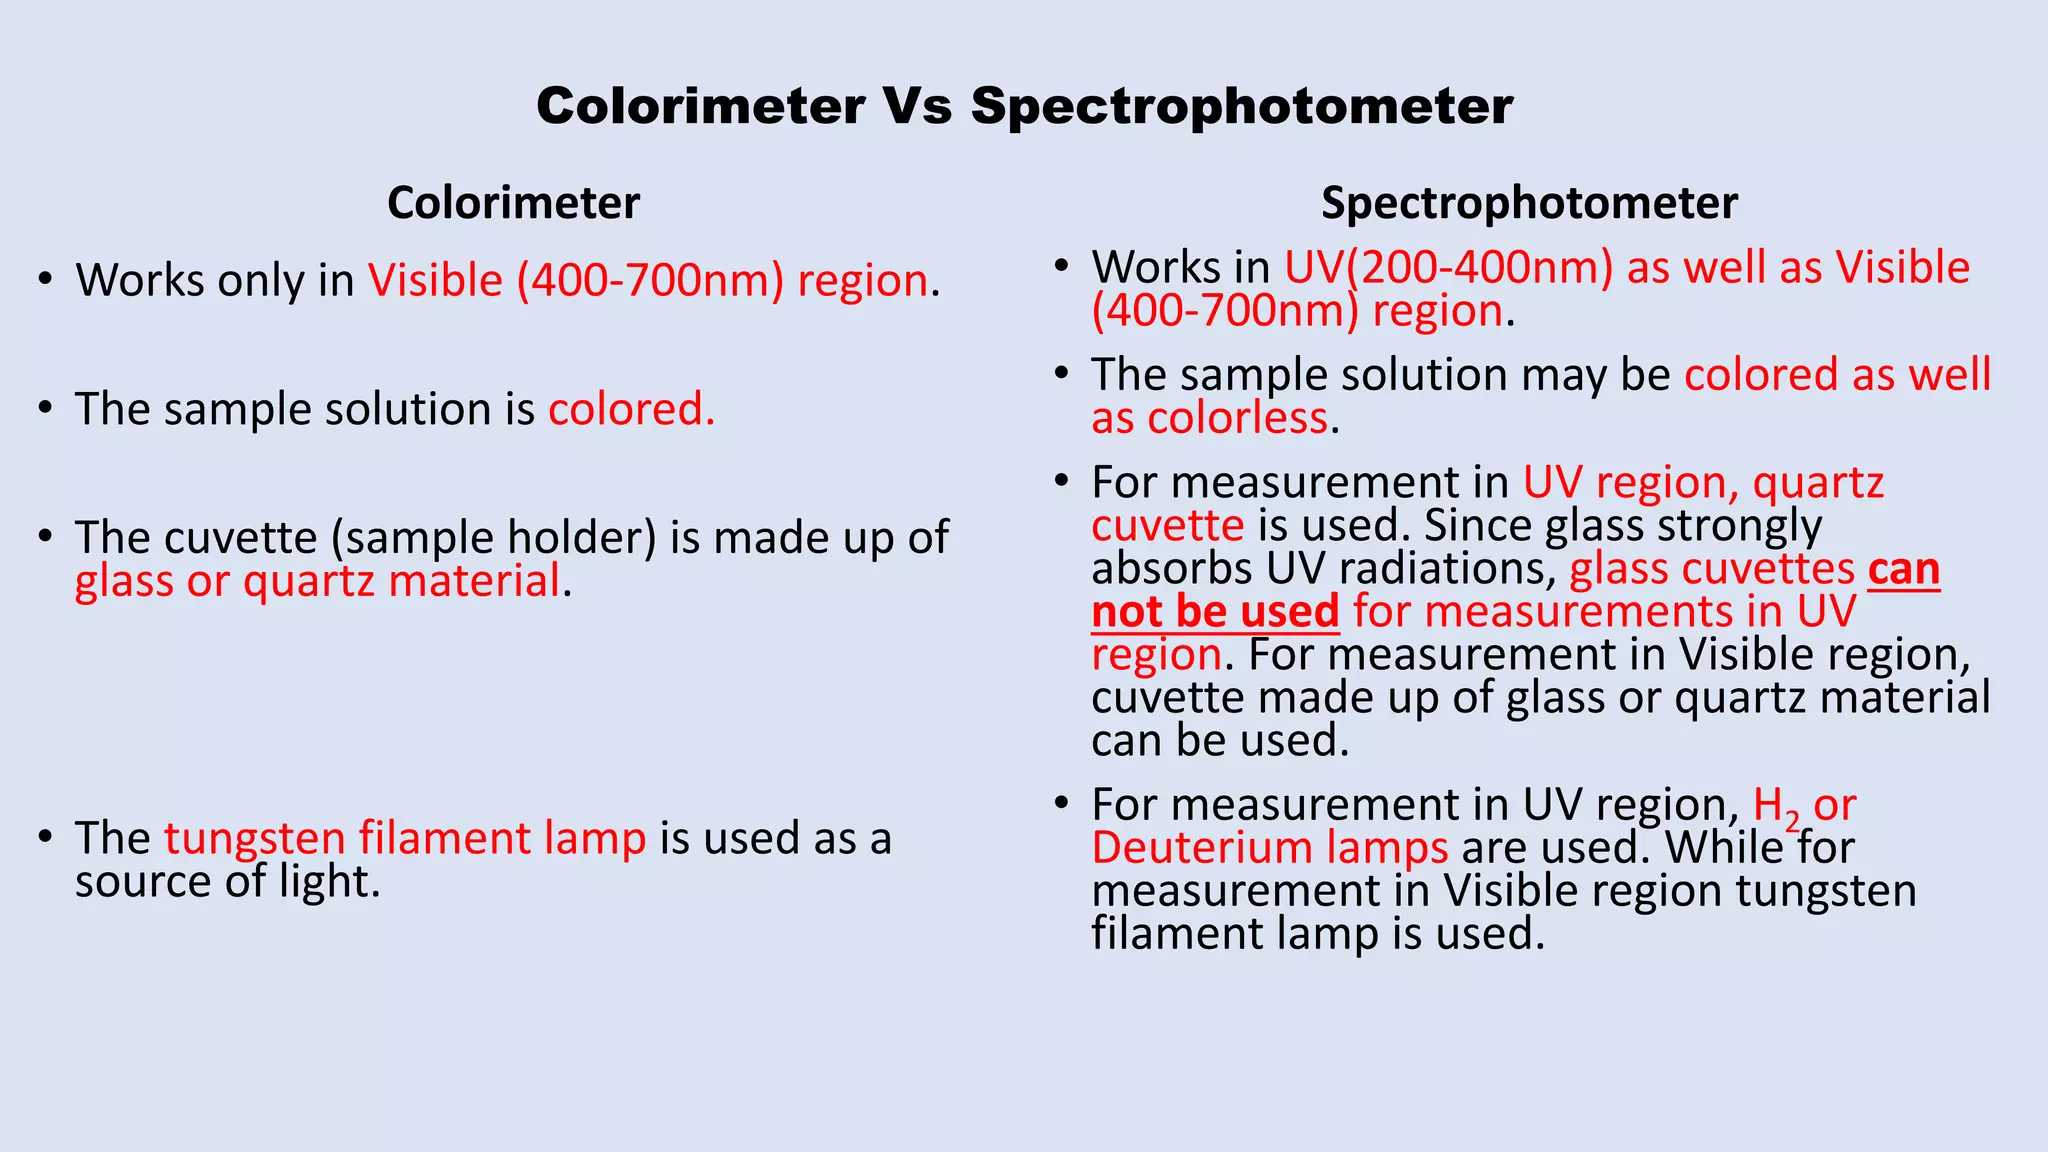
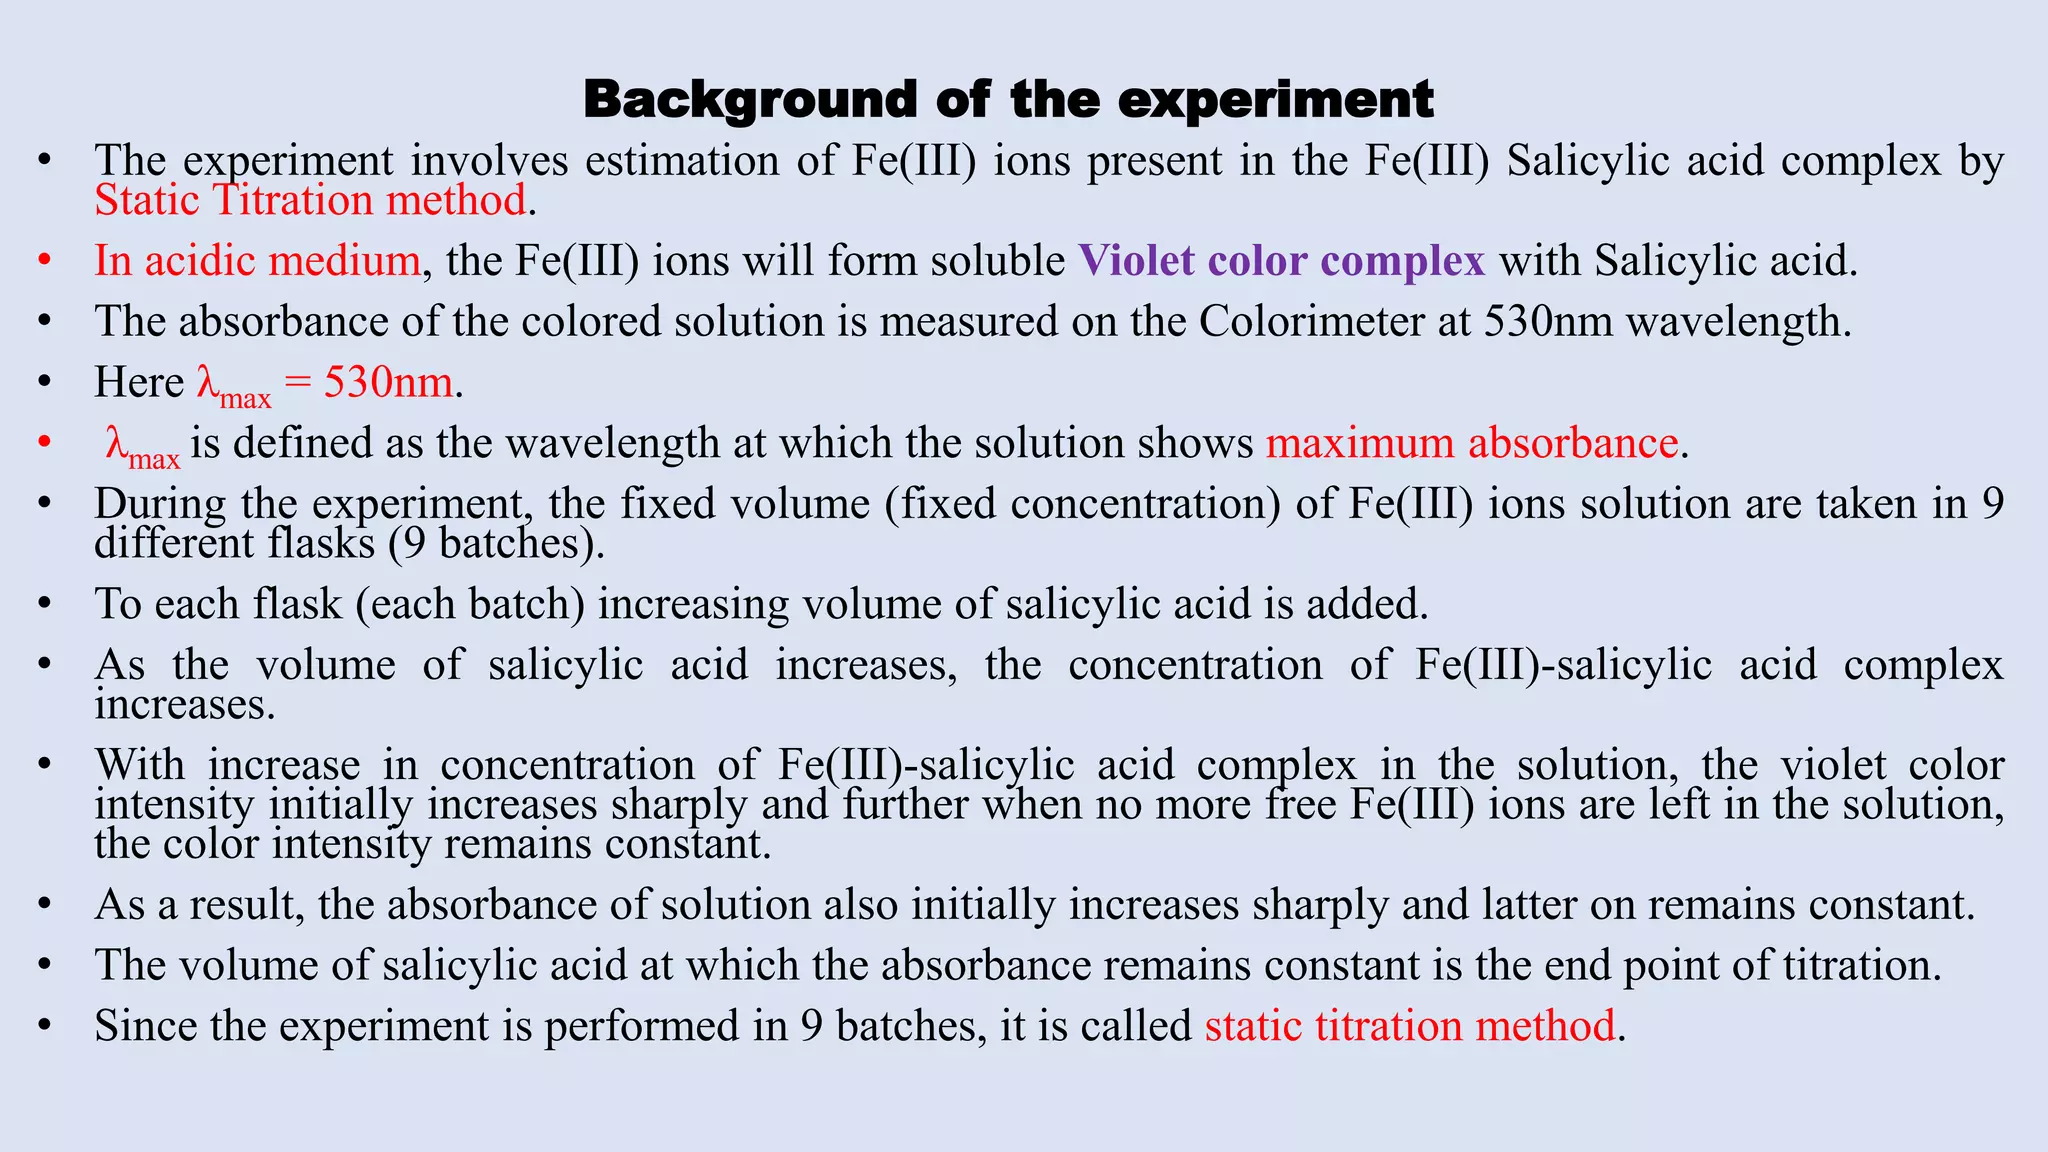
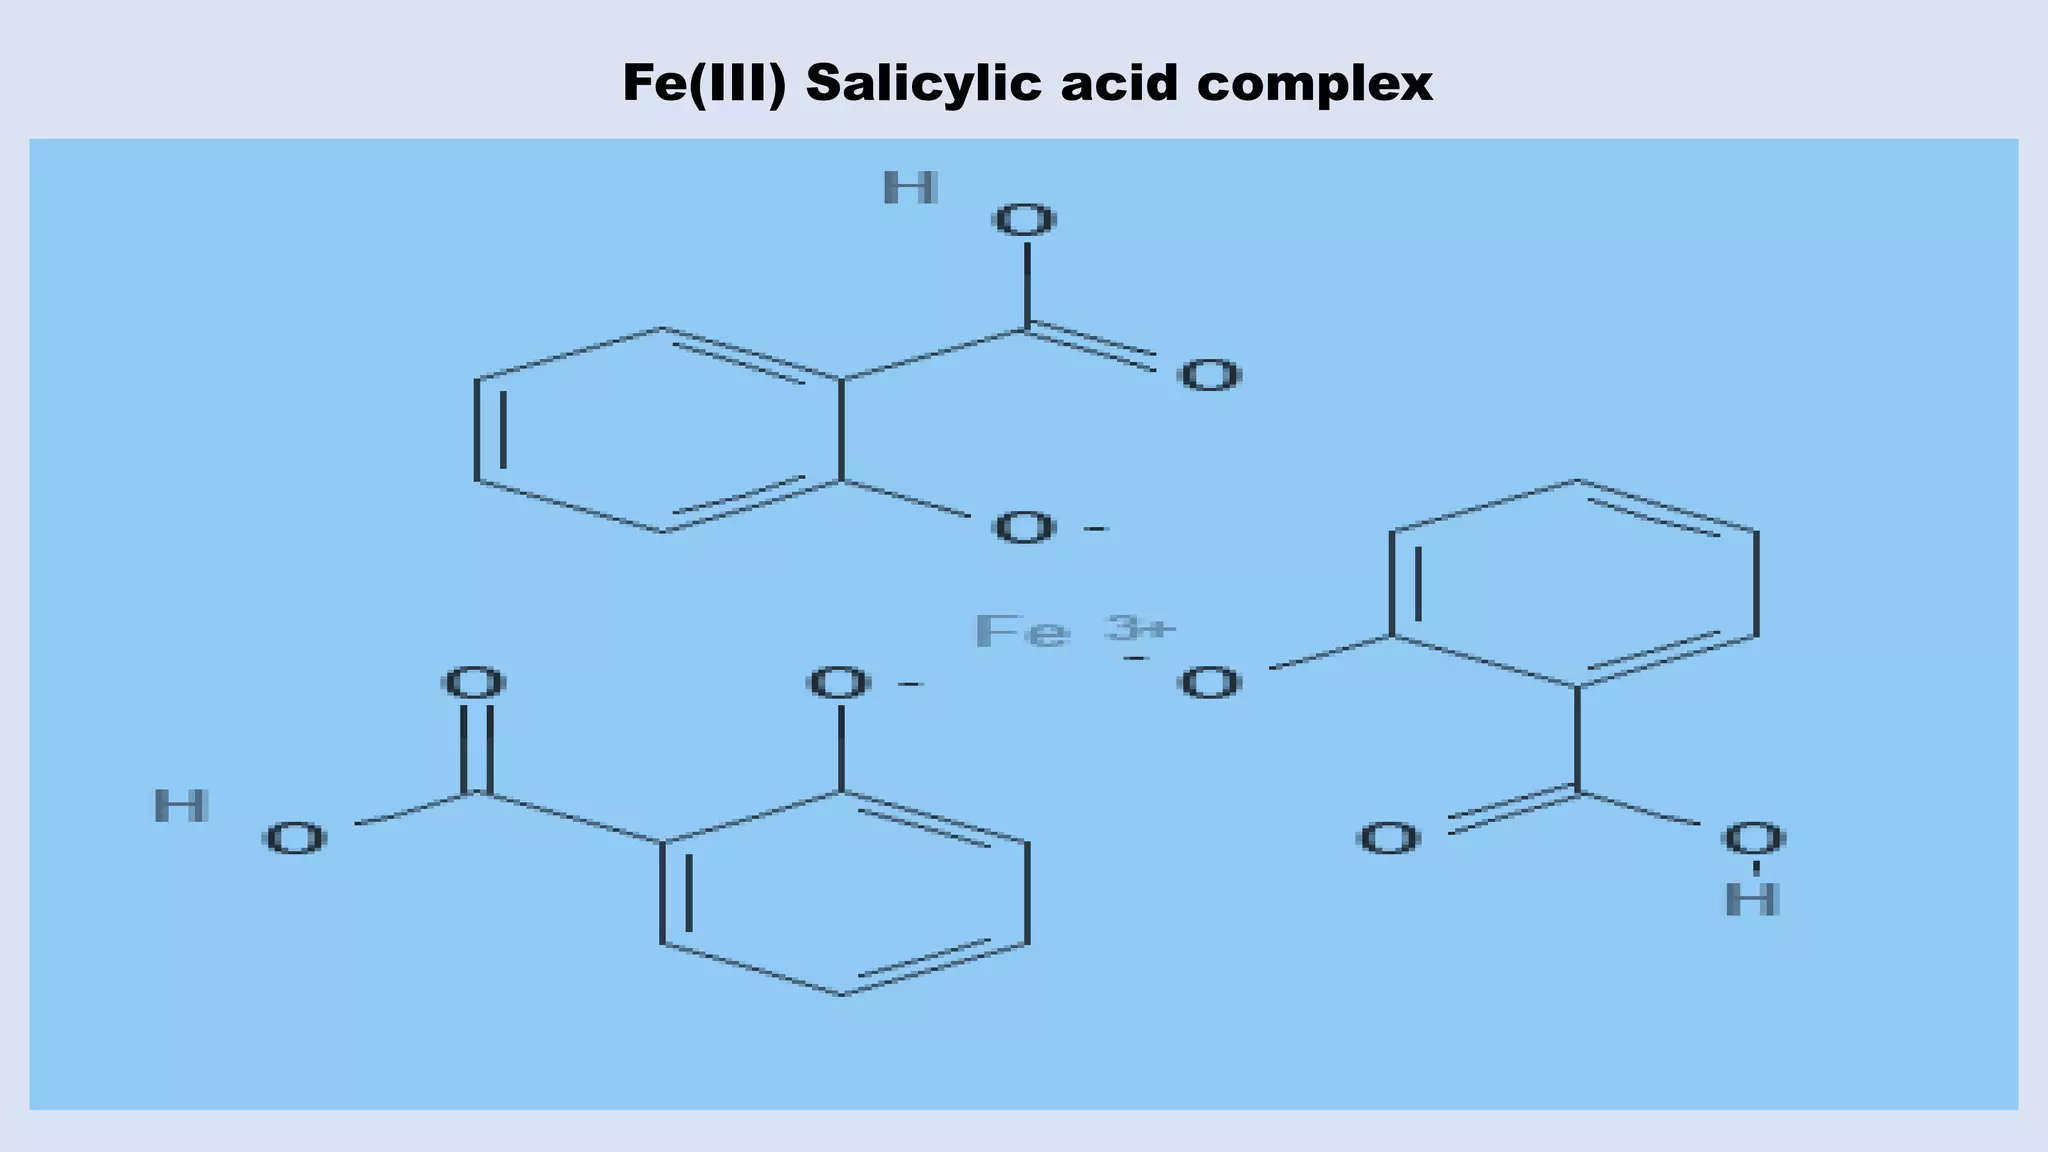
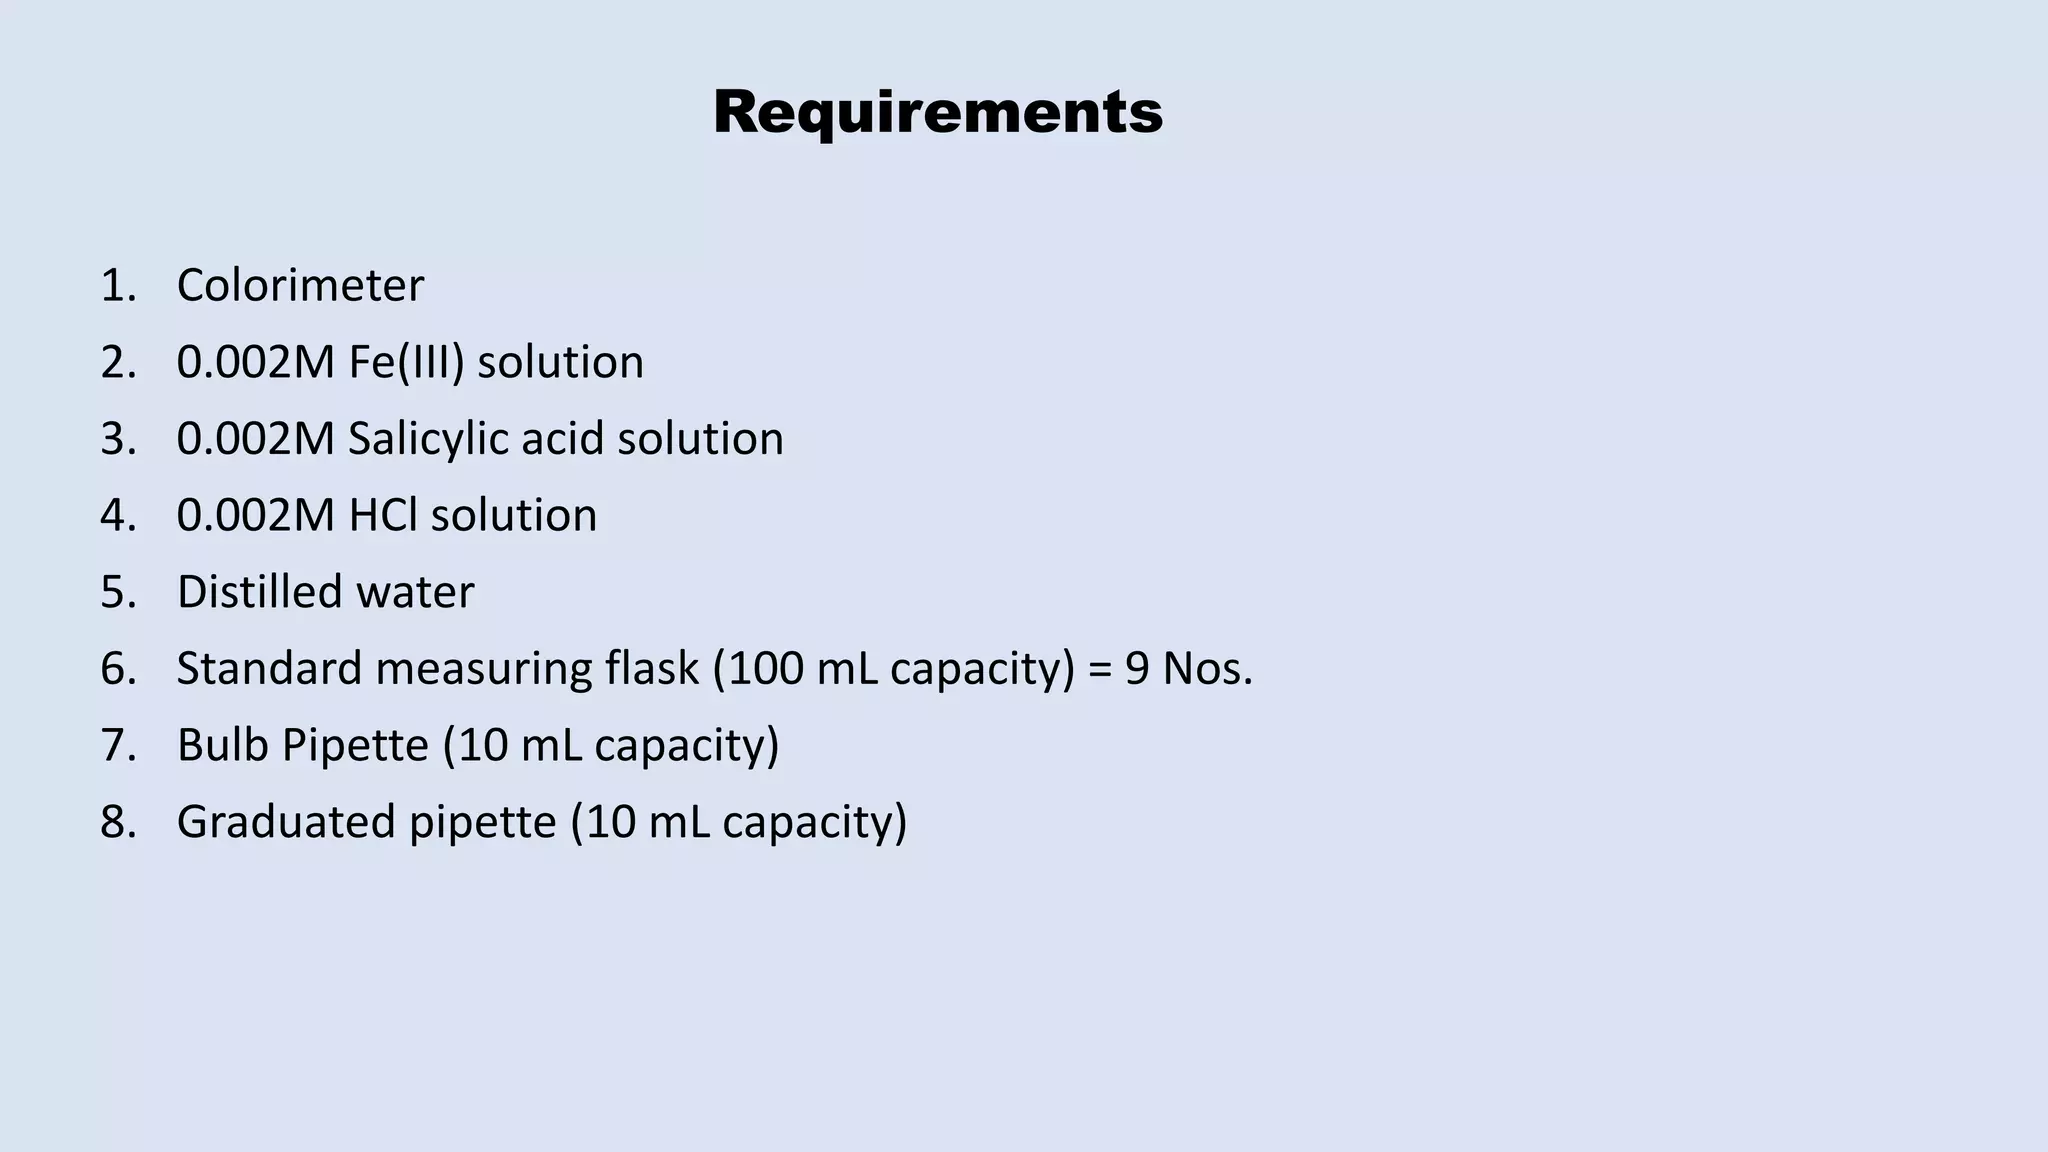
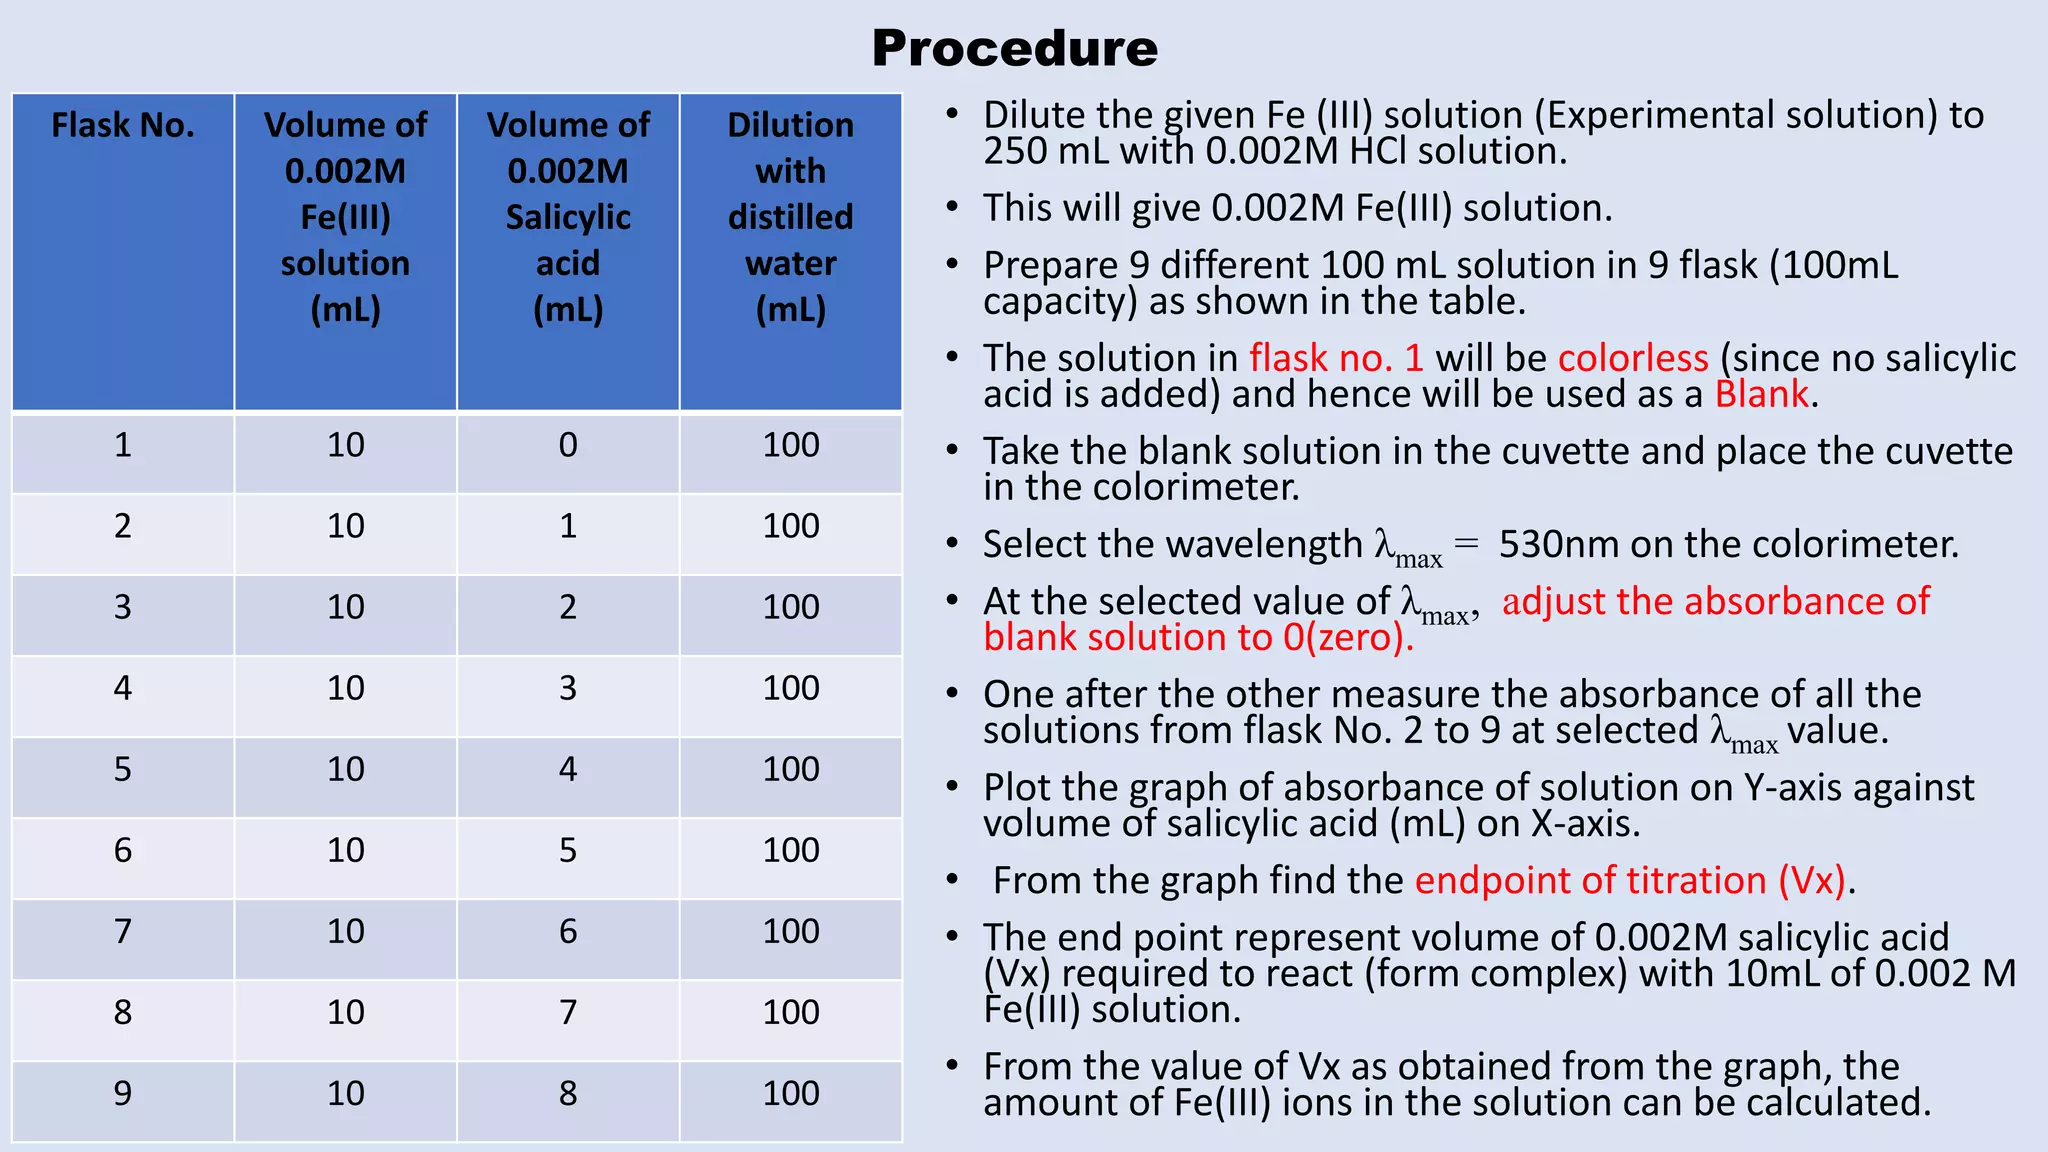
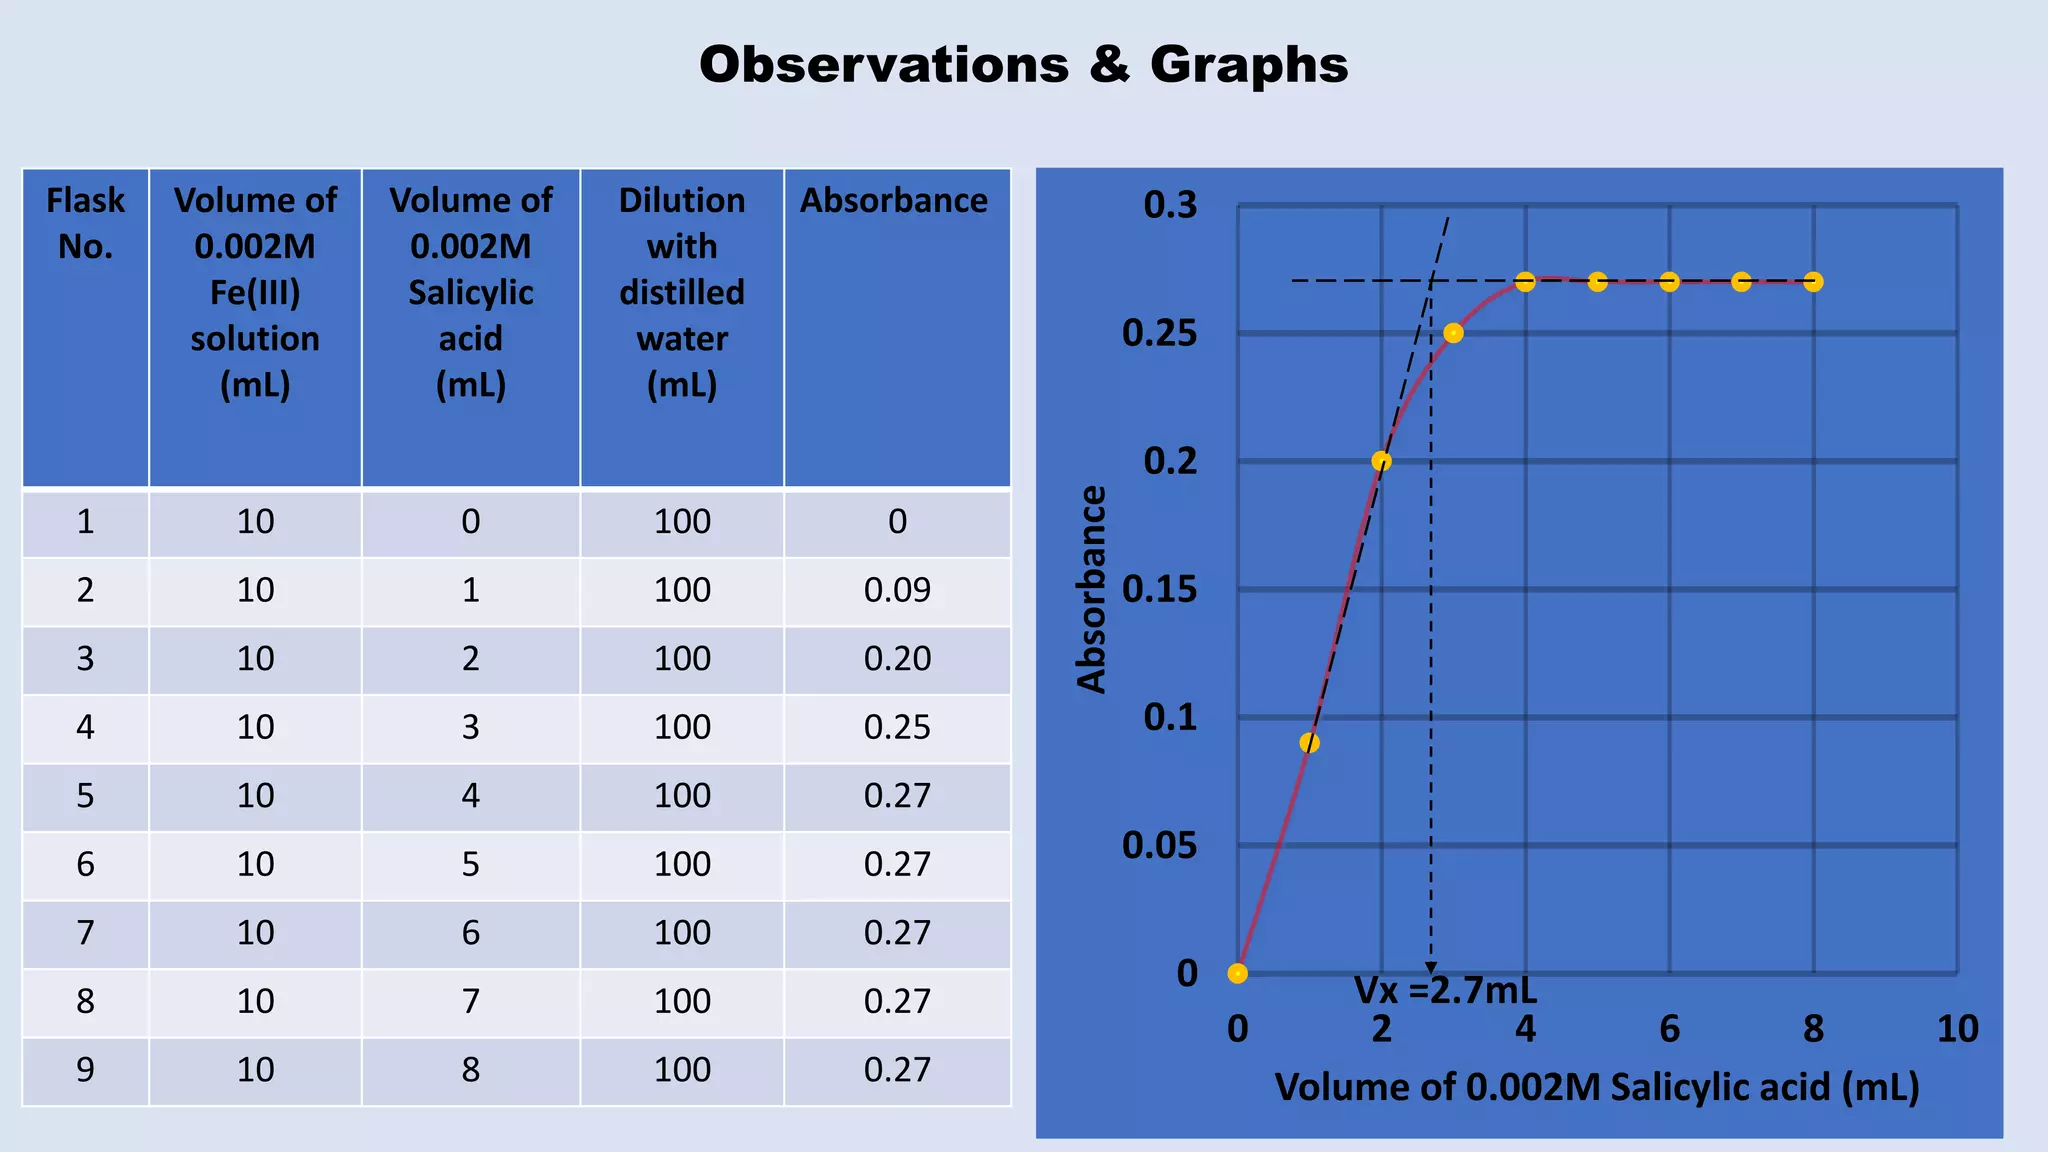
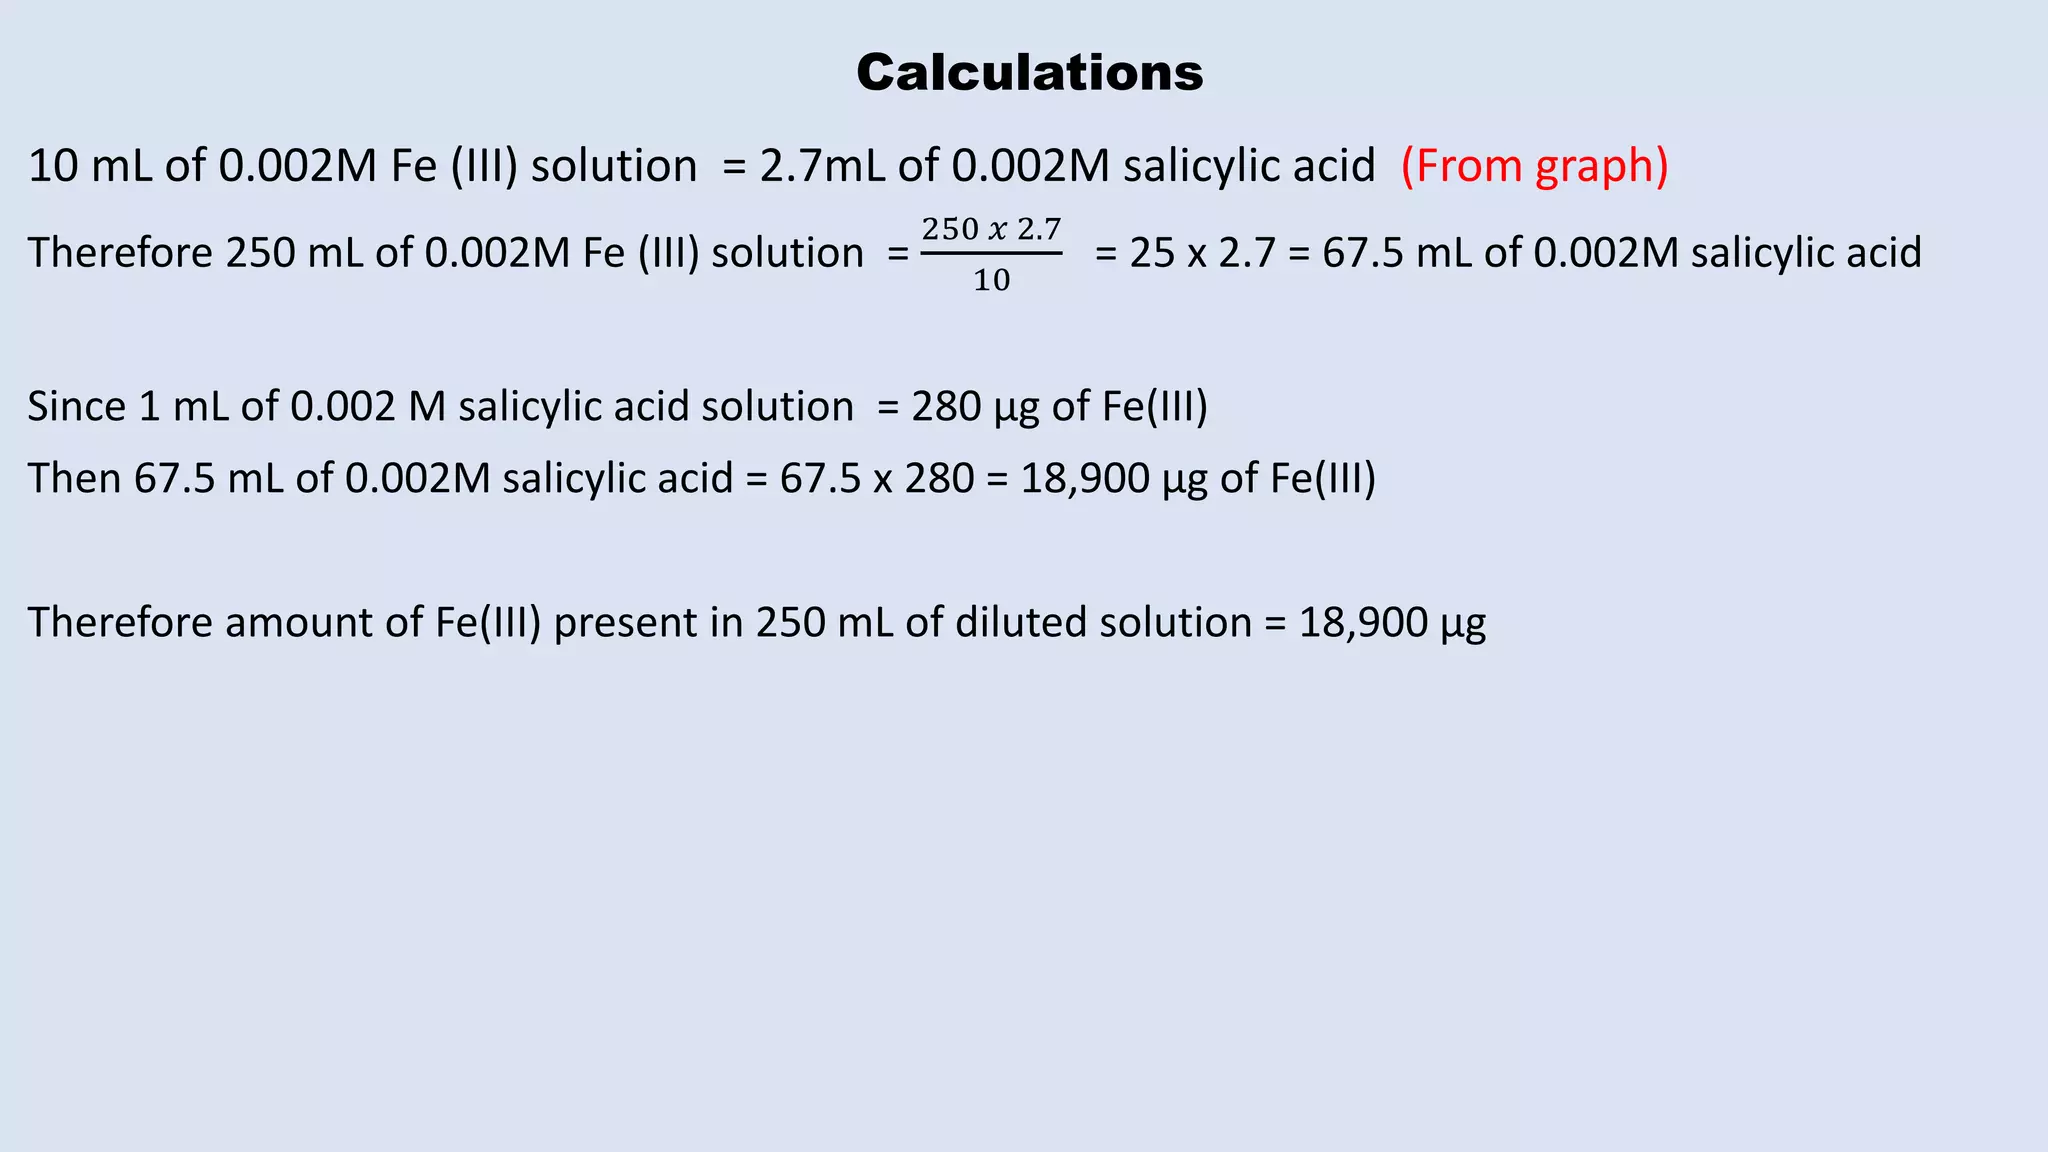
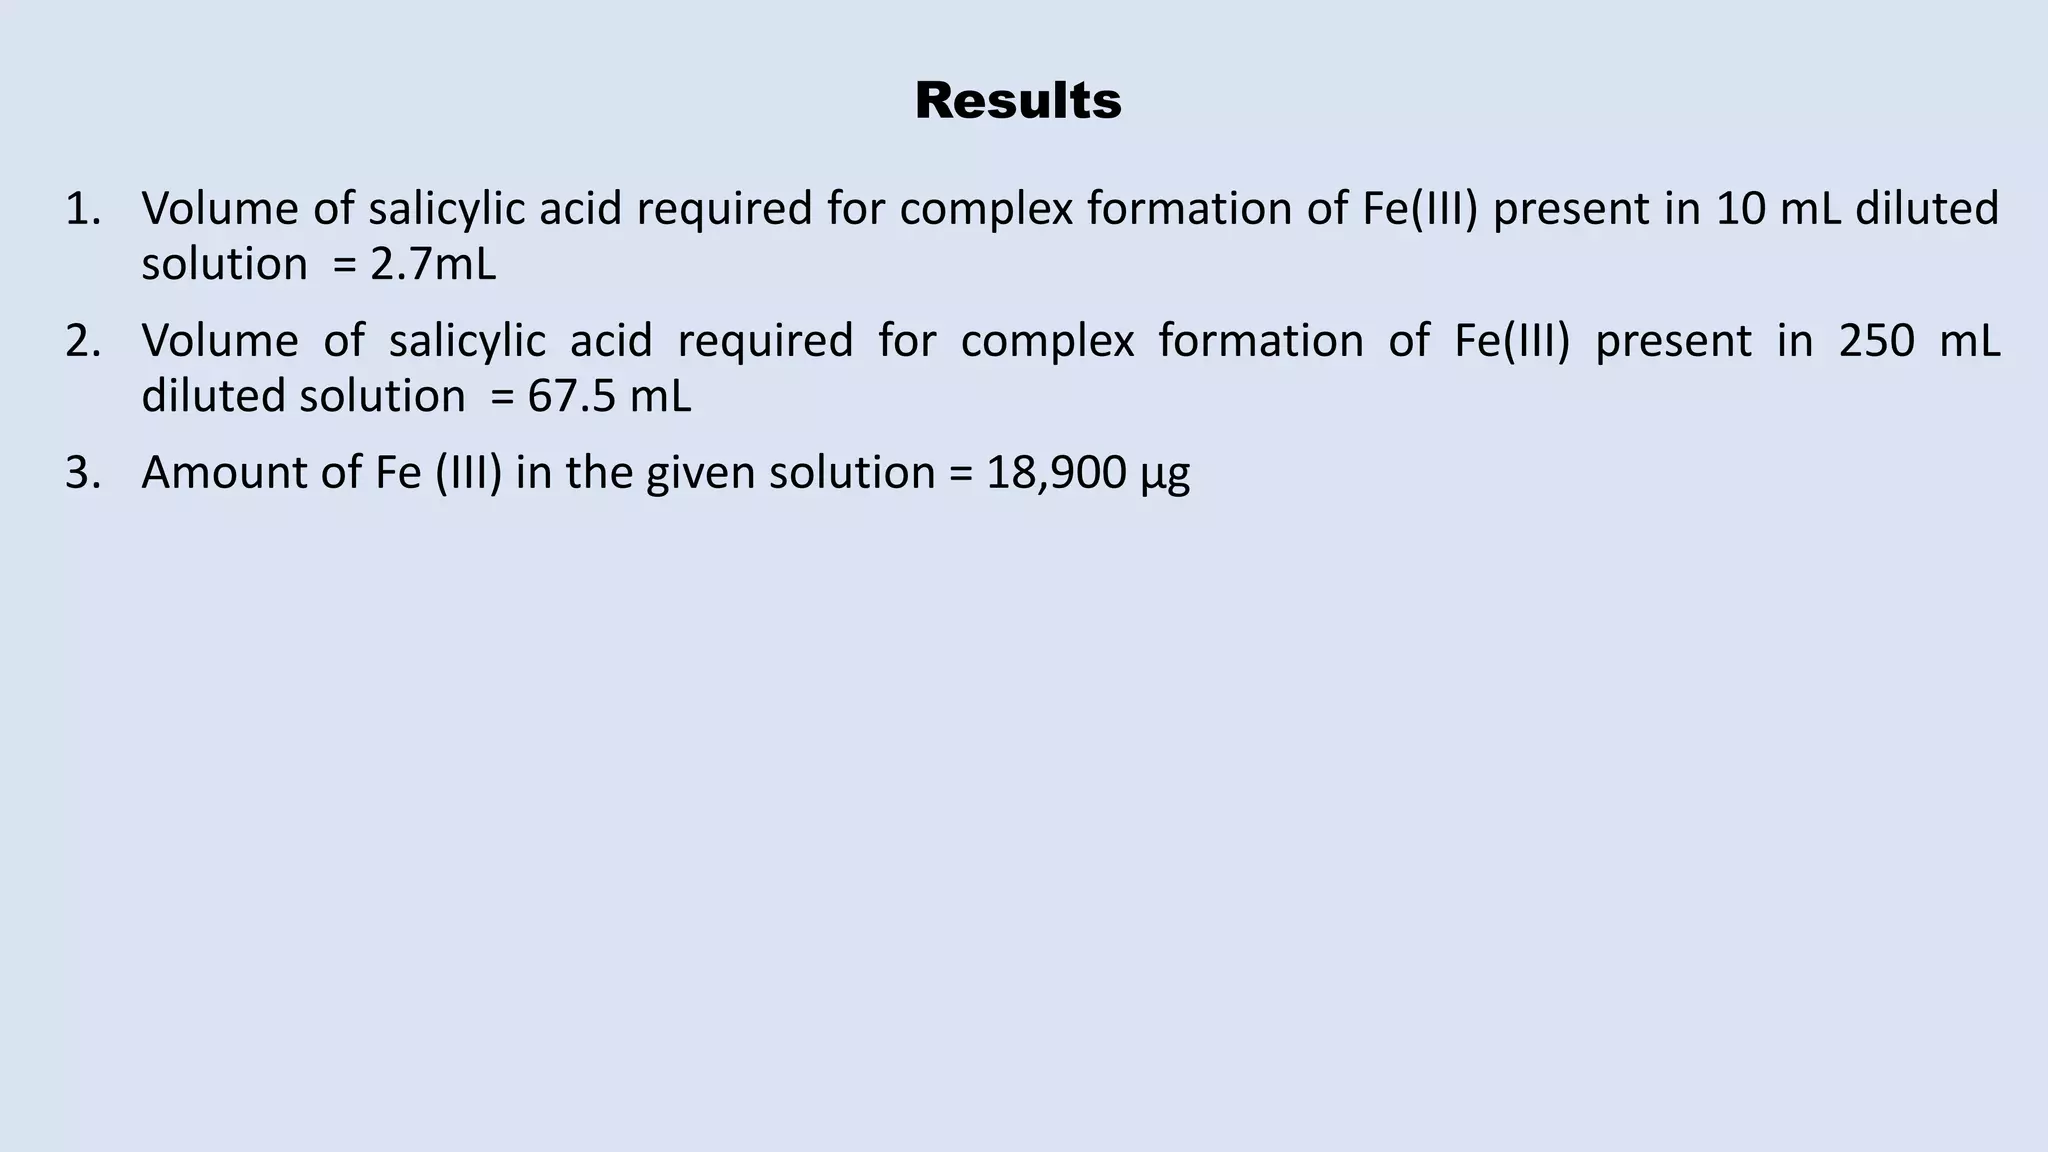
This presentation is based on the experiment for Estimation of fe(lll) ions in the solution by titration against salicylic acid using static method. The presentation will be useful for the Chemistry Undergraduate students of Mumbai University
The document presents an M.O. diagram for the [Co(NH3)6]3+ complex. It shows the metal (Co3+) orbitals interacting with the ligand (NH3) orbitals to form molecular orbitals. The Co3+ has a 3d6, 4s0 electronic configuration. The six ammonia ligands each contribute 2 sigma electrons, for a total of 12 ligand electrons. These interact with the metal orbitals to form the molecular orbital diagram shown, with no pi interactions included.
This document discusses organometallic chemistry and is presented by Dr. Manju Sebastian. It describes the classification of organometallic compounds based on the type of metal-carbon bond formed. The classifications include ionic compounds, compounds with sigma bonds, compounds with pi bonds, and compounds with multicenter bonds. Examples are provided for each classification. Additional topics covered include carbonyl complexes, ferrocene, applications of organometallics as catalysts including the Ziegler-Natta and Wilkinson catalysts.
This document provides instructions for estimating the amount of nickel (Ni) in a sample using complexometric titration with EDTA. The procedure involves:
1) Standardizing a solution of EDTA against zinc sulfate to determine its concentration.
2) Dissolving a nickel sample and filtering the solution.
3) Titrating an aliquot of the nickel solution against EDTA using murexide indicator, which changes color from yellow to red at the endpoint.
4) Calculating the concentration of nickel in the original sample and percentage of nickel in the complex from titration results.
Organometallic Reactions and CatalysisRajat Ghalta
Organometallic compounds undergo a rich variety of reactions (oxidative addition, reductive elimination, cyclometalization, migratory insertion, carbonylation, hydrometallation hydrate elimination, etc ) that can sometimes be combined into useful homogeneous catalytic cycles. In this presentation, I have discussed organometallic reactions of particular importance for synthetic and catalytic processes like the oxo process (hydroformylation), heck coupling reaction, Wilkinson’s Catalyst
(Hydrogenation) etc.
Determine the composition of the fe3+(jobs method)Mithil Fal Desai
1) The document describes an experiment to determine the composition of an iron(III)-salicylic acid complex using Job's method.
2) Job's method involves preparing solutions with varying stoichiometric ratios of the reactants and measuring the absorbance to determine the ratio that forms the maximum amount of complex.
3) The results would show the mole fraction of Fe that gives maximum absorbance, indicating the ratio of Fe to salicylic acid in the complex.
This document provides guidance on qualitative organic analysis, including:
- An overview of the systematic process for identifying unknown organic compounds, from preliminary tests to determining functional groups.
- Details on specific preliminary tests to determine physical properties and the presence of elements like nitrogen, sulfur, and halogens.
- Instructions for conducting solubility tests to group compounds and indicate probable functional groups for further analysis.
Determine the composition of the fe3+(jobs method)Mithil Fal Desai
In Job's method, the variation in concentration of the reactants is performed which can reveal the empirical formula of a complex. The method is employed to find the formula of the compound formed by reacting two or more chemical species. The absorption is recorded against different wavelengths and wavelength having maximum absorption is selected. The intensity of solutions with different stoichiometric ratios of the reactants is measured. The highest observed intensity reveals the maximum amount of compound formed. In this experiment, the Fe3+ and salicylic acid are reacted and the wavelength at which the complex absorbs strongly is selected. The absorbance of the different stoichiometric ration of Fe3+ and salicylic acid at a selected wavelength is determined. The maximum absorbance of the solution of the stoichiometric ratio reveals the empirical formula of the complex as the maximum amount of coloured complex is formed.
Determination of alkalinity of a given mixture of hydroxide and carbonate Mithil Fal Desai
This document provides instructions for determining the alkalinity of a mixture containing OH- and CO32- ions. Two titrations are performed - one using phenolphthalein indicator to find the endpoint for OH- neutralization, and another using methyl orange to find the total alkalinity endpoint. By comparing the two endpoint volumes, the amounts of CO32- and OH- in the original mixture can be calculated. Safety precautions and further reading materials are also listed.
Preparation of potassium trioxalatoaluminate(III) trihydrateMithil Fal Desai
1. The document describes the preparation of the complex potassium trioxalatoaluminate(III) from aluminum metal, oxalic acid, and potassium hydroxide.
2. Aluminum metal reacts with oxalic acid in an alkaline solution to form the complex ion where oxalate ligands bind to aluminum in a six-coordinate structure.
3. The procedure involves dissolving aluminum in potassium hydroxide, adding oxalic acid, crystallizing the product, washing with water and ethanol, and collecting the white crystalline potassium trioxalatoaluminate(III) complex.
This document discusses ligand substitution reactions in octahedral complexes. It describes the main mechanisms of ligand substitution including dissociative (SN1), associative (SN2), and concerted (interchange) pathways. It also discusses hydrolysis reactions and anation reactions as types of ligand substitutions. Specific examples are provided of acid and base hydrolysis in octahedral cobalt complexes, and factors that influence the reaction mechanisms and rates are outlined.
To estimate aluminium by back titration using zinc sulphateMithil Fal Desai
In the complexometric titration of Al3+, excess of EDTA is reacted with Al3+ to form Al-EDTA complex. The unreacted EDTA can be determined by titrating it with a standard solution of Zn2+ using EBT indicator. The pH of the solution is maintained at around 10 using ammonia buffer. The indicator color in the buffer is blue, while the Zn-indicator complex appears wine red. The exact concentration of EDTA salt solution is determined by titrating it with a standard solution of Zn2+ at pH 10, using EBT indicator
Wilkinson's catalyst, chlorotris(triphenylphosphine)rhodium(I), is an organometallic catalyst that is very effective for the homogeneous hydrogenation of unsaturated compounds at room temperature and atmospheric pressure. Its mechanism involves five steps - ligand dissociation, oxidative addition of hydrogen, alkene coordination, migratory insertion, and reductive elimination - known as Tolman's catalytic cycle. This cycle allows the catalyst intermediates to shuttle between 18 and 16 electron configurations, making the electron shifts energetically favored.
This document presents information on the Tanabe-Sugano diagram, which is used in coordination chemistry to predict absorptions in the UV-visible and IR spectra of coordination compounds. It was developed by Yukito Tanabe and Satoru Sugano in 1954 to explain the absorption spectra of octahedral complex ions. The diagram plots orbital energy as a function of the Racah parameter B versus the ligand field splitting parameter Δo/B. It can be used to determine the ordering of electronic states and predict possible electronic transitions based on parameters like Δo, Racah parameters B and C, symmetry rules, and term symbols of electronic configurations. The diagram has advantages over earlier Orgel diagrams in that it can be applied to
PTC IS THE PHASE TRANSFER CATALYSIS HERE TYPES OF PTC ARE DISCUSSED , THEORIES OF CATALYSIS AND MECHANISM OF PTC, ADVANTAGES OF PTC, APPLICATION OF PTC
This document describes the procedure for determining the strength of a strong acid using pH-metric titration. The titration involves adding a strong base (NaOH) to a strong acid (HCl) until the equivalence point is reached. The pH is measured after each addition of base. By determining the volume of base required to reach the equivalence point and using the concentrations of the acid and base, the concentration of the original acid solution can be calculated. Calibrating the pH meter using buffer solutions ensures accurate pH measurements during the titration.
The document discusses the Linear Free Energy Relationship known as the Hammett Equation. It describes how the Hammett Equation can be used to investigate organic reaction mechanisms by studying the effects of substituents on reaction rates. The key aspects are:
1) The Hammett Equation relates the logarithm of reaction rates or equilibrium constants to substituent constants (σ) using the reaction constant (ρ).
2) σ values describe electronic properties of substituents, with electron-withdrawing groups having positive σ and electron-donating groups having negative σ.
3) ρ indicates how sensitive a reaction is to substituents, relating the electronic demand of the reaction transition state. Its sign and magnitude provide insight into
Preparation of tetraaminecopper(ii) sulphate complexMithil Fal Desai
This document provides instructions for preparing tetraaminecopper(II) sulfate complex in 3 steps:
1) Dissolving copper sulfate in water and adding ammonium hydroxide to form an intense blue solution.
2) Adding ethanol and heating the solution to obtain a clear deep blue solution.
3) Allowing the hot solution to crystallize for an hour, filtering and drying the blue-purple tetraaminecopper(II) sulfate crystals. Yield of the product is then determined.
This document discusses various types of redox titrations and indicators used. It describes the preparation and standardization of common redox titrants like potassium manganate(VII), iodine, potassium dichromate, potassium bromate and ceric ammonium sulfate. Examples of titrations included are standardization of KMnO4 with sodium oxalate or sodium thiosulfate, iodine with sodium thiosulfate or arsenic trioxide, and sodium thiosulfate with potassium iodate. The document also covers redox indicators and conditions for iodometric titrations.
1) 1,3-Dithiane is a heterocyclic disulfide compound that is prepared through the reaction of dithiols with carbonyl compounds.
2) It has many synthetic applications and is used to synthesize ketones, aldehydes, and cyclic ketones through reactions such as addition of organolithium reagents to the dithiane ring.
3) Specifically, the document discusses how lithiated 1,3-dithiane can react with alkyl halides, aryl halides, alkyl dihalides, aldehydes and ketones to form substituted dithiane derivatives that can then be hydrolyzed to form various ketones and aldehydes.
The document discusses sodium cyanoborohydride (NaBH3CN), including its preparation from sodium borohydride and hydrogen cyanide, properties such as being a less reactive reducing agent than sodium borohydride, solubility in solvents like THF and methanol, and ability to reduce protonated aldehydes and ketones at pH 3 but not neutral aldehydes and ketones. Main applications of sodium cyanoborohydride include its use as a reducing agent in organic synthesis reactions.
Coulometry is an electroanalytical technique that measures the quantity of electricity required for a chemical reaction. There are two main types - controlled potential coulometry (potentiostatic coulometry) and controlled current coulometry (galvanostatic coulometry). Controlled potential coulometry involves holding the working electrode at a constant potential to allow exhaustive electrolysis of the analyte without interfering reactions. The quantity of electricity passed is proportional to the analyte concentration and is measured with an electronic integrator. Applications include determination of metal ions, microanalysis, and analysis of radioactive materials like uranium.
In complexometric titrations, initially the indicator forms a metal indicator complex with metal ions which is less stable compared to the metal-EDTA complex. Hexadentate ligand like EDTA acts as a chelating agent that complex with the metal ions in the solution. When all the metal ions form a complex with a chelating agent, the original colour of the indicator in the buffer is observed which reflects the endpoint of the titration
This document discusses organic reagents used in inorganic analysis. It begins by defining organic reagents as organic compounds used qualitatively to detect ions or molecules, and quantitatively to estimate them. It then discusses the history of organic reagent use dating back to the 17th century. Finally, it covers the properties, reactions, applications and classifications of various organic reagents used in gravimetric, titrimetric, and other analytical methods.
1. The document describes the synthesis and characterization of potassium tris oxalato chromate (III) trihydrate (K3[Cr(C2O4)3].3 H2O). Potassium dichromate and oxalic acid are reacted according to the given equation to produce the deep green complex salt.
2. The complex salt is analyzed to determine its percentage of water, chromium and oxalate content. Spectroscopic characterization includes recording the UV-visible, FT-IR spectra and thermogram to further analyze the complex.
The document provides information about electroanalytical methods of analysis. It defines electroanalytical methods as techniques that study analytes by measuring potentials or currents in an electrochemical cell containing the analyte. It discusses various types of electroanalytical techniques including potentiometry, voltammetry, and Karl Fischer titration. It provides details on the principles, instrumentation, applications, and advantages of these analytical methods.
Estimation of chromium (vi) by spectrophotometric methodPRAVIN SINGARE
This presentation is based on Estimation Of Cr(VI) by using Diphenyl carbazide using a spectropohotmeter.
The experiment is related to Chemistry undergraduate syllabus of Mumbai University
Photometry is used to measure light intensity and is applied in techniques like colorimetry, spectrophotometry, and turbidometry. Colorimetry determines concentrations of colored compounds by measuring light absorbed at visible wavelengths. It follows Beer's and Lambert's laws - the amount of light absorbed increases exponentially with increasing concentration and path length. A colorimeter consists of a light source, monochromator/filters, sample holder, detector, and readout. It is used to estimate biochemical compounds in body fluids through color reactions.
This document provides information about using a spectrophotometer to analyze compounds. It discusses key concepts like:
- Absorbance increases linearly with concentration according to Beer's Law (A = εcl)
- Transmittance and absorbance can be converted between each other using mathematical relationships
- Common absorbing biochemicals like nucleic acid bases and amino acids each have characteristic absorption spectra
- Obtaining a spectrum of an unknown dye allows identification by comparing peaks to sample spectra
- A standard curve relating absorbance to concentration can be used to determine the concentration of unknown samples
The document then provides guidance on experiments students will perform to obtain a spectrum of an unknown dye, calculate its extinction coefficient, generate a standard
Photometry techniques like colorimetry, spectrophotometry, and turbidometry measure the intensity of light absorbed or transmitted by a solution. Colorimeters contain a light source, monochromators/filters to select wavelengths, a sample holder (cuvette), photodetectors, and readout devices. The amount of light absorbed follows Beer's and Lambert's laws - absorption increases exponentially with concentration and path length. A colorimeter is used to quantify compounds in biological samples like blood and urine by measuring absorbance and relating it to a standard curve using the Beer-Lambert law. Colorimeters provide a simple and inexpensive way to perform quantitative analysis of colored compounds.
Determination the Calibration Curve of Cobalt Nitrate by SpectrophotometerHaydar Mohammad Salim
This document describes an experiment to determine the calibration curve of cobalt nitrate using a spectrophotometer. Key steps include preparing cobalt standard solutions of known concentrations, measuring their absorbance, and using the results to construct a calibration curve relating absorbance to concentration. The calibration curve will then allow determination of the concentration of an unknown cobalt solution based on its measured absorbance. The document provides background on spectrophotometry and Beer's Law, which states that absorbance is directly proportional to concentration and path length.
Analysis of Copper In a Brass SampleINTRODUCTIONA. GEN.docxdaniahendric
Analysis of Copper In a Brass Sample
INTRODUCTION
A. GENERAL
In this experiment the percentage of copper present in a brass sample will be
determined spectrophotometrically using a Spectronic 20.
Brass is an alloy consisting of tin, lead, copper, and zinc. The brass sample,has
already been ground to a fine powder.
A standard curve (graph) will be made for Cu'^^ in which a plot of absorbance
(instrument reading from the Spectronic 20) versus molarity of Cu'*"^ for various
solutions will be made. These standard Cu"''^ solutions will be made by dissolving
the appropriate amount of CuS04*5H20 in distilled water. The brass samples will
be made by dissolving the brass in concentrated HNO3 to produce Pb"*'^, Cu"^^, and
Zii^^ in solution along with the finely divided white hydrated tin (IV) oxide solid.
After the properly prepared solutions have been filtered to remove the tindV) oxide,
the absorbance of these solutions will be measured using the Spectronic 20. The
molarity of Cu"^^ in these solutions will be obtained from the standard curve. Then
the percent copper in the brass sample will be calculated.
Before starting this experiment you should read Appendix VIII concerning the
concentration unit: Molarity.
B. METHOD OF ANALYSIS
In each of the five solutions (three for determining the standard curve and two for
the determination of copper in brass) the molarity of Cu"^^ present will be deter
mined spectrophotometrically using the Bausch & Lomb Spectronic 20. The only
species in the solution that absorbs at 620 mp (this wavelength corresponds to the
visible portion of the electromagnetic waves) is Cu"^^. In this aqueous solution Cu"^^
is really present as the aquo complex [Cu(H20)6]+2. The other species, Pb"^^,
H"^, NOs", S04~2, and H2O do not absorb at the 620 mp wavelength of light (and tin
is precipitated as hydrated tin (IV) oxide).
lo
FIGURE 1
Solution
Containing
In the Spectronic 20, light of wavelength of 620 mp. and certain initial inten
sity, Iq, see (Fig. 1) is allowed to pass through the sample. The wider the sample tube
(width = b) and the greater the molarity (M) of Cu"^^, the more absorption will occur
causing the intensity of the 620 mp wavelength (I) to be less as it leaves the solution.
The following equation describes the process quantitatively:
A = logi = abM
where A = absorbance (quantity actually measured by the Spectronic 20), M =
molarity of the absorbing species (Cu"*"^ in this experiment), b = tube diameter, and
a constant which is characteristic of each absorbing species. Since the same tube
(a special tube called a cuvette is used for spectrophotometry) is used throughout
the experiment, b remains constant. Hence, we can define a new constant, K = ab.
Therefore, the above equation becomes;
A = KM = K[Cu+2i
A plot of A (the absorbance value measured by use of the Spectronic 20) versus the
molarity of Cu"^^ should be a straight line going through the origin (A = 0.000 and
M= 0.000).
Three standard Cu"'"^ ...
This document discusses the principles of colorimetry, specifically Beer's Law and Lambert's Law. It describes how colorimetry can be used to quantitatively estimate the concentration of a colored substance or solution. The amount of light absorbed by a solution is directly proportional to its concentration and path length. This relationship can be expressed by the formula A=ɛ x C x L, where A is absorbance, ɛ is the molar extinction coefficient, C is concentration, and L is path length. The document also provides details on the hardware components of a colorimeter and describes procedures to generate a calibration curve and use it to determine the concentration of an unknown sample.
The document describes an experiment using ultraviolet-visible spectroscopy to determine the concentration of salicylic acid solutions. Serial dilutions of a 0.1% stock solution were prepared and their absorbances measured. A linear relationship between absorbance and concentration was observed, allowing an unknown sample's concentration to be determined. Sources of error include non-ideal behavior at high concentrations where absorbance may not follow Beer's Law perfectly.
This document provides instructions for titrating HCl against a standard NaOH solution potentiometrically. A known volume of HCl is placed in a beaker and connected to a saturated calomel electrode and hydrogen electrode. Small additions of NaOH are made from a burette and the potential is measured after each addition. The potential readings are plotted against volume added to obtain the titration curve. The equivalence point is identified as the point of maximum slope on the curve or differential curve, indicating where the H+ concentration has changed the most with small volume additions of NaOH base. The experiment allows for the potentiometric titration of a strong acid against a strong base.
This document provides data from a gas chromatography experiment analyzing the peaks of pentafluorobenzene. It includes the relative retention times and peak areas of pentafluorobenzene and an internal standard, as well as calibration curves constructed from these data. It directs the student to calculate linear regression statistics, determine concentrations from the calibration curves, and calculate standard deviations. The key information is that relative retention times and peak area ratios to an internal standard were used to identify an unknown compound and calculate its concentration through linear calibration curves.
UV-visible spectroscopy involves using ultraviolet or visible light to analyze molecular structure and dynamics through light absorption, emission, or scattering. A spectrophotometer measures the amount of light transmitted through a sample. Absorption causes the sample's color, as molecules absorb all wavelengths except the color observed. UV-VIS spectrophotometers use light from 200-350 nm or 350-700 nm. Beer's Law states absorbance is proportional to concentration and path length. A standard curve relating absorbance and concentration of known standards is used to determine unknown concentrations. Accuracy requires testing standards and controls repeatedly.
To estimate the concentration of KMnO4 and CuSO4 solutions, colorimetricallyMithil Fal Desai
This document outlines a procedure to estimate the concentration of potassium permanganate (KMnO4) and copper sulfate (CuSO4) solutions using a colorimeter. Standard solutions of varying concentrations of each compound are prepared. The absorbance of each standard solution is measured using different colorimeter filters to select the filter with the highest absorbance. A calibration curve of absorbance versus concentration is plotted for each compound. The absorbance of unknown solutions is then measured and the concentrations are determined using the calibration curves. The procedure aims to estimate the unknown concentrations of KMnO4 and CuSO4 colorimetrically based on the Beer-Lambert law relationship between absorbance and concentration.
This document discusses spectrophotometry techniques for measuring light absorption by molecules. It covers the electromagnetic spectrum, Beer-Lambert law, applications of UV-vis spectroscopy like determining cell density and protein concentration, and methods for measuring absorbance of molecules like DNA, RNA, proteins, and other biological compounds. Key concepts explained include the relationship between absorbance, molar extinction coefficient, concentration, and path length in the Beer-Lambert law.
The document discusses colorimetry and spectrophotometry. Colorimetry uses photometric principles to measure the intensity of light absorbed or transmitted by colored compounds. It relies on Beer's Law, which states that absorbance is directly proportional to concentration. Spectrophotometry uses a monochromator to isolate specific wavelengths from a light source and measure absorption across the electromagnetic spectrum. It provides more accurate measurements than colorimetry due to its ability to select narrow bandwidths of light and minimize stray light. Both techniques are used to determine concentrations of analytes in solutions.
A colorimeter measures the intensity of light absorbed or transmitted by a sample at different wavelengths to calculate concentration. It works by passing light through a sample and measuring the transmitted intensity, comparing it to a reference sample. The measurement relies on Beer's Law and Lambert's Law relating absorption to concentration. A colorimeter is used in fields like healthcare, manufacturing, food/water testing to quantify substances like proteins, glucose, chemicals, colorants.
Analytical techniques. An overview of chromatography and spectroscopy Adjoa Amponfi
This document provides an overview of instrumental analytical techniques, focusing on chromatography and spectroscopy. It describes various chromatographic techniques including thin layer chromatography, column chromatography, gas chromatography, and high performance liquid chromatography. It also outlines several spectroscopic techniques, such as atomic absorption spectroscopy, colorimetry, and UV-visible spectroscopy. The document explains the basic principles, applications, and procedures for these analytical methods.
This document discusses spectrophotometry and the Beer-Lambert law. It provides:
1) An overview of how spectrophotometers work by measuring the absorption of light by chemical compounds and relating absorption to concentration according to the Beer-Lambert law.
2) A description of the basic components of a spectrophotometer including a light source, wavelength selector, sample cuvette, detector, and readout device.
3) Explanations of how to prepare and measure standards to generate a calibration curve to determine unknown concentrations.
Similar to Estimation of fe(lll) ions in the solution by titration against salicylic acid using static method (20)
Catalysts accelerate chemical reactions while remaining unchanged. There are two types of catalyzed reactions: heterogeneous, where reactants and catalysts are in different phases, and homogeneous, where they are in the same phase. Catalysts lower activation energy and increase reaction rate without affecting products or equilibrium. They are often specific to certain reactions. Promoters increase catalytic activity while inhibitors decrease it. Poisons deactivate catalysts permanently or temporarily. Enzymes are biological catalysts that catalyze specific biochemical reactions optimally at 15-25°C. Acid and base catalysts donate or accept protons to facilitate reactions.
Determine the velocity constant of alkaline hydrolysis of ethyl acetate by co...PRAVIN SINGARE
This experiment is based on the experimental demonstration of Determine the velocity constant of alkaline hydrolysis of ethyl acetate by conductometric method. The presentation is made for the chemistry undergraduate students of Mumbai University.
Determination of the order of reaction between potassium persulphate & potass...PRAVIN SINGARE
This presentation is based on the experimental demonstration of "Determination of the order of reaction between potassium persulphate & potassium iodide by fractional change method". The presentation is for chemistry Undergraduate student of Mumbai University.
Determination of the molecular weight of high polyvinyl alcohol (pva) by visc...PRAVIN SINGARE
This presentation is based on demonstration on the Determination of the molecular weight of high polyvinyl alcohol (pva) by viscosity method. The presentation is made for Undergraduate Chemistry Students of Mumbai University
This document provides an introduction to molecular spectroscopy and rotational spectroscopy. It discusses how electromagnetic radiation interacts with molecules to produce absorption or emission spectra. Rotational spectroscopy specifically analyzes the microwave spectra produced when molecules absorb microwave radiation, undergoing rotational transitions between energy levels. The frequency differences between lines in the rotational spectra are directly related to the rotational constant of the molecule.
Executive Directors Chat Leveraging AI for Diversity, Equity, and InclusionTechSoup
Let’s explore the intersection of technology and equity in the final session of our DEI series. Discover how AI tools, like ChatGPT, can be used to support and enhance your nonprofit's DEI initiatives. Participants will gain insights into practical AI applications and get tips for leveraging technology to advance their DEI goals.
Macroeconomics- Movie Location
This will be used as part of your Personal Professional Portfolio once graded.
Objective:
Prepare a presentation or a paper using research, basic comparative analysis, data organization and application of economic information. You will make an informed assessment of an economic climate outside of the United States to accomplish an entertainment industry objective.
ISO/IEC 27001, ISO/IEC 42001, and GDPR: Best Practices for Implementation and...PECB
Denis is a dynamic and results-driven Chief Information Officer (CIO) with a distinguished career spanning information systems analysis and technical project management. With a proven track record of spearheading the design and delivery of cutting-edge Information Management solutions, he has consistently elevated business operations, streamlined reporting functions, and maximized process efficiency.
Certified as an ISO/IEC 27001: Information Security Management Systems (ISMS) Lead Implementer, Data Protection Officer, and Cyber Risks Analyst, Denis brings a heightened focus on data security, privacy, and cyber resilience to every endeavor.
His expertise extends across a diverse spectrum of reporting, database, and web development applications, underpinned by an exceptional grasp of data storage and virtualization technologies. His proficiency in application testing, database administration, and data cleansing ensures seamless execution of complex projects.
What sets Denis apart is his comprehensive understanding of Business and Systems Analysis technologies, honed through involvement in all phases of the Software Development Lifecycle (SDLC). From meticulous requirements gathering to precise analysis, innovative design, rigorous development, thorough testing, and successful implementation, he has consistently delivered exceptional results.
Throughout his career, he has taken on multifaceted roles, from leading technical project management teams to owning solutions that drive operational excellence. His conscientious and proactive approach is unwavering, whether he is working independently or collaboratively within a team. His ability to connect with colleagues on a personal level underscores his commitment to fostering a harmonious and productive workplace environment.
Date: May 29, 2024
Tags: Information Security, ISO/IEC 27001, ISO/IEC 42001, Artificial Intelligence, GDPR
-------------------------------------------------------------------------------
Find out more about ISO training and certification services
Training: ISO/IEC 27001 Information Security Management System - EN | PECB
ISO/IEC 42001 Artificial Intelligence Management System - EN | PECB
General Data Protection Regulation (GDPR) - Training Courses - EN | PECB
Webinars: https://pecb.com/webinars
Article: https://pecb.com/article
-------------------------------------------------------------------------------
For more information about PECB:
Website: https://pecb.com/
LinkedIn: https://www.linkedin.com/company/pecb/
Facebook: https://www.facebook.com/PECBInternational/
Slideshare: http://www.slideshare.net/PECBCERTIFICATION
Introduction to AI for Nonprofits with Tapp NetworkTechSoup
Dive into the world of AI! Experts Jon Hill and Tareq Monaur will guide you through AI's role in enhancing nonprofit websites and basic marketing strategies, making it easy to understand and apply.
How to Manage Your Lost Opportunities in Odoo 17 CRMCeline George
Odoo 17 CRM allows us to track why we lose sales opportunities with "Lost Reasons." This helps analyze our sales process and identify areas for improvement. Here's how to configure lost reasons in Odoo 17 CRM
How to Fix the Import Error in the Odoo 17Celine George
An import error occurs when a program fails to import a module or library, disrupting its execution. In languages like Python, this issue arises when the specified module cannot be found or accessed, hindering the program's functionality. Resolving import errors is crucial for maintaining smooth software operation and uninterrupted development processes.
The simplified electron and muon model, Oscillating Spacetime: The Foundation...RitikBhardwaj56
Discover the Simplified Electron and Muon Model: A New Wave-Based Approach to Understanding Particles delves into a groundbreaking theory that presents electrons and muons as rotating soliton waves within oscillating spacetime. Geared towards students, researchers, and science buffs, this book breaks down complex ideas into simple explanations. It covers topics such as electron waves, temporal dynamics, and the implications of this model on particle physics. With clear illustrations and easy-to-follow explanations, readers will gain a new outlook on the universe's fundamental nature.
A review of the growth of the Israel Genealogy Research Association Database Collection for the last 12 months. Our collection is now passed the 3 million mark and still growing. See which archives have contributed the most. See the different types of records we have, and which years have had records added. You can also see what we have for the future.
This presentation includes basic of PCOS their pathology and treatment and also Ayurveda correlation of PCOS and Ayurvedic line of treatment mentioned in classics.
This presentation was provided by Steph Pollock of The American Psychological Association’s Journals Program, and Damita Snow, of The American Society of Civil Engineers (ASCE), for the initial session of NISO's 2024 Training Series "DEIA in the Scholarly Landscape." Session One: 'Setting Expectations: a DEIA Primer,' was held June 6, 2024.
Exploiting Artificial Intelligence for Empowering Researchers and Faculty, In...Dr. Vinod Kumar Kanvaria
Exploiting Artificial Intelligence for Empowering Researchers and Faculty,
International FDP on Fundamentals of Research in Social Sciences
at Integral University, Lucknow, 06.06.2024
By Dr. Vinod Kumar Kanvaria
Exploiting Artificial Intelligence for Empowering Researchers and Faculty, In...
Estimation of fe(lll) ions in the solution by titration against salicylic acid using static method
1. Estimation of the amount of Fe(III) in the complex formed
with salicylic acid by static method.
Dr. P. U. Singare
Associate Professor
Department of Chemistry
N.M. Institute of Science, Bhavan’s College,
Andheri, Mumbai 400 058
2. Understanding the basic concept
• Colorimeter is the instrument which measures the absorbance of colored solution in Visible region
(400nm to 700nm).
• Colorimeter works on the Principal of Beer-Lamberts law according to which absorbance of the
sample solution is directly proportional to the pathlength (b) of the light radiation travelled through
the solution and also directly proportional to the concentration (C) of the light absorbing solution
i.e.
A = εbC ----------- (1)
Here ε is called molar extinction coefficient or molar absorptivity.
• During the experiment the sample solution whose absorbance is to be measured is placed in the
sample holder also called as Cuvette.
• The cuvette used is of uniform thickness (usually 1 cm).
• Hence for all colorimetric measurements pathlength (b) = 1cm which is always constant.
• For constant values of ε and b, A α C -------- (2)
• From eq(2) it is clear that the absorbance of solution will increase linearly with the concentration
of light absorbing species present in the solution.
• Depending on the concentration of the sample solution, the light radiations will be absorbed and
remaining light radiations will be transmitted.
3. Understanding the basic concept (Continued----)
• The light absorbing impurities (if any) if present in the chemicals and solvents used for
sample preparation will interfere during the colorimetric measurement.
• The interference due to light absorbing impurities is overcome by using the Blank solution.
• The Blank solution contain all the chemicals and solvents used for preparing the sample
solution.
• The Blank usually will be a colorless solution having 0 (Zero) absorbance i.e. 100%
Transmittance.
• The absorbance of the sample solution is corrected by subtracting the absorbance of blank
from the absorbance sample solution.
• Usually in the colorimetric experiments, the graph of corrected Absorbance (A) on Y-axis is
plotted against Concentration (C) of the solution on X-axis which will be a straight line
graph passing through the origin.
• This graph is called calibration graph.
• The calibration graph is used to find the concentration of sample solution which is Unknown.
4. Understanding the basic concept (Continued----)
• The source of Visible light radiations used in colorimeter is tungsten filament lamp.
• The Visible light radiations emitted from the lamp will be made to pass through the filter.
• Filter will absorb light radiations of unwanted wavelength and will allow only monochromatic
wavelength of light to pass through it.
• For selecting the particular wavelength of light radiations, different coloured filters are used.
• The monochromatic wavelength of light radiation fall on the sample solution placed in the
sample cell (Cuvette).
• For measuring the absorbance in Visible region, the sample holder (cuvette) is made up of
Glass or Quartz material.
• The detector used in the colorimeter is photomultiplier tube.
5. Colorimeter Vs Spectrophotometer
Colorimeter
• Works only in Visible (400-700nm) region.
• The sample solution is colored.
• The cuvette (sample holder) is made up of
glass or quartz material.
• The tungsten filament lamp is used as a
source of light.
Spectrophotometer
• Works in UV(200-400nm) as well as Visible
(400-700nm) region.
• The sample solution may be colored as well
as colorless.
• For measurement in UV region, quartz
cuvette is used. Since glass strongly
absorbs UV radiations, glass cuvettes can
not be used for measurements in UV
region. For measurement in Visible region,
cuvette made up of glass or quartz material
can be used.
• For measurement in UV region, H2 or
Deuterium lamps are used. While for
measurement in Visible region tungsten
filament lamp is used.
6. Background of the experiment
• The experiment involves estimation of Fe(III) ions present in the Fe(III) Salicylic acid complex by
Static Titration method.
• In acidic medium, the Fe(III) ions will form soluble Violet color complex with Salicylic acid.
• The absorbance of the colored solution is measured on the Colorimeter at 530nm wavelength.
• Here λmax = 530nm.
• λmax is defined as the wavelength at which the solution shows maximum absorbance.
• During the experiment, the fixed volume (fixed concentration) of Fe(III) ions solution are taken in 9
different flasks (9 batches).
• To each flask (each batch) increasing volume of salicylic acid is added.
• As the volume of salicylic acid increases, the concentration of Fe(III)-salicylic acid complex
increases.
• With increase in concentration of Fe(III)-salicylic acid complex in the solution, the violet color
intensity initially increases sharply and further when no more free Fe(III) ions are left in the solution,
the color intensity remains constant.
• As a result, the absorbance of solution also initially increases sharply and latter on remains constant.
• The volume of salicylic acid at which the absorbance remains constant is the end point of titration.
• Since the experiment is performed in 9 batches, it is called static titration method.
8. Requirements
1. Colorimeter
2. 0.002M Fe(III) solution
3. 0.002M Salicylic acid solution
4. 0.002M HCl solution
5. Distilled water
6. Standard measuring flask (100 mL capacity) = 9 Nos.
7. Bulb Pipette (10 mL capacity)
8. Graduated pipette (10 mL capacity)
9. Procedure
Flask No. Volume of
0.002M
Fe(III)
solution
(mL)
Volume of
0.002M
Salicylic
acid
(mL)
Dilution
with
distilled
water
(mL)
1 10 0 100
2 10 1 100
3 10 2 100
4 10 3 100
5 10 4 100
6 10 5 100
7 10 6 100
8 10 7 100
9 10 8 100
• Dilute the given Fe (III) solution (Experimental solution) to
250 mL with 0.002M HCl solution.
• This will give 0.002M Fe(III) solution.
• Prepare 9 different 100 mL solution in 9 flask (100mL
capacity) as shown in the table.
• The solution in flask no. 1 will be colorless (since no salicylic
acid is added) and hence will be used as a Blank.
• Take the blank solution in the cuvette and place the cuvette
in the colorimeter.
• Select the wavelength λmax = 530nm on the colorimeter.
• At the selected value of λmax, adjust the absorbance of
blank solution to 0(zero).
• One after the other measure the absorbance of all the
solutions from flask No. 2 to 9 at selected λmax value.
• Plot the graph of absorbance of solution on Y-axis against
volume of salicylic acid (mL) on X-axis.
• From the graph find the endpoint of titration (Vx).
• The end point represent volume of 0.002M salicylic acid
(Vx) required to react (form complex) with 10mL of 0.002 M
Fe(III) solution.
• From the value of Vx as obtained from the graph, the
amount of Fe(III) ions in the solution can be calculated.
11. Calculations
10 mL of 0.002M Fe (III) solution = 2.7mL of 0.002M salicylic acid (From graph)
Therefore 250 mL of 0.002M Fe (III) solution =
250 𝑥 2.7
10
= 25 x 2.7 = 67.5 mL of 0.002M salicylic acid
Since 1 mL of 0.002 M salicylic acid solution = 280 µg of Fe(III)
Then 67.5 mL of 0.002M salicylic acid = 67.5 x 280 = 18,900 µg of Fe(III)
Therefore amount of Fe(III) present in 250 mL of diluted solution = 18,900 µg
12. Results
1. Volume of salicylic acid required for complex formation of Fe(III) present in 10 mL diluted
solution = 2.7mL
2. Volume of salicylic acid required for complex formation of Fe(III) present in 250 mL
diluted solution = 67.5 mL
3. Amount of Fe (III) in the given solution = 18,900 µg
13. Experimental method for estimation of Fe3+ using salicylate ion solution
https://www.youtube.com/watch?v=tYILu2igNbY