Downloaded 1,937 times
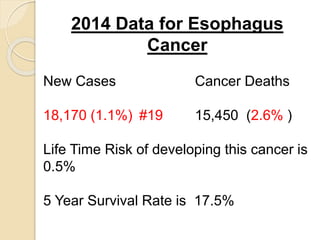
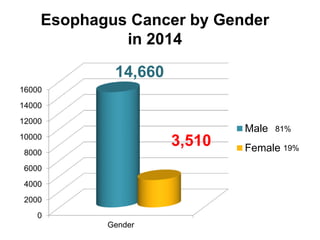
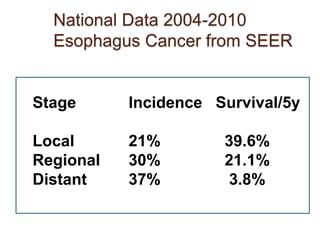
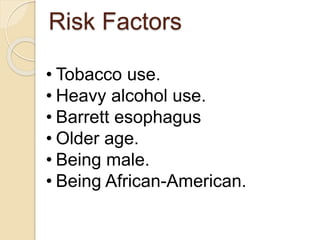
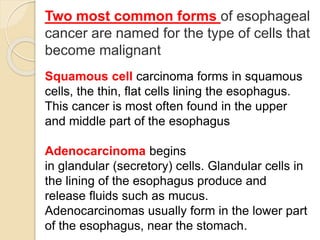
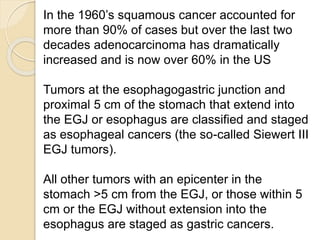
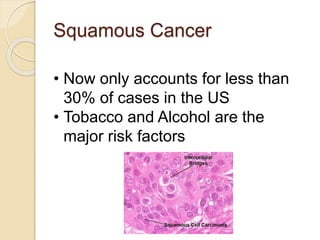
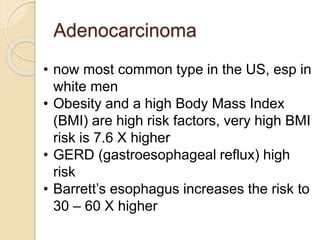
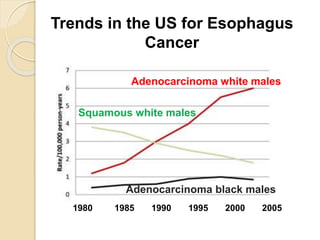
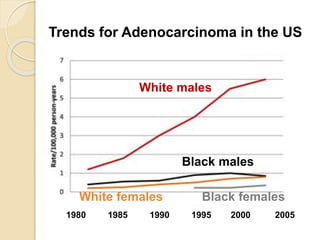
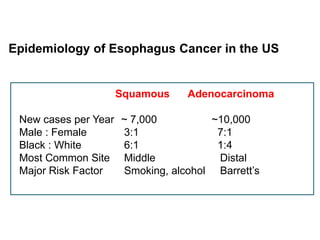
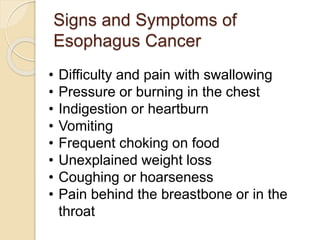

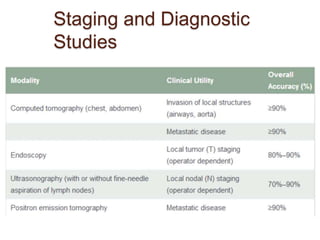
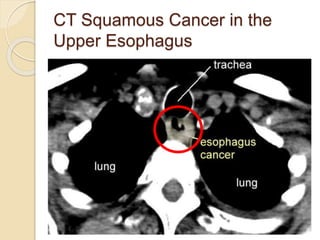
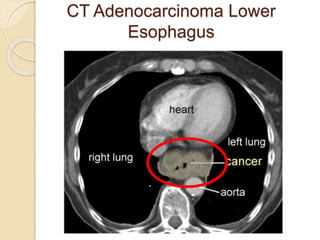
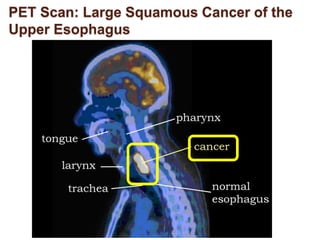
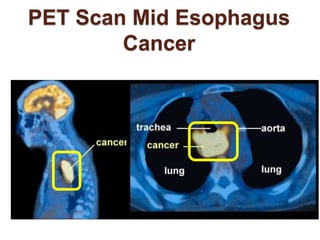
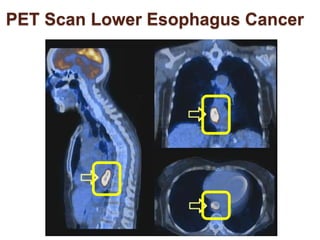
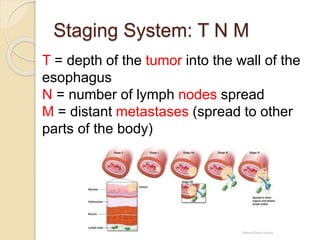
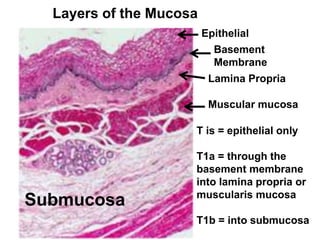
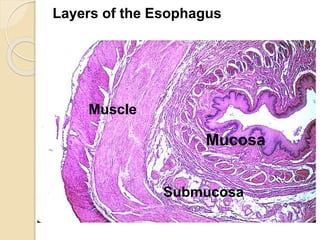

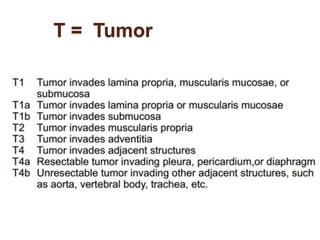
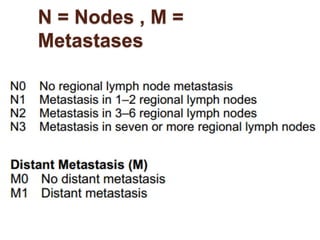
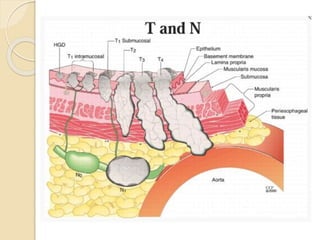
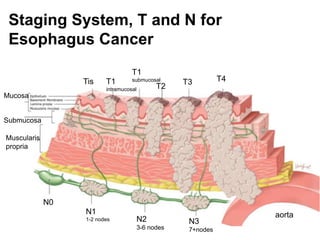
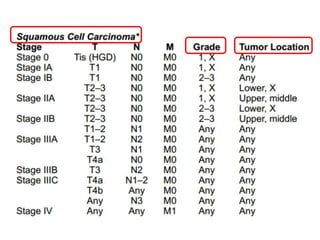
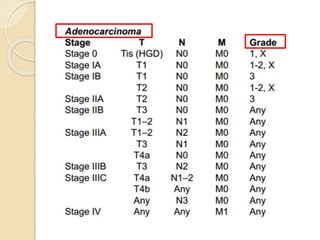
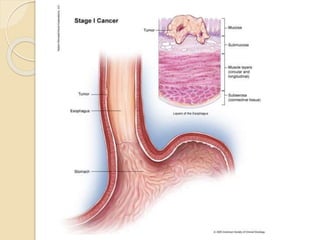
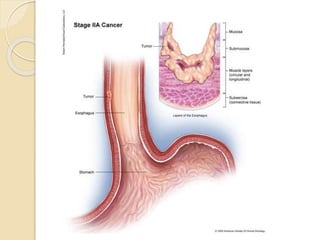
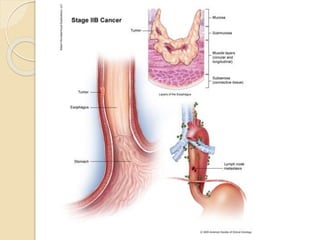
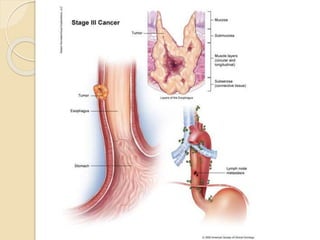
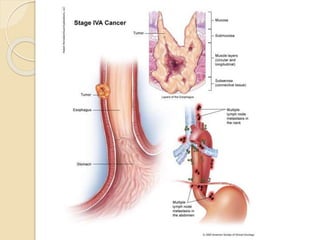
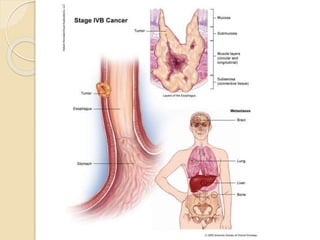
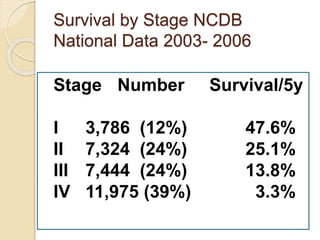
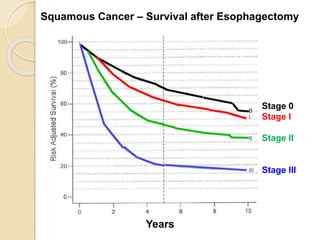
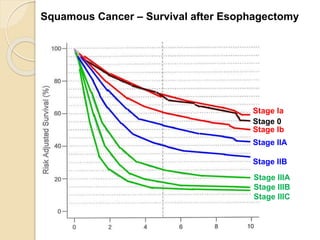
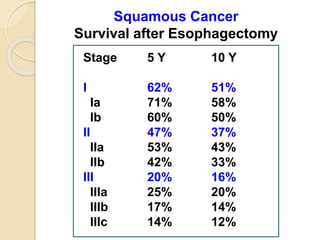
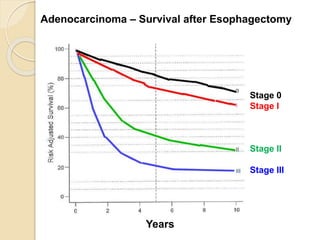
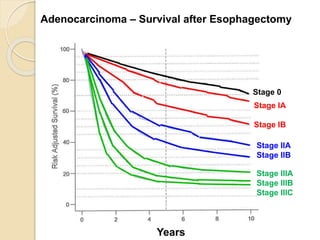
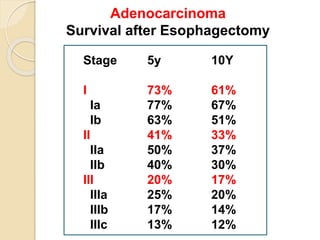


This document summarizes key information about cancer of the esophagus. It notes that in 2014 there were 18,170 new esophagus cancer cases in the US, with a lifetime risk of 0.5% and 5-year survival rate of 17.5%. Risk factors include tobacco, alcohol, Barrett's esophagus, obesity, and gastroesophageal reflux disease. The two main types are squamous cell carcinoma and adenocarcinoma, with adenocarcinoma now more common due to rising obesity rates. Staging involves assessing tumor depth (T), lymph node involvement (N), and metastases (M). Survival rates vary significantly based on cancer type, stage, and treatment received.


