Download to read offline
![networkshave survivedbesttoourday (see:Deloittecompany,2016; West2000;
Ophdal 2017).
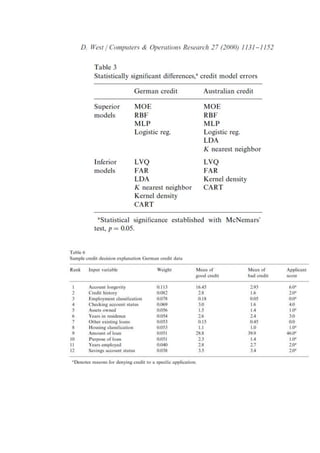
3. InformationcriteriaIV(x) andROC-curve introduced.These are the measuresof correct
prediction.Define also COR=# correctlypredictednumberof obs/# All observations=
correctlypredictedpercent.Then ErrorRate = 1 – COR, percent.
4. X-variablesare reviewedonlyalittle.The emphasisisonmethodsandreviewing90’s
literature.Backthenthe standardtechniqueswereLDA andOLS regression.Decision
tree techniquesalso.
5. Promotingk-nearestneighbormethod.The differenceiscreditscoringwithrespectLRis
howeverquite small0.68 % e.g.underone percentinN=5000 observations.Thisis35
people gettingacreditmore.The acceptance rate is70 % so 3 500 people getcredit.
The authors consider70 % a “loose criterion”andconsiderthe change incrementaldue
to populationdrift(fringe customersatstake).
6. EconomicBoomsand Busts cause populationdriftbetween“good”and“bad” creditand
changesinlegal institutionalso.Therefore inpractice we betterscore cardsor needover
1 % predictioninsmall populationsthe authorsconclude.
7. Critique:In large populationsa0,1 % issignificant(N=100 000) 100 personsgetting
credit. The authorsstart their paper with thispopulationsizebut then reduce it.
8. 3-STAR paper.Most of the techniquesare from90’s but the descriptionof a) credit
scoringand b) creditrating problemisdone inanexcellentmanner.
G) Comprehensible CreditScoringModelsUsingRule Extraction From
Support Vector Machines,David Martens, Bart Baesens,Tony Van Gestel,JanVanthienen,
K.U.Leuven,Dept.of DecisionSciencesand InformationManagement,
Naamsestraat 69, B-3000 Leuven,Belgium.
1. The data is Australiancreditscoringdata(N=690) and Benelux countrymid-size
companybankruptcydata (N=844). There isconcernwithAustraliandataqualityin
otherpapersinthe fieldof study.
2. The paper presentsthe “state-of-the-art”methodsthatare emergingincreditscoring
literature concerningAIandMachine Learning.These are relatedtoSupportVector
Machine algorithms(SVM’s).The authorstake accountof the complexityof these
models.Therefore theyare notevidentoreasyto presenttonon-experts.
3. Standardcorrectionof prediction(COR) percent(orErrorrate = 1 - COR percent).
4. X-variablesare lagof paymentsandsolvencyratesof companiesandbalance of
paymentsforbankruptcy.ForcreditscoringX’sare not discussedingreatdetail.Y-
variablesare probabilityof bankruptcyanddefaulting.
5. The modelsperformance iscompared.ItisfoundthatSVM-modelsperformbest
followedbyLR models.
6. Critique:dataqualitycouldbe betterforcreditscoringwithlargerthanN>>690.
7. 5-STAR paperindescribingnewest(andmostcompex) methodsinthe fieldof creditand
bankruptcyscoring.
NOTE:
“”“ Andrews,DiederichandTickle [1] propose aclassificationschemeforneural network
rule extractiontechniquesthatcaneasilybe extendedtoSVMs,andisbasedon the
followingcriteria:
1. Translucencyof the extractionalgorithmwithrespecttothe underlyingneural](https://image.slidesharecdn.com/escreditscoring2020-201006075629/85/Es-credit-scoring_2020-13-320.jpg)

The document reviews various credit scoring models and statistical methods, emphasizing the use of logistic regression (LR), neural networks (ANN), and genetic algorithms (GA) for assessing credit risk. It discusses the importance of data quality and explores emerging models like multidimensional neural networks and Bayesian inference, aiming to maximize predictive accuracy and minimize errors in credit default predictions. Key findings indicate that while predictive capabilities range from 70-80% accuracy, challenges remain in achieving high accuracy, particularly in homogeneous populations.