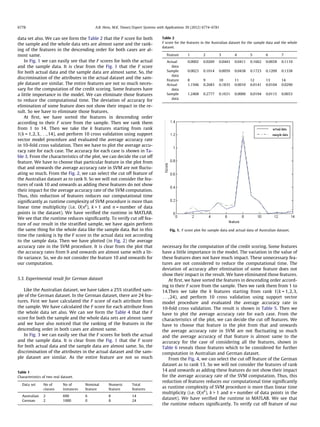
SlideShare a Scribd company logo
Computational time reduction for credit scoring: An integrated approach based on
support vector machine and stratified sampling method
Akhil Bandhu Hens a
, Manoj Kumar Tiwari b,⇑
a
Department of Mathematics, Indian Institute of Technology, Kharagpur, India
b
Department of Industrial Engineering and Management, Indian Institute of Technology, Kharagpur, India
a r t i c l e i n f o
Keywords:
Support vector machine
Credit scoring
F score
Stratified sampling
a b s t r a c t
With the rapid growth of credit industry, credit scoring model has a great significance to issue a credit
card to the applicant with a minimum risk. So credit scoring is very important in financial firm like bans
etc. With the previous data, a model is established. From that model is decision is taken whether he will
be granted for issuing loans, credit cards or he will be rejected. There are several methodologies to con-
struct credit scoring model i.e. neural network model, statistical classification techniques, genetic pro-
gramming, support vector model etc. Computational time for running a model has a great importance
in the 21st century. The algorithms or models with less computational time are more efficient and thus
gives more profit to the banks or firms. In this study, we proposed a new strategy to reduce the compu-
tational time for credit scoring. In this approach we have used SVM incorporated with the concept of
reduction of features using F score and taking a sample instead of taking the whole dataset to create
the credit scoring model. We run our method two real dataset to see the performance of the new method.
We have compared the result of the new method with the result obtained from other well known
method. It is shown that new method for credit scoring model is very much competitive to other method
in the view of its accuracy as well as new method has a less computational time than the other methods.
Ó 2011 Elsevier Ltd. All rights reserved.
1. Introduction
Recently credit industry is growing rapidly with the rapid growth
of financial sector, banking sector. The influence of the credit indus-
try has been seen the consumer market of the developing and the
developed countries. The competitiveness in credit industry is in
an larger extent specially in emerging economies. Many financial
firms have faced a tight competition in the market with respect to
smooth service, efficient service, more benefit to the customers.
Credit card is one of the services which every customer wants. Credit
cards make the financial transaction a little bit easier. The number of
applications for issuing credit cards is also increasing. Every finan-
cial firm wants to give better service to the customers and make
large profit. But there is a constraint to issue more credit cards with-
out any decision. There many some fraud applicant. They can misuse
the credit cards. For banking institutions, loans are often the primary
source of credit risk. Credit scoring models are used to evaluate the
risk. Banks also want to issue more credit cards to increase their
profits with minimizing the risk. It has been seen that some of the
applications are fraud. Credit scoring models have been extensively
used for the credit admission valuation. Many quantitative methods
have been developed for the prediction of credits more accurately.
Credit scoring models helps to categorize the applicants into two
classes: in one case the applicants are accepted and in other cases
applicants are rejected. During application procedure various infor-
mation about the applicant like income, bank balance, profession,
family background, educational background etc. are demanded.
Not all of these characteristics are quantitative. Some characteristics
are also qualitative. These qualitative characteristics are converted
into quantitative characteristics with some standard procedure for
the sake of computation. These characteristics are needed for credit
scoring model specification. The objectives of credit scoring models
are reduction of the cost for credit analysis, to make credit decision
making comparatively faster, to make it efficient.
Recently, many researchers have done their research work on
increasing the efficiency of credit scoring model, reducing the com-
putation time. As a result various methods for the decision making
of credit analysis have been proposed. These approaches help to
detect fraud, assess creditworthiness etc. Baesens et al. (2003) pre-
sented the various classification techniques for credit scoring. An
effective credit analysis also helps to issue loans with minimum
risk. The previous historical data of the applicants for credit cards
are necessary to create a credit scoring model. The credit scoring
model has been created using the previous data consisting of the
applicants’ information and decision taken to their applications.
Then this model is applied to a new applicant for credit cards. From
0957-4174/$ - see front matter Ó 2011 Elsevier Ltd. All rights reserved.
doi:10.1016/j.eswa.2011.12.057
⇑ Corresponding author. Tel.: +91 3222 283746.
E-mail address: mkt09@hotmail.com (M.K. Tiwari).
Expert Systems with Applications 39 (2012) 6774–6781
Contents lists available at SciVerse ScienceDirect
Expert Systems with Applications
journal homepage: www.elsevier.com/locate/eswa
this model creditor makes a decision on a new applicant whether
he will be accepted or rejected. With the increase in the accuracy
of credit scoring model, the creditors risk is decreased.
With the increasing importance of credit scoring model, this
field has invoked interests to many researchers to work on it. Filter
approach employs better results for credit scoring datasets as com-
pare to wrapper approach (Somol, Baesena, Pudil, & Vanthienen,
2005). Many researchers have developed many methods for credit
scoring. The computation of some model takes very long time. As a
consequence, research works are being continued on reducing the
computational method, increasing the overall efficiency of the
credit scoring model. If it is needed much time to create a credit
scoring model, then it is unworthy and it reduces the profit of
the firm. Moreover the efficiency of the firm has been decreased.
Computational time has a great significance for credit scoring
model. Lower the computational time, it will be more efficient. In
this study a new strategy has been proposed that reduces the com-
putational time for credit scoring. Creditor takes many character-
istics of the applicants for creating a credit scoring model. Some
characteristics may not be so useful like other characteristics. If
the creditor includes these characteristics, the computational time
will be automatically increased. Sometimes the previous data are
very large in volume. If the creditor takes the whole data set, the
computational time will be very high. In this paper, we have tried
to reduce the computational time by reducing the size of the data
set to be considered for the computation and optimizing the
characteristics (i.e. considering only the suitable characteristics
from all characteristics) as well as our other focus is reduce the
deviation of the result in our model from the actual result obtained
from the whole dataset considering all characteristics.
Many modern data mining techniques are used for credit scoring
models. For the last two decades various researchers has developed
numerous data mining tools and statistical methods for credit scor-
ing. Some of the methods are linear discriminant models (Reichert,
Cho, & Wagner, 1983), logistic regression models (Henley, 1995),
k-nearest neighborhood models (Henley & Hand, 1996), neural
network models (Desai, Crook, & Overstreet, 1996; Malhotra &
Malhotra, 2002; West, 2000) genetic programming models (Ong,
Huang, & Tzeng, 2005; Koza, 1992). Chen and Huang (2003)
presented a work to the credit industry that demostrates the advan-
tages of Neural network and Genetic algorithm to credit analysis.).
Each study has shown some comparative result with other methods.
Neural network model is seen to be more effective in credit risk pre-
diction comparative to other methods (Tam & Kiang, 1992). Logistic
regressions, K-nearest neighborhood method for credit scoring also
have a great significance in the view of accuracy and efficiency. Con-
sequently, Neural network models are treated as the benchmark in
the view of accuracy and solutions. But to get a good solution for a
large dataset, more number of hidden layers is required in the neural
network model. Consequently, the computational time is very high.
So the efficiency is low.
Recent research works have focused on increasing the accuracy
of the credit scoring model and developing some advanced meth-
ods. For example, Ho mann, Baesens, Martens, Put, and Vanthienen
(2002) suggested a neuro fuzzy and a genetic fuzzy classifier. A
integrated model based on clustering and neural networks for
credit scoring was suggested by Hsieh (2005; Garson, 1991; Zhang,
2000). A hybrid system with artificial networks and multivariate
adaptive regression splines was proposed by Lee and Chen
(2005).There are more hybrid models. Lee, Chiu, Lu, and Chen
(2002) suggested a hybrid credit scoring model with neural net-
works and discrimininant analysis. Recent research work involves
integrating various artificial intelligence methods to data mining
approach to increase the accuracy and flexibility.
There are many data mining and statistical approach for cluster-
ing. Support vector machine (SVM) is an important data mining
tool which is being used for clustering, classification etc. Support
vector machine was first proposed by Vapnik (1995). After that re-
searches have been done to apply this SVM tool in a wide range of
many applications. Now SVM is used in many applications like
clustering of data, pattern reorganization, text categorization, bio-
statistics etc. A simple decomposition method for support vector
machine is illustrated by Hsu, Chang, and Lin (2003). In credit scor-
ing model classification is necessary. SVM model is also used in
credit scoring model for making decision. In recent past few years
there has been some comparative as well as hybrid approach stud-
ies between SVM and other computational approach. A compara-
tive study between SVM and neural network model was done by
Huang, Chen, Hsu, Chen, and Wu (2004). An integrated SVM model
with genetic algorithm was suggested by Huang, Chen, and Wang
(2007); Fro¨hlich and Chapelle (2003); Pontil and Verri (1998). They
have shown that the result is comparable to benchmark methods.
All the previous studies about credit scoring are discussed about
the accuracy of the model. Most probably no previous study
discussed about the computational time. 21st century is for high
performance computing. Everybody is conscious about the compu-
tational time of the method. Any method with low computational
time is much more efficient and thus gives more profit to the
company. There is not any concrete study to include to sampling
methodology in SVM for credit scoring model with the integrating
F score (Weston et al., 2001). In this study a new approach has been
proposed about the reduction in computational time. In this paper,
we have taken a stratified sample and we have done the credit scor-
ing model with SVM and F score. Then we have done a comparative
study with computation of the whole data and all characteristics.
This study is incorporated with the concept of reduction of
unnecessary features with the calculation of F score. The reduction
of features from the calculation of the sample data takes less time
than the reduction of features from the calculation of whole data-
set (Kohavi & John, 1997). Here the computational time is reduced
for the two reasons: eliminating the unnecessary features and tak-
ing a sample instead of considering the whole sample It is shown in
that paper that with reduction of features from the data set from
the stratified sample gives similar accuracy with other benchmark
methods. As a reduction of features and reduction of size of data,
the computational time decreases significantly.
The paper organized as follows: Section 2 briefly describes the
procedure of support vector model. The concept of sampling method
and stratified sampling are described in Section 3.In Section 4, new
strategy for reduction of computation time is discussed. In Section 5,
empirical results are shown for real data set and comparative study
is done here. In Section 6, the remarks and conclusion are drawn.
2. Concepts of support vector machine (SVM) classifier
SVM classifier was most probably first proposed by Vapnik
(1995). Here we have illustrated the concept of SVM (support vector
machine) and its application as a two class classifier. Basically SVM is
a supervised learning method that analyzes data and recognizes pat-
terns, used for statistical classification and regression analysis.
Suppose there are given some dataset of pairs (xi,di), i =
1,2,3,. . . ,n where xi 2 Rn
and di 2 {À1,+ 1}. The value of di helps us
to indicate the class to which the point xi belongs. Each xi is actually
a p-dimensional real vector. With the help of we can find out the
maximum margin hyper-plane that divides the points having
di = 1 from those having di = À1. For this reason SVM is also known
as maximum margin classifier. Any hyperplane can be written as
the set of points x satisfying
r Á x À b ¼ 0 ð1Þ
where Á denotes the dot product and the vector r is a normal
vector which is perpendicular to the hyperplane. The offset of the
A.B. Hens, M.K. Tiwari / Expert Systems with Applications 39 (2012) 6774–6781 6775
hyperplane from the origin along the normal vector n can be
determined by the parameter b
krk
. We have to choose the n and b to
maximize the margin. The margin is defined as the distance between
the parallel hyperplanes that are as far apart as possible while still
classifying the data. These hyperplanes are expressed by the follow-
ing equations:
r Á x À b ¼ 1 ð2Þ
and
r Á x À b ¼ À1 ð3Þ
Our main objective is to
Minimize krk subject to constraint
diðr:xi À bÞ P 1 for i ¼ f1; 2; . . . ; ng
ð4Þ
To execute optimization problem in (4) we require the square root
computation for finding out the norm. Sometimes we may face dif-
ficulty in the square root computation. For this reason, the form of
the optimization problem in (4) has been changed to
Minimize
1
2
rT
r
Subject to diðr:xi À bÞ P 1 for i ¼ f1; 2; . . . ; ng
ð5Þ
This optimization problem in (5) is clearly a quadratic optimization
problem. In this optimization problem, the saddle point has to be
found out. The optimization problem in (5) can also be written as
min
r;b
max
a
1
2
rT
r À
Xn
i¼1
aiðdiðr:xi À bÞ À 1Þ
( )
ð6Þ
where ai is the Lagrange multiplier, hence ai > =0. The solution of
this optimization problem can be expressed by terms of linear com-
bination of the training vectors as
r ¼
Xn
i¼1
aixidi ð7Þ
For the sake of computation we perform differentiation with re-
spect to r and b, as well as we introduce the Karush–Kuhn–Tucker
(KKT) condition (Mao, 2004). As a result, the expression in (7) can
be transformed to the dual Lagrangian LD(a):
Max
a
LDðaÞ ¼
Xn
i¼1
ai À
1
2
Xn
i;j¼1
aiajdidj < xi Á xj > ð8Þ
Subject to: ai P 0 for i = 1,2,. . .,n and
Pn
i¼1aidi ¼ 0
The solution ai determines the parameters r⁄
and b⁄
of the opti-
mal hyperplane in the case of dual optimization problem. Thus we
can express the optimal hyperplane decision function as
fðx; aÃ
; b
Ã
Þ ¼ sgn
Xn
i¼1
diaÃ
i < xi Á xj > þb
Ã
!
ð9Þ
But in reality, only a small number of Lagrange multipliers usually
tend to be positive and these vectors are in the proximity of the
optimal hyperplane. The respective training vectors to these posi-
tive lagrange multipliers are support vectors. The optimal hyper-
plane f(x,a⁄
,b⁄
) depends on these support vectors.
The extension of the above concept can be found in nonseper-
able case (i.e. linear generalized support vector machine). In the
purpose of minimum number of training error, the problem of
finding the hyperplane for these induced hyperplane has the fol-
lowing expression:
Min
r;b;n
1
2
rT
r þ C
Xn
i¼1
ni
subject to : dið< r:xi > þbÞ þ ni À 1 P 0 and ni P 0
ð10Þ
where ni is the positive slack variables and C is a penalty parameter
for training error during validation on test data set. The optimization
problem in (10) can be solved with the help of Lagrangian method.
The corresponding optimization problem can be written as:
Max
a
Xn
i¼1
ai À
1
2
Xn
i;j¼1
aiajdidj < xi:xj >
Subject to : 0 6 ai 6 C for i ¼ 1; 2; . . . ; n and
Xn
i¼1
aidi ¼ 0
ð11Þ
The user defined penalty parameter C is the upper bound of ai..
The nonlinear Support vector machine helps for the mapping of
the training samples from the input space into a higher dimen-
sional feature space via a mapping function U. The inner product
has to be replaced by kernel function as the following expression
(Scholkopt & Smola, 2000):
ðUðxiÞ Á UðxjÞÞ ¼ kðxi;xjÞ ð12Þ
Then the equation will be transformed to:
Max
a
Xn
i¼1
ai À
1
2
Xn
i;j¼1
aiajdidjkðxi; xjÞ
Subject to : 0 6 ai 6 C for i ¼ 1; 2; . . . ; n and
Xn
i¼1
aidi ¼ 0
ð13Þ
For the linear generalized case, the decision function is as following
expression:
fðx; aÃ
; b
Ã
Þ ¼ sgn
Xn
i¼1
diaÃ
i kðxi; xjÞ þ b
Ã
!
ð14Þ
3. Concept of stratified sampling
Stratification is the process of grouping members of the popula-
tion into relatively homogeneous subgroups before sampling. The
strata should be mutually exclusive: every element in the popula-
tion must be assigned to only one stratum. The strata should also
be collectively exhaustive: no population element can be excluded.
Then random or systematic sampling is applied within each stra-
tum. This often improves the representativeness of the sample by
reducing sampling error. Thus stratified sampling is one of the best
sampling methods that represent the characteristics of the data. It
has been proved that the variation of result with the stratified sam-
pling is less than most of the sampling processes.
In Stratified sampling the population of N units in first divided
of into subpopulation of N1, N2,. . .,NL units respectively. These sub-
populations are overlapping and together they comprise the whole
of the population i.e.
N1 þ N2 þ Á Á Á þ NL ¼ N ð15Þ
These subpopulations are called as strata. When the strata have
been determined, a sample is drawn from each, the drawings being
made independently in different strata. The sample sizes within the
strata are denoted by n1,n2,. . .,nL, respectively such that
n1 þ n2 þ Á Á Á þ nL ¼ n ð16Þ
where n is the total sample size.
In this study proportionate stratified sampling method is uti-
lized. The main criteria of proportionate stratified sampling is:
nh
n
¼
Nh
N
ð18Þ
where Nh denotes the total number of units in the hth strata and nh
denotes the total number of units drawn from the hth strata as a
sample. From the Eq. (18) it is clear that if we have taken the Nh
6776 A.B. Hens, M.K. Tiwari / Expert Systems with Applications 39 (2012) 6774–6781
to be almost equal for all the strata, so the all the nh should be
nearly equal in magnitude.
4. Reduction of computational time by using F score and
sampling approach
4.1. Sample selection form the data
In this study we use proportionate stratified sampling approach
because the dataset is homogeneous. We know that stratified sam-
pling is applicable to homogeneous data. It is one of the most well
known sampling approaches for creating a good sample which rep-
resent the characteristics of the dataset. First, we have created
some strata which contains almost equal number of data i.e. some
bins containing almost equal number of data. Then randomly se-
lect some defined percentage of data from each stratum. Then
the selected data are put together to generate the sample. This is
the method for generating a sample using stratified sampling. Here
we also have taken previous dataset and make some strata of al-
most equal sizes. Then we create the sample using the stratified
sampling approach.
4.2. Sorting the input features using F score
The F score computation was first proposed by Chen and Lin
(2005). F score computation is a very simple technique but it is
very much efficient for the measurement the discrimination of
two sets of real numbers. First of all, we will find out the F score
for every feature from the sample. Suppose the training vectors
are xk (k = 1,2,. . .,m). There are certain numbers of positive and
negative instances. We denote the number of positive instances
as s+ and the number of negative instances as sÀ respectively. We
denote xi as the averages of the ith feature of the whole dataset
whereas x
ðþÞ
i and x
ðÀÞ
i denote averages of the ith feature of the po-
sitive and ith feature onegative datasets respectively. The ith fea-
ture of kth positive instance and ith feature of kth negative
instances can be denoted as x
ðþÞ
k;i and x
ðÀÞ
k;i respectively. Then the F
score of every feature can be computed as the following
expression:
Fi ¼
x
ðþÞ
i À xi
 2
þ x
ðÀÞ
i À xi
 2
1
sþÀ1
Pnþ
k¼1 x
ðþÞ
k;i À x
ðþÞ
i
 2
þ 1
sÀÀ1
PnÀ
k¼1 x
ðÀÞ
k;i À x
ðÀÞ
i
 2
ð19Þ
In the expression of the F score above, the numerator signifies the
discrimination between the positive and negative sets. The denom-
inator of the F score is summation of the sample variance of the po-
sitive sets and the negative sets. The larger value of F score implies
that corresponding feature is more discriminative. By the following
expression of F score we can easily compute F score of every feature
from the sample of the credit dataset.
4.3. Reduction of features
Suppose there are m features. All features may not provide their
impact for making decision in credit scoring. If we consider all the
unnecessary features for the computation of credit scoring, it will
take a long time. So it is unworthy. If we delete those unnecessary
features from the dataset, computational time makes fast and it re-
duces the complicacy of the computation. We sorted the features
in descending order according to their F score taken calculated
from sample and the features are given rank from 1 to m. We select
the cutoff feature by the following method described below. After
getting the cut off feature we will take only the features from the
feature ranked as 1 to the cut off feature for further calculation.
The cut off feature can be found out by the following procedure:
Step 1. Calculate the F score of every feature form the sample.
Step 2. Sort the F score in the descending order and give them
rank from 1 to m.
Step 3. Select the feature from rank 1 to rank k(k = 1,2,. . .,m). For
each case go to step 4.
Step 4.
(a) Randomly split the training data into training dataset
and validation dataset using 10-fold cross validation.
For each fold the following steps are done
(b) Suppose for a particular fold Dt be the training data
and Dv be the validation data. Using the SVM proce-
dure the predictor has to be found out from Dt. The
obtained predictor from SVM has to be applied on Dv
to follow the performance.
(c) Calculate the average validation accuracy for the 10-
fold cross validation. Store this result.
Step 5. Plot all the results.
Step 6. The plot has to be analyzed carefully. From which point
onwards the fluctuation in the accuracy are less and the
accuracy are nearby the value of the accuracy of taking
all the features. That particular feature is to be considered
as the cut off feature. The next features of the cut off fea-
ture and onwards are not to be considered in the compu-
tation for further SVM model calculation as these
features do not show their importance the result.
Henceforth, if one can get another dataset of similar types, he can
easily drop out the some unnecessary features. The total computation
SVM integrated with F score ranking to be done on the sample. The size
of the sample has to be determined by the creditor. It has been experi-
enced that the computational time has been reduced significantly. To
verifytheresultobtainedfromthenewmethoddescribedinthispaper,
we have done the calculation on the whole dataset using all features. It
has been shown that the accuracy obtained in our model is almost
same to the accuracy obtained from the computation on the whole
dataset and all features for both the datasets. Thus the computation
makes faster, easy and of less computational time.
5. Empirical analysis
5.1. Credit data sets
We have taken two real world data sets for the analysis in this
study. These are Australian dataset and German dataset. The
sources of these two datasets are the UCI Repository of machine
learning databases. Total number of instances in the German data-
set is 1000. Each of the instances has 24 attributes and one class
attribute. 700 instances of the whole dataset are creditworthy
applicants and there are 300 instances where credit is not worthy.
On the other hand the total number of instances in the Australian
dataset is 690. Each of the instances has 6 nominal, 8 numeric attri-
butes and one class attributes. 307 instances of the whole dataset
are creditworthy and the rest 383 instances imply that credit is not
creditworthy for these instances. Later we can see that we have got
some interesting results from the analysis of these two datasets.
Characteristics of Australian and German real dataset has been pre-
sented in Table 1. The German dataset is more unbalanced than
Australian dataset (see Table 1).
5.2. Experimental result for Australian dataset
In this study, we have taken a 25% stratified sample of the Aus-
tralian dataset. In the Australian dataset, there are 14 features. First
we have calculated the F score of each attribute from the sample.
We have calculated the F score for each attribute from the whole
A.B. Hens, M.K. Tiwari / Expert Systems with Applications 39 (2012) 6774–6781 6777
data set also. We can see form the Table 2 that the F score for both
the sample and the whole data sets are almost same and the rank-
ing of the features in the descending order for both cases are al-
most same.
In Fig. 1 we can easily see that the F scores for both the actual
and the sample data. It is clear from the Fig. 1 that the F score
for both actual data and the sample data are almost same. So, the
discrimination of the attributes in the actual dataset and the sam-
ple dataset are similar. The entire features are not so much neces-
sary for the computation of the credit scoring. Some features have
a little importance in the model. We can eliminate those features
to reduce the computational time. The deviation of accuracy for
elimination of some feature does not show their impact in the re-
sult. So we have to eliminate those features.
At first, we have sorted the features in descending order
according to their F score from the sample. Then we rank them
from 1 to 14. Then we take the k features starting from rank
1(k = 1,2,3,. . .,14), and perform 10 cross validation using support
vector model procedure and evaluated the average accuracy rate
in 10-fold cross validation. Then we have to plot the average accu-
racy rate for each case. The accuracy for each case is shown in Ta-
ble 3. From the characteristics of the plot, we can decide the cut off
feature. We have to choose that particular feature in the plot from
that and onwards the average accuracy rate in SVM are not fluctu-
ating so much. From the Fig. 2, we can select the cut off feature of
the Australian dataset as to rank 9. So we will not consider the fea-
tures of rank 10 and onwards as adding these features do not show
their impact for the average accuracy rate of the SVM computation.
Thus, this reduction of features reduces our computational time
significantly as runtime complexity of SVM procedure is more than
linear time multiplicity (i.e. O(nk
), k  1 and n = number of data
points in the dataset). We have verified the runtime in MATLAB.
We see that the runtime reduces significantly. To verify cut off fea-
ture of our result in the stratified sample, we have again perform
the same thing for the whole data like the sample data. But in this
time the ranking is by the F score in the actual data not according
to the sample data. Then we have plotted (in Fig. 2) the average
accuracy rate in the SVM procedure. It is clear from the plot that
the accuracy rates from 9 and onwards are almost same with a lit-
tle variance. So, we do not consider the feature 10 and onwards for
our computation.
5.3. Experimental result for German dataset
Like the Australian dataset, we have taken a 25% stratified sam-
ple of the German dataset. In the German dataset, there are 24 fea-
tures. First we have calculated the F score of each attribute from
the sample. We have calculated the F score for each attribute from
the whole data set also. We can see form the Table 4 that the F
score for both the sample and the whole data sets are almost same
and we have also noticed that the ranking of the features in the
descending order in both cases are almost same.
In Fig. 3 we can easily see that the F scores for both the actual
and the sample data. It is clear from the Fig. 1 that the F score
for both actual data and the sample data are almost same. So, the
discrimination of the attributes in the actual dataset and the sam-
ple dataset are similar. As the entire feature are not so much
necessary for the computation of the credit scoring. Some features
have a little importance in the model. The variation in the value of
these features does not have much impact. These unnecessary fea-
tures are not considered to reduce the computational time. The
deviation of accuracy after elimination of some feature does not
show their impact in the result. We have eliminated those features.
At first, we have sorted the features in descending order accord-
ing to their F score from the sample. Then we rank them from 1 to
14.Then we take the k features starting from rank 1(k = 1,2,3,
. . .,24), and perform 10 cross validation using support vector
model procedure and evaluated the average accuracy rate in
10-fold cross validation. The result is shown in Table 5. Then we
have to plot the average accuracy rate for each case. From the
characteristics of the plot, we can decide the cut off features. We
have to choose that feature in the plot from that and onwards
the average accuracy rate in SVM are not fluctuating so much
and the average accuracy of that feature is almost same to the
accuracy for the case of considering all the features, shown in
Table 6 reveals those features which to be considered for further
computation in Australian and German dataset.
From the Fig. 4, we can select the cut off feature of the German
dataset as to rank 13. So we will not consider the features of rank
14 and onwards as adding these features do not show their impact
for the average accuracy rate of the SVM computation. Thus, this
reduction of features reduces our computational time significantly
as runtime complexity of SVM procedure is more than linear time
multiplicity (i.e. O(nk
), k  1 and n = number of data points in the
dataset). We have verified the runtime in MATLAB. We see that
the runtime reduces significantly. To verify cut off feature of our
Table 1
Characteristics of two real dataset.
Data set No of
classes
No of
instances
Nominal
feature
Numeric
feature
Total
features
Australian 2 690 6 8 14
German 2 1000 0 8 24
Table 2
F score for the features in the Australian dataset for the sample data and the whole
dataset.
Feature 1 2 3 4 5 6 7
Actual
data
0.0002 0.0269 0.0443 0.0411 0.1662 0.0658 0.1110
Sample
data
0.0023 0.1014 0.0059 0.0438 0.1723 0.1209 0.1338
Feature 8 9 10 11 12 13 14
Actual
data
1.1506 0.2683 0.1835 0.0010 0.0141 0.0104 0.0290
Sample
data
1.2468 0.2777 0.1631 0.0000 0.0194 0.0115 0.0653
Fig. 1. F score plot for sample data and actual data of Australian dataset.
6778 A.B. Hens, M.K. Tiwari / Expert Systems with Applications 39 (2012) 6774–6781
result in the stratified sample, we have again perform the same
thing for the whole data like the sample data. But in this
time the ranking is by the F score in the actual data not according
to the sample data. Then we have plotted the average accuracy
rate in the SVM procedure. It is clear from the plot that the accu-
racy rates from 13 and onwards is almost same with a little vari-
ance. So, we do not consider the feature 14 and onwards for our
computation.
5.4. Comparison to other methods in computational time
In previous studies, several approaches like genetic program-
ming, neural network, support vector model, decision tree, SVM
based genetic algorithm has been applied to credit scoring (Quin-
lan, 1986). All these models are performing well for credit scoring.
In neural network model, one may not get expected result at the
first time. In order to get expected result, the numbers of hidden
layers have to be optimized. Larger the number of hidden layers
in neural network model, the flexibility of the neural network
model will be larger because then the network has more parameter
to optimize. Consequently, the accuracy level will be high. But with
Table 3
Accuracy rate for SVM method for sample data and whole data of Australian dataset.
No of features in the sorted list 1 2 3 4 5 6 7
Sample data 0.8753 0.8378 0.8225 0.8661 0.8851 0.8349 0.8669
Actual data 0.8530 0.8716 0.8623 0.8667 0.8598 0.8554 0.8559
no of features in the sorted list 8 9 10 11 12 13 14
Sample data 0.8661 0.8598 0.8487 0.8536 0.8631 0.8516 0.8683
Actual data 0.8521 0.8723 0.8701 0.8658 0.8693 0.8619 0.8710
Fig. 2. Accuracy for sample data and the actual data of Australian dataset.
Table 4
F score of features of the sample data and the actual dataset for the German dataset.
Feature 1 2 3 4 5 6 7 8
Sample data 0.2022 0.0153 0.0869 0.0197 0.0336 0.0475 0.0033 0.0015
Actual data 0.2055 0.0619 0.0752 0.0286 0.0498 0.0186 0.0105 0
feature 9 10 11 12 13 14 15 16
Sample data 0.0131 0.0004 0.0177 0.0183 0.0119 0.0001 0.0009 0.0389
Actual data 0.0285 0.0116 0.0156 0.0029 0 0.0018 0.0114 0.0124
feature 17 18 19 20 21 22 23 24
Sample data 0.0314 0.0098 0.0016 0.0113 0.0167 0.0086 0.0014 0.0055
Actual data 0.0157 0 0.0048 0.0112 0.0242 0 0.0007 0.0003
Fig. 3. Plot of the F score from actual data and sample data of German dataset.
A.B. Hens, M.K. Tiwari / Expert Systems with Applications 39 (2012) 6774–6781 6779
the increase of hidden layers, the runtime will be also very high.
Hence, for a large database, credit scoring based on neural network
model will take a long time. Genetic programming also will take a
long time because at first the function set is initialized. We will get
the terminal set from the dataset. If we will take function sets of
many functions, it will have more flexibility. Thus, the accuracy
will be high. But at the same time, with a large function set and
a large dataset the computational time will be much high. Both
the GP and BPN are stochastic process. So it will take a long com-
putational time.
But support vector model is a quadratic optimization procedure.
Here user does not require to specify any parameter beforehand. Its
runtime is faster than the BPN, GP model. While the GA based SVM
model (Huang et al. 2005) is time costly than simple SVM model.
The time complexity for SVM model is more than linear time com-
plexity (i.e. O(nk
), k  1 and n = number of data points in the data-
set). In this study, the runtime decreased significantly because of
taking sample data instead of whole data set and reduction of
unnecessary features using F score. The significant decrease in run-
time for the execution of the SVM model with less data sets and
less number of features can be experienced easily in MATLAB.
We have eliminated the features using the F score calculation from
sample rather than the calculation from the whole data set.
Overall, the runtime is less than other methods. Moreover, the
procedure of discussed in this paper produces similar accuracy like
other benchmark methods.
5.5. Comparison to other method in accuracy  efficiency
Then we measured the accuracy rate for the four procedure and
we compared our sampling based SVM procedure with other
methods. The comparative results for two data set s are shown in
Tables 7 and 8. It is clear from the table our fast computation
Table 5
Accuracy rate of SVM for actual data and sample data from German dataset.
No of features in the sorted list 1 2 3 4 5 6 7 8
Sample data 0.7281 0.7314 0.7815 0.7753 0.8042 0.7687 0.7829 0.7775
Actual data 0.6912 0.7129 0.7499 0.7517 0.7526 0.7562 0.7689 0.7570
No of features in the sorted list 9 10 11 12 13 14 15 16
Sample data 0.7747 0.7674 0.7513 0.7675 0.7508 0.7431 0.7519 0.7423
Actual data 0.7581 0.7657 0.7632 0.7670 0.7674 0.7560 0.7613 0.7736
No of features in the sorted list 17 18 19 20 21 22 23 24
Sample data 0.7611 0.7468 0.7608 0.7478 0.7537 0.7637 0.7586 0.7560
Actual data 0.7739 0.7768 0.7591 0.7689 0.7651 0.7521 0.7732 0.7716
Table 6
Features to be considered for further computation in two dataset.
Dataset Total features Features to be considered
for further computation
Australian dataset 14 9
German dataset 24 13
Fig. 4. Plot of accuracy for sample and actual data set for German dataset.
Table 7
Comparative study for various methods for Australian dataset.
Method Accuracy rate (in %) Std (in %)
Australian data
Sampling procedure in SVM 85.98 3.89
SVM + GA 86.76 3.78
BPN 86.71 3.41
GP 86.83 3.96
Table 8
Comparative study for various methods for German dataset.
Method Accuracy rate (in %) Std (in %)
German Data
Sampling procedure in SVM 75.08 3.92
SVM + GA 76.84 3.82
BPN 76.69 3.24
GP 77.26 4.06
6780 A.B. Hens, M.K. Tiwari / Expert Systems with Applications 39 (2012) 6774–6781
method is well competitive with respect to other methods. The
average accuracy of the new method is almost same with other
methods.
6. Conclusion
Credit scoring is very much necessary for every bank to make
decision to a new applicant. Credit industry is increasing rapidly.
Banks want to get more profit by issuing more credit cards with
the constraint of minimum risk (i.e. minimizing the number of pos-
sible fraud applications). Credit scoring model helps to classify a
new applicant as accepted or rejected. There are various method
for creating a credit scoring model such as traditional statistical
techniques, neural networks, support vector model, genetic pro-
gramming etc. For statistical techniques the creditor should know
the relationship among the various features. But the other methods
like GP, BPN, SVM do not require any underlying relationship
among the features. For GP, the creditors have to specify the func-
tion set. For different function set the result may be different. For
BPN, the creditors have to specify the structure of the neural net-
work. More the number of hidden layers, the flexibility will be
high. Consequently the computational time will be high. BPN and
GP are the stochastic process, so it requires high amount of compu-
tational time. Comparatively, SVM is a quadratic optimization
problem. So, Creditor does not require to specify any parameter
for the computation. With respect to GP, the computational time
of SVM is less. Sometimes due to large size of dataset the compu-
tational time may be high but still is less than the computational
time of GP.
In this paper, we have suggested a hybrid approach of sam-
pling, SVM and F score. Our main objective is to study the
new approach and make a comparative analysis of the computa-
tional time and accuracy with some other methods. Here we
summarize the whole method. From the whole dataset, creditor
have to take a stratified sample as the stratified sample is one of
the best sampling method that represents the characteristics of
the dataset. The determination of sample size is very important.
Sample size is to be predicted in such a way that study of the
sample nearly represents the result obtained from the study of
whole dataset. Depending on the size of the dataset, creditors
have to predict the size of the sample that will reduce the devi-
ation from the computational result of actual dataset. After cal-
culating the F score from the sample, the features have to be
sorted in descending order according to their F score. F score
actually signifies the importance of each feature in the dataset.
Then perform the SVM as described in Section 4. From the plot
one can easily eliminate the features which are not needed for
future calculation. Initially, the differences in the accuracy re-
sults for consecutive results are higher than later because there
may be some correlation between features. By selecting some
features, there may be some unselected feature which is corre-
lated to some selected feature. But after certain steps the results
becomes comparatively stable. From that step we can find out
the unnecessary features. These unnecessary features unneces-
sarily increase the runtime of the computation. Thus by decreas-
ing the features from the computation from the sample is less
costly than the same from the computation from the whole
dataset. Thus new method for credit scoring which is proposed
in this study, is very much computationally efficient as well as
reliable in the view of its accuracy.
References
Baesens, B., Van Gestel, T., Viaene, S., Stepanova, M., Suykens, J.,  Vanthienen, J.
(2003). Benchmarking state-of-the-art classification algorithms for credit
scoring. Journal of the Operational Research Society, 54(6), 627–635.
Chen, Y.-W.,  Lin, C.-J. (2005). Combining SVMs with various feature selection
strategies. Available from http://www.csie.ntu.edu.tw/$cjlin/papers/
features.pdf.
Chen, M. C.,  Huang, S. H. (2003). Credit scoring and rejected instances reassigning
through evolutionary computation techniques. Expert Systems with Applications,
24(4), 433–441.
Desai, V. S., Crook, J. N.,  Overstreet, G. A. (1996). A comparison of neural networks
and linear scoring models in the credit union environment. European Journal of
Operational Research, 95(1), 24–37.
Fro¨hlich, H.,  Chapelle, O. (2003), Feature selection for support vector machines by
means of genetic algorithms. In Proceedings of the 15th IEEE international
conference on tools with artificial intelligence, Sacramento, California, USA, (pp.
142–148).
Garson, G. D. (1991). Interpreting neural-network connection weights. AI Expert,
6(4), 47–51.
Henley, W. E. (1995), Statistical aspects of credit scoring. Dissertation, The Open
University, Milton Keynes, UK.
Henley, W. E.,  Hand, D. J. (1996). A k-nearest neighbor classifier for assessing
consumer credit risk. Statistician, 44(1), 77–95.
Ho mann, F., Baesens, B., Martens, J., Put, F.,  Vanthienen, J. (2002). Comparing a
genetic fuzzy and a neurofuzzy classifier for credit scoring. International Journal
of Intelligent Systems, 17(11), 1067–1083.
Hsieh, N.-C. (2005). Hybrid mining approach in the design of credit scoring models.
Expert Systems with Applications, 28(4), 655–665.
Hsu, C. W., Chang, C. C.,  Lin, C. J. (2003), A practical guide to support vector
classification. Available from http://www.csie.ntu.edu.tw/$cjlin/papers/
guide/guide.pdf.
Huang, Z., Chen, H., Hsu, C.-J., Chen, W.-H.,  Wu, S. (2004). Credit rating analysis
with support vector machines and neural networks: A market comparative
study. Decision Support Systems, 37(4), 543–558.
Huang, C. L., Chen, M. C.,  Wang, J. W. (2007). Credit scoring with a data mining
approach based on support vector machine. Expert Systems with Applications,
33(2007), 847–856.
Kohavi, R.,  John, G. (1997). Wrappers for feature subset selection. Artificial
Intelligence, 97(1–2), 273–324.
Koza, J. R. (1992). Genetic Programming: On the Programming of Computers by Means
of Natural Selection. Cambridge, MA: The MIT Press.
Lee, T.-S.,  Chen, I.-F. (2005). A two-stage hybrid credit scoring model using
artificial neural networks and multivariate adaptive regression splines. Expert
Systems with Applications, 28(4), 743–752.
Lee, T.-S., Chiu, C.-C., Lu, C.-J.,  Chen, I.-F. (2002). Credit scoring using the hybrid
neural discriminant technique. Expert Systems with Applications, 23(3), 245–254.
Malhotra, R.,  Malhotra, D. K. (2002). Differentiating between good credits and bad
credits using neuro-fuzzy systems. European Journal of Operational Research,
136(1), 190–211.
Mao, K. Z. (2004). Feature subset selection for support vector machines through
discriminative function pruning analysis. IEEE Transactions on Systems, Man, and
Cybernetics, 34(1), 60–67.
Ong, C.-S., Huang, J.-J.,  Tzeng, G.-H. (2005). Building credit scoring models using
genetic programming. Expert Systems with Applications, 29(1), 41–47.
Pontil, M.,  Verri, A. (1998). Support vector machines for 3D object recognition.
IEEE Transactions on Pattern Analysis and Machine Intelligence, 20(6), 637–646.
Quinlan, J. R. (1986). Induction of decision trees. Machine Learning, 1(1), 81–106.
Reichert, A. K., Cho, C. C.,  Wagner, G. M. (1983). An examination of the conceptual
issues involved in developing credit-scoring models. Journal of Business and
Economic Statistics, 1(2), 101–114.
Scholkopf, B.,  Smola, A. J. (2000). Statistical Learning and Kernel Methods.
Cambridge, MA: MIT Press.
Somol, P., Baesens, B., Pudil, P.,  Vanthienen, J. (2005). Filter-versus wrapper-based
feature selection for credit scoring. International Journal of Intelligent Systems,
20(10), 985–999.
Tam, K. Y.,  Kiang, M. Y. (1992). Managerial applications of the neural networks:
The case of bank failure prediction. Management Science, 38(7), 926–947.
Vapnik, V. N. (1995). The Nature of Statistical Learning Theory. New York: Springer-
Verlag.
West, D. (2000). Neural network credit scoring models. Computers and Operations
Research, 27(11–12), 1131–1152.
Weston, J., Mukherjee, S., Chapelle, O., Pontil, M., Poggio, T.,  Vapnik, V. (2001).
Feature Selection for SVM. In S. A. Solla, T. K. Leen,  K.-R. Muller (Eds.).
Advances in Neural Information Processing Systems (Vol. 13, pp. 668–674).
Cambridge, MA: MIT Press.
Zhang, G. P. (2000). Neural networks for classification: a survey. IEEE Transactions on
Systems, Man, and Cybernetics—Part C: Applications and Reviews, 30(4), 451–462.
A.B. Hens, M.K. Tiwari / Expert Systems with Applications 39 (2012) 6774–6781 6781

More Related Content

What's hot

DEVELOPING PREDICTION MODEL OF LOAN RISK IN BANKS USING DATA MINING
DEVELOPING PREDICTION MODEL OF LOAN RISK IN BANKS USING DATA MINING DEVELOPING PREDICTION MODEL OF LOAN RISK IN BANKS USING DATA MINING
DEVELOPING PREDICTION MODEL OF LOAN RISK IN BANKS USING DATA MINING
mlaij
 
Applying Convolutional-GRU for Term Deposit Likelihood Prediction
Applying Convolutional-GRU for Term Deposit Likelihood PredictionApplying Convolutional-GRU for Term Deposit Likelihood Prediction
Applying Convolutional-GRU for Term Deposit Likelihood Prediction
VandanaSharma356
 
Clustering Prediction Techniques in Defining and Predicting Customers Defecti...
Clustering Prediction Techniques in Defining and Predicting Customers Defecti...Clustering Prediction Techniques in Defining and Predicting Customers Defecti...
Clustering Prediction Techniques in Defining and Predicting Customers Defecti...
IJECEIAES
 
A TWO-STAGE HYBRID MODEL BY USING ARTIFICIAL NEURAL NETWORKS AS FEATURE CONST...
A TWO-STAGE HYBRID MODEL BY USING ARTIFICIAL NEURAL NETWORKS AS FEATURE CONST...A TWO-STAGE HYBRID MODEL BY USING ARTIFICIAL NEURAL NETWORKS AS FEATURE CONST...
A TWO-STAGE HYBRID MODEL BY USING ARTIFICIAL NEURAL NETWORKS AS FEATURE CONST...
IJDKP
 
Credit iconip
Credit iconipCredit iconip
Credit iconip
Armando Vieira
 
Credit defaulter analysis
Credit defaulter analysisCredit defaulter analysis
Credit defaulter analysis
Nimai Chand Das Adhikari
 
An Explanation Framework for Interpretable Credit Scoring
An Explanation Framework for Interpretable Credit Scoring An Explanation Framework for Interpretable Credit Scoring
An Explanation Framework for Interpretable Credit Scoring
gerogepatton
 
Augmentation of Customer’s Profile Dataset Using Genetic Algorithm
Augmentation of Customer’s Profile Dataset Using Genetic AlgorithmAugmentation of Customer’s Profile Dataset Using Genetic Algorithm
Augmentation of Customer’s Profile Dataset Using Genetic Algorithm
RSIS International
 
Improving Credit Card Fraud Detection: Using Machine Learning to Profile and ...
Improving Credit Card Fraud Detection: Using Machine Learning to Profile and ...Improving Credit Card Fraud Detection: Using Machine Learning to Profile and ...
Improving Credit Card Fraud Detection: Using Machine Learning to Profile and ...
Melissa Moody
 
Text pre-processing of multilingual for sentiment analysis based on social ne...
Text pre-processing of multilingual for sentiment analysis based on social ne...Text pre-processing of multilingual for sentiment analysis based on social ne...
Text pre-processing of multilingual for sentiment analysis based on social ne...
IJECEIAES
 
A systems engineering methodology for wide area network selection
A systems engineering methodology for wide area network selectionA systems engineering methodology for wide area network selection
A systems engineering methodology for wide area network selection
Alexander Decker
 
IRJET- Machine Learning Classification Algorithms for Predictive Analysis in ...
IRJET- Machine Learning Classification Algorithms for Predictive Analysis in ...IRJET- Machine Learning Classification Algorithms for Predictive Analysis in ...
IRJET- Machine Learning Classification Algorithms for Predictive Analysis in ...
IRJET Journal
 
USING NLP APPROACH FOR ANALYZING CUSTOMER REVIEWS
USING NLP APPROACH FOR ANALYZING CUSTOMER REVIEWSUSING NLP APPROACH FOR ANALYZING CUSTOMER REVIEWS
USING NLP APPROACH FOR ANALYZING CUSTOMER REVIEWS
csandit
 
A predictive system for detection of bankruptcy using machine learning techni...
A predictive system for detection of bankruptcy using machine learning techni...A predictive system for detection of bankruptcy using machine learning techni...
A predictive system for detection of bankruptcy using machine learning techni...
IJDKP
 
Growing Health Analytics Without Hiring new Staff
Growing Health Analytics Without Hiring new StaffGrowing Health Analytics Without Hiring new Staff
Growing Health Analytics Without Hiring new Staff
ThotWave
 
Developing a PhD Research Topic for Your Research| PhD Assistance UK
Developing a PhD Research Topic for Your Research| PhD Assistance UKDeveloping a PhD Research Topic for Your Research| PhD Assistance UK
Developing a PhD Research Topic for Your Research| PhD Assistance UK
PhDAssistanceUK
 
Keyword Based Service Recommendation system for Hotel System using Collaborat...
Keyword Based Service Recommendation system for Hotel System using Collaborat...Keyword Based Service Recommendation system for Hotel System using Collaborat...
Keyword Based Service Recommendation system for Hotel System using Collaborat...
IRJET Journal
 
Evidence Data Preprocessing for Forensic and Legal Analytics
Evidence Data Preprocessing for Forensic and Legal AnalyticsEvidence Data Preprocessing for Forensic and Legal Analytics
Evidence Data Preprocessing for Forensic and Legal Analytics
CSCJournals
 
CHURN ANALYSIS AND PLAN RECOMMENDATION FOR TELECOM OPERATORS
CHURN ANALYSIS AND PLAN RECOMMENDATION FOR TELECOM OPERATORSCHURN ANALYSIS AND PLAN RECOMMENDATION FOR TELECOM OPERATORS
CHURN ANALYSIS AND PLAN RECOMMENDATION FOR TELECOM OPERATORS
Journal For Research
 
Instance Selection and Optimization of Neural Networks
Instance Selection and Optimization of Neural NetworksInstance Selection and Optimization of Neural Networks
Instance Selection and Optimization of Neural Networks
ITIIIndustries
 

What's hot (20)

DEVELOPING PREDICTION MODEL OF LOAN RISK IN BANKS USING DATA MINING
DEVELOPING PREDICTION MODEL OF LOAN RISK IN BANKS USING DATA MINING DEVELOPING PREDICTION MODEL OF LOAN RISK IN BANKS USING DATA MINING
DEVELOPING PREDICTION MODEL OF LOAN RISK IN BANKS USING DATA MINING
 
Applying Convolutional-GRU for Term Deposit Likelihood Prediction
Applying Convolutional-GRU for Term Deposit Likelihood PredictionApplying Convolutional-GRU for Term Deposit Likelihood Prediction
Applying Convolutional-GRU for Term Deposit Likelihood Prediction
 
Clustering Prediction Techniques in Defining and Predicting Customers Defecti...
Clustering Prediction Techniques in Defining and Predicting Customers Defecti...Clustering Prediction Techniques in Defining and Predicting Customers Defecti...
Clustering Prediction Techniques in Defining and Predicting Customers Defecti...
 
A TWO-STAGE HYBRID MODEL BY USING ARTIFICIAL NEURAL NETWORKS AS FEATURE CONST...
A TWO-STAGE HYBRID MODEL BY USING ARTIFICIAL NEURAL NETWORKS AS FEATURE CONST...A TWO-STAGE HYBRID MODEL BY USING ARTIFICIAL NEURAL NETWORKS AS FEATURE CONST...
A TWO-STAGE HYBRID MODEL BY USING ARTIFICIAL NEURAL NETWORKS AS FEATURE CONST...
 
Credit iconip
Credit iconipCredit iconip
Credit iconip
 
Credit defaulter analysis
Credit defaulter analysisCredit defaulter analysis
Credit defaulter analysis
 
An Explanation Framework for Interpretable Credit Scoring
An Explanation Framework for Interpretable Credit Scoring An Explanation Framework for Interpretable Credit Scoring
An Explanation Framework for Interpretable Credit Scoring
 
Augmentation of Customer’s Profile Dataset Using Genetic Algorithm
Augmentation of Customer’s Profile Dataset Using Genetic AlgorithmAugmentation of Customer’s Profile Dataset Using Genetic Algorithm
Augmentation of Customer’s Profile Dataset Using Genetic Algorithm
 
Improving Credit Card Fraud Detection: Using Machine Learning to Profile and ...
Improving Credit Card Fraud Detection: Using Machine Learning to Profile and ...Improving Credit Card Fraud Detection: Using Machine Learning to Profile and ...
Improving Credit Card Fraud Detection: Using Machine Learning to Profile and ...
 
Text pre-processing of multilingual for sentiment analysis based on social ne...
Text pre-processing of multilingual for sentiment analysis based on social ne...Text pre-processing of multilingual for sentiment analysis based on social ne...
Text pre-processing of multilingual for sentiment analysis based on social ne...
 
A systems engineering methodology for wide area network selection
A systems engineering methodology for wide area network selectionA systems engineering methodology for wide area network selection
A systems engineering methodology for wide area network selection
 
IRJET- Machine Learning Classification Algorithms for Predictive Analysis in ...
IRJET- Machine Learning Classification Algorithms for Predictive Analysis in ...IRJET- Machine Learning Classification Algorithms for Predictive Analysis in ...
IRJET- Machine Learning Classification Algorithms for Predictive Analysis in ...
 
USING NLP APPROACH FOR ANALYZING CUSTOMER REVIEWS
USING NLP APPROACH FOR ANALYZING CUSTOMER REVIEWSUSING NLP APPROACH FOR ANALYZING CUSTOMER REVIEWS
USING NLP APPROACH FOR ANALYZING CUSTOMER REVIEWS
 
A predictive system for detection of bankruptcy using machine learning techni...
A predictive system for detection of bankruptcy using machine learning techni...A predictive system for detection of bankruptcy using machine learning techni...
A predictive system for detection of bankruptcy using machine learning techni...
 
Growing Health Analytics Without Hiring new Staff
Growing Health Analytics Without Hiring new StaffGrowing Health Analytics Without Hiring new Staff
Growing Health Analytics Without Hiring new Staff
 
Developing a PhD Research Topic for Your Research| PhD Assistance UK
Developing a PhD Research Topic for Your Research| PhD Assistance UKDeveloping a PhD Research Topic for Your Research| PhD Assistance UK
Developing a PhD Research Topic for Your Research| PhD Assistance UK
 
Keyword Based Service Recommendation system for Hotel System using Collaborat...
Keyword Based Service Recommendation system for Hotel System using Collaborat...Keyword Based Service Recommendation system for Hotel System using Collaborat...
Keyword Based Service Recommendation system for Hotel System using Collaborat...
 
Evidence Data Preprocessing for Forensic and Legal Analytics
Evidence Data Preprocessing for Forensic and Legal AnalyticsEvidence Data Preprocessing for Forensic and Legal Analytics
Evidence Data Preprocessing for Forensic and Legal Analytics
 
CHURN ANALYSIS AND PLAN RECOMMENDATION FOR TELECOM OPERATORS
CHURN ANALYSIS AND PLAN RECOMMENDATION FOR TELECOM OPERATORSCHURN ANALYSIS AND PLAN RECOMMENDATION FOR TELECOM OPERATORS
CHURN ANALYSIS AND PLAN RECOMMENDATION FOR TELECOM OPERATORS
 
Instance Selection and Optimization of Neural Networks
Instance Selection and Optimization of Neural NetworksInstance Selection and Optimization of Neural Networks
Instance Selection and Optimization of Neural Networks
 

Viewers also liked

книги юбиляры 2015 года (1)
книги юбиляры 2015 года (1)книги юбиляры 2015 года (1)
книги юбиляры 2015 года (1)
yavera8890
 
کازمتیک - نگاهی گذرا بر شوره موی سر
 کازمتیک - نگاهی گذرا بر شوره موی سر  کازمتیک - نگاهی گذرا بر شوره موی سر
کازمتیک - نگاهی گذرا بر شوره موی سر
Mohammad Baghaei
 
Trop
TropTrop
Trop
TropTrop
Cosmetic course by dr Mohammad Baghaei , cosmetic scientist
Cosmetic course by dr Mohammad Baghaei , cosmetic scientist Cosmetic course by dr Mohammad Baghaei , cosmetic scientist
Cosmetic course by dr Mohammad Baghaei , cosmetic scientist
Mohammad Baghaei
 
Kivah
KivahKivah
نگاهی به کازمتیک از دریچه فلسفه ، دکتر محمد بقایی داروساز و پژوهشگر
نگاهی به کازمتیک از دریچه فلسفه ، دکتر محمد بقایی داروساز و پژوهشگر  نگاهی به کازمتیک از دریچه فلسفه ، دکتر محمد بقایی داروساز و پژوهشگر
نگاهی به کازمتیک از دریچه فلسفه ، دکتر محمد بقایی داروساز و پژوهشگر
Mohammad Baghaei
 
Overview of privacy and data protection considerations for DEVELOP
Overview of privacy and data protection considerations for DEVELOPOverview of privacy and data protection considerations for DEVELOP
Overview of privacy and data protection considerations for DEVELOP
Trilateral Research
 
مهارات الحاسوب في القرن 21
مهارات الحاسوب في القرن 21مهارات الحاسوب في القرن 21
مهارات الحاسوب في القرن 21
OushaAlkhyeli
 
E-Learning Trends to Watch 2016
E-Learning Trends to Watch 2016 E-Learning Trends to Watch 2016
E-Learning Trends to Watch 2016
Aurion Learning
 
How to create cashless society in India?
How to create cashless society in India?How to create cashless society in India?
How to create cashless society in India?
Sujai.G Pillai
 
One Library Per Village
One Library Per Village One Library Per Village
One Library Per Village
Sujai.G Pillai
 

Viewers also liked (12)

книги юбиляры 2015 года (1)
книги юбиляры 2015 года (1)книги юбиляры 2015 года (1)
книги юбиляры 2015 года (1)
 
کازمتیک - نگاهی گذرا بر شوره موی سر
 کازمتیک - نگاهی گذرا بر شوره موی سر  کازمتیک - نگاهی گذرا بر شوره موی سر
کازمتیک - نگاهی گذرا بر شوره موی سر
 
Trop
TropTrop
Trop
 
Trop
TropTrop
Trop
 
Cosmetic course by dr Mohammad Baghaei , cosmetic scientist
Cosmetic course by dr Mohammad Baghaei , cosmetic scientist Cosmetic course by dr Mohammad Baghaei , cosmetic scientist
Cosmetic course by dr Mohammad Baghaei , cosmetic scientist
 
Kivah
KivahKivah
Kivah
 
نگاهی به کازمتیک از دریچه فلسفه ، دکتر محمد بقایی داروساز و پژوهشگر
نگاهی به کازمتیک از دریچه فلسفه ، دکتر محمد بقایی داروساز و پژوهشگر  نگاهی به کازمتیک از دریچه فلسفه ، دکتر محمد بقایی داروساز و پژوهشگر
نگاهی به کازمتیک از دریچه فلسفه ، دکتر محمد بقایی داروساز و پژوهشگر
 
Overview of privacy and data protection considerations for DEVELOP
Overview of privacy and data protection considerations for DEVELOPOverview of privacy and data protection considerations for DEVELOP
Overview of privacy and data protection considerations for DEVELOP
 
مهارات الحاسوب في القرن 21
مهارات الحاسوب في القرن 21مهارات الحاسوب في القرن 21
مهارات الحاسوب في القرن 21
 
E-Learning Trends to Watch 2016
E-Learning Trends to Watch 2016 E-Learning Trends to Watch 2016
E-Learning Trends to Watch 2016
 
How to create cashless society in India?
How to create cashless society in India?How to create cashless society in India?
How to create cashless society in India?
 
One Library Per Village
One Library Per Village One Library Per Village
One Library Per Village
 

Similar to credit scoring paper published in eswa

Credit Scoring Using CART Algorithm and Binary Particle Swarm Optimization
Credit Scoring Using CART Algorithm and Binary Particle Swarm Optimization Credit Scoring Using CART Algorithm and Binary Particle Swarm Optimization
Credit Scoring Using CART Algorithm and Binary Particle Swarm Optimization
IJECEIAES
 
Data mining on Financial Data
Data mining on Financial DataData mining on Financial Data
Data mining on Financial Data
AmarnathVenkataraman
 
Supervised and unsupervised data mining approaches in loan default prediction
Supervised and unsupervised data mining approaches in loan default prediction Supervised and unsupervised data mining approaches in loan default prediction
Supervised and unsupervised data mining approaches in loan default prediction
IJECEIAES
 
Credit iconip
Credit iconipCredit iconip
Credit iconip
Armando Vieira
 
LOAN APPROVAL PRDICTION SYSTEM USING MACHINE LEARNING.
LOAN APPROVAL PRDICTION SYSTEM USING MACHINE LEARNING.LOAN APPROVAL PRDICTION SYSTEM USING MACHINE LEARNING.
LOAN APPROVAL PRDICTION SYSTEM USING MACHINE LEARNING.
Souma Maiti
 
Credit risk assessment with imbalanced data sets using SVMs
Credit risk assessment with imbalanced data sets using SVMsCredit risk assessment with imbalanced data sets using SVMs
Credit risk assessment with imbalanced data sets using SVMs
IRJET Journal
 
Loan Default Prediction Using Machine Learning Techniques
Loan Default Prediction Using Machine Learning TechniquesLoan Default Prediction Using Machine Learning Techniques
Loan Default Prediction Using Machine Learning Techniques
IRJET Journal
 
Credit Card Fraud Detection Using Machine Learning
Credit Card Fraud Detection Using Machine LearningCredit Card Fraud Detection Using Machine Learning
Credit Card Fraud Detection Using Machine Learning
IRJET Journal
 
Credit Card Fraud Detection Using Machine Learning
Credit Card Fraud Detection Using Machine LearningCredit Card Fraud Detection Using Machine Learning
Credit Card Fraud Detection Using Machine Learning
IRJET Journal
 
BANK LOAN PREDICTION USING MACHINE LEARNING
BANK LOAN PREDICTION USING MACHINE LEARNINGBANK LOAN PREDICTION USING MACHINE LEARNING
BANK LOAN PREDICTION USING MACHINE LEARNING
IRJET Journal
 
B510519.pdf
B510519.pdfB510519.pdf
B510519.pdf
aijbm
 
Meta Classification Technique for Improving Credit Card Fraud Detection
Meta Classification Technique for Improving Credit Card Fraud Detection Meta Classification Technique for Improving Credit Card Fraud Detection
Meta Classification Technique for Improving Credit Card Fraud Detection
IJSTA
 
Synthetic feature generation to improve accuracy in prediction of credit limits
Synthetic feature generation to improve accuracy in prediction of credit limitsSynthetic feature generation to improve accuracy in prediction of credit limits
Synthetic feature generation to improve accuracy in prediction of credit limits
BOHRInternationalJou1
 
Predictive analytics-white-paper
Predictive analytics-white-paperPredictive analytics-white-paper
Predictive analytics-white-paper
Shubhashish Biswas
 
Credit iconip
Credit iconipCredit iconip
Credit iconip
Armando Vieira
 
In Banking Loan Approval Prediction Using Machine Learning
In Banking Loan Approval Prediction Using Machine LearningIn Banking Loan Approval Prediction Using Machine Learning
In Banking Loan Approval Prediction Using Machine Learning
IRJET Journal
 
PROBABILISTIC CREDIT SCORING FOR COHORTS OF BORROWERS
PROBABILISTIC CREDIT SCORING FOR COHORTS OF BORROWERSPROBABILISTIC CREDIT SCORING FOR COHORTS OF BORROWERS
PROBABILISTIC CREDIT SCORING FOR COHORTS OF BORROWERS
Andresz26
 
03_AJMS_298_21.pdf
03_AJMS_298_21.pdf03_AJMS_298_21.pdf
03_AJMS_298_21.pdf
BRNSS Publication Hub
 
Loan prediction system adi.pptx
Loan prediction system adi.pptxLoan prediction system adi.pptx
Loan prediction system adi.pptx
Shivam327815
 
B05840510
B05840510B05840510
B05840510
IOSR-JEN
 

Similar to credit scoring paper published in eswa (20)

Credit Scoring Using CART Algorithm and Binary Particle Swarm Optimization
Credit Scoring Using CART Algorithm and Binary Particle Swarm Optimization Credit Scoring Using CART Algorithm and Binary Particle Swarm Optimization
Credit Scoring Using CART Algorithm and Binary Particle Swarm Optimization
 
Data mining on Financial Data
Data mining on Financial DataData mining on Financial Data
Data mining on Financial Data
 
Supervised and unsupervised data mining approaches in loan default prediction
Supervised and unsupervised data mining approaches in loan default prediction Supervised and unsupervised data mining approaches in loan default prediction
Supervised and unsupervised data mining approaches in loan default prediction
 
Credit iconip
Credit iconipCredit iconip
Credit iconip
 
LOAN APPROVAL PRDICTION SYSTEM USING MACHINE LEARNING.
LOAN APPROVAL PRDICTION SYSTEM USING MACHINE LEARNING.LOAN APPROVAL PRDICTION SYSTEM USING MACHINE LEARNING.
LOAN APPROVAL PRDICTION SYSTEM USING MACHINE LEARNING.
 
Credit risk assessment with imbalanced data sets using SVMs
Credit risk assessment with imbalanced data sets using SVMsCredit risk assessment with imbalanced data sets using SVMs
Credit risk assessment with imbalanced data sets using SVMs
 
Loan Default Prediction Using Machine Learning Techniques
Loan Default Prediction Using Machine Learning TechniquesLoan Default Prediction Using Machine Learning Techniques
Loan Default Prediction Using Machine Learning Techniques
 
Credit Card Fraud Detection Using Machine Learning
Credit Card Fraud Detection Using Machine LearningCredit Card Fraud Detection Using Machine Learning
Credit Card Fraud Detection Using Machine Learning
 
Credit Card Fraud Detection Using Machine Learning
Credit Card Fraud Detection Using Machine LearningCredit Card Fraud Detection Using Machine Learning
Credit Card Fraud Detection Using Machine Learning
 
BANK LOAN PREDICTION USING MACHINE LEARNING
BANK LOAN PREDICTION USING MACHINE LEARNINGBANK LOAN PREDICTION USING MACHINE LEARNING
BANK LOAN PREDICTION USING MACHINE LEARNING
 
B510519.pdf
B510519.pdfB510519.pdf
B510519.pdf
 
Meta Classification Technique for Improving Credit Card Fraud Detection
Meta Classification Technique for Improving Credit Card Fraud Detection Meta Classification Technique for Improving Credit Card Fraud Detection
Meta Classification Technique for Improving Credit Card Fraud Detection
 
Synthetic feature generation to improve accuracy in prediction of credit limits
Synthetic feature generation to improve accuracy in prediction of credit limitsSynthetic feature generation to improve accuracy in prediction of credit limits
Synthetic feature generation to improve accuracy in prediction of credit limits
 
Predictive analytics-white-paper
Predictive analytics-white-paperPredictive analytics-white-paper
Predictive analytics-white-paper
 
Credit iconip
Credit iconipCredit iconip
Credit iconip
 
In Banking Loan Approval Prediction Using Machine Learning
In Banking Loan Approval Prediction Using Machine LearningIn Banking Loan Approval Prediction Using Machine Learning
In Banking Loan Approval Prediction Using Machine Learning
 
PROBABILISTIC CREDIT SCORING FOR COHORTS OF BORROWERS
PROBABILISTIC CREDIT SCORING FOR COHORTS OF BORROWERSPROBABILISTIC CREDIT SCORING FOR COHORTS OF BORROWERS
PROBABILISTIC CREDIT SCORING FOR COHORTS OF BORROWERS
 
03_AJMS_298_21.pdf
03_AJMS_298_21.pdf03_AJMS_298_21.pdf
03_AJMS_298_21.pdf
 
Loan prediction system adi.pptx
Loan prediction system adi.pptxLoan prediction system adi.pptx
Loan prediction system adi.pptx
 
B05840510
B05840510B05840510
B05840510
 

credit scoring paper published in eswa

  • 1. Computational time reduction for credit scoring: An integrated approach based on support vector machine and stratified sampling method Akhil Bandhu Hens a , Manoj Kumar Tiwari b,⇑ a Department of Mathematics, Indian Institute of Technology, Kharagpur, India b Department of Industrial Engineering and Management, Indian Institute of Technology, Kharagpur, India a r t i c l e i n f o Keywords: Support vector machine Credit scoring F score Stratified sampling a b s t r a c t With the rapid growth of credit industry, credit scoring model has a great significance to issue a credit card to the applicant with a minimum risk. So credit scoring is very important in financial firm like bans etc. With the previous data, a model is established. From that model is decision is taken whether he will be granted for issuing loans, credit cards or he will be rejected. There are several methodologies to con- struct credit scoring model i.e. neural network model, statistical classification techniques, genetic pro- gramming, support vector model etc. Computational time for running a model has a great importance in the 21st century. The algorithms or models with less computational time are more efficient and thus gives more profit to the banks or firms. In this study, we proposed a new strategy to reduce the compu- tational time for credit scoring. In this approach we have used SVM incorporated with the concept of reduction of features using F score and taking a sample instead of taking the whole dataset to create the credit scoring model. We run our method two real dataset to see the performance of the new method. We have compared the result of the new method with the result obtained from other well known method. It is shown that new method for credit scoring model is very much competitive to other method in the view of its accuracy as well as new method has a less computational time than the other methods. Ó 2011 Elsevier Ltd. All rights reserved. 1. Introduction Recently credit industry is growing rapidly with the rapid growth of financial sector, banking sector. The influence of the credit indus- try has been seen the consumer market of the developing and the developed countries. The competitiveness in credit industry is in an larger extent specially in emerging economies. Many financial firms have faced a tight competition in the market with respect to smooth service, efficient service, more benefit to the customers. Credit card is one of the services which every customer wants. Credit cards make the financial transaction a little bit easier. The number of applications for issuing credit cards is also increasing. Every finan- cial firm wants to give better service to the customers and make large profit. But there is a constraint to issue more credit cards with- out any decision. There many some fraud applicant. They can misuse the credit cards. For banking institutions, loans are often the primary source of credit risk. Credit scoring models are used to evaluate the risk. Banks also want to issue more credit cards to increase their profits with minimizing the risk. It has been seen that some of the applications are fraud. Credit scoring models have been extensively used for the credit admission valuation. Many quantitative methods have been developed for the prediction of credits more accurately. Credit scoring models helps to categorize the applicants into two classes: in one case the applicants are accepted and in other cases applicants are rejected. During application procedure various infor- mation about the applicant like income, bank balance, profession, family background, educational background etc. are demanded. Not all of these characteristics are quantitative. Some characteristics are also qualitative. These qualitative characteristics are converted into quantitative characteristics with some standard procedure for the sake of computation. These characteristics are needed for credit scoring model specification. The objectives of credit scoring models are reduction of the cost for credit analysis, to make credit decision making comparatively faster, to make it efficient. Recently, many researchers have done their research work on increasing the efficiency of credit scoring model, reducing the com- putation time. As a result various methods for the decision making of credit analysis have been proposed. These approaches help to detect fraud, assess creditworthiness etc. Baesens et al. (2003) pre- sented the various classification techniques for credit scoring. An effective credit analysis also helps to issue loans with minimum risk. The previous historical data of the applicants for credit cards are necessary to create a credit scoring model. The credit scoring model has been created using the previous data consisting of the applicants’ information and decision taken to their applications. Then this model is applied to a new applicant for credit cards. From 0957-4174/$ - see front matter Ó 2011 Elsevier Ltd. All rights reserved. doi:10.1016/j.eswa.2011.12.057 ⇑ Corresponding author. Tel.: +91 3222 283746. E-mail address: mkt09@hotmail.com (M.K. Tiwari). Expert Systems with Applications 39 (2012) 6774–6781 Contents lists available at SciVerse ScienceDirect Expert Systems with Applications journal homepage: www.elsevier.com/locate/eswa
  • 2. this model creditor makes a decision on a new applicant whether he will be accepted or rejected. With the increase in the accuracy of credit scoring model, the creditors risk is decreased. With the increasing importance of credit scoring model, this field has invoked interests to many researchers to work on it. Filter approach employs better results for credit scoring datasets as com- pare to wrapper approach (Somol, Baesena, Pudil, & Vanthienen, 2005). Many researchers have developed many methods for credit scoring. The computation of some model takes very long time. As a consequence, research works are being continued on reducing the computational method, increasing the overall efficiency of the credit scoring model. If it is needed much time to create a credit scoring model, then it is unworthy and it reduces the profit of the firm. Moreover the efficiency of the firm has been decreased. Computational time has a great significance for credit scoring model. Lower the computational time, it will be more efficient. In this study a new strategy has been proposed that reduces the com- putational time for credit scoring. Creditor takes many character- istics of the applicants for creating a credit scoring model. Some characteristics may not be so useful like other characteristics. If the creditor includes these characteristics, the computational time will be automatically increased. Sometimes the previous data are very large in volume. If the creditor takes the whole data set, the computational time will be very high. In this paper, we have tried to reduce the computational time by reducing the size of the data set to be considered for the computation and optimizing the characteristics (i.e. considering only the suitable characteristics from all characteristics) as well as our other focus is reduce the deviation of the result in our model from the actual result obtained from the whole dataset considering all characteristics. Many modern data mining techniques are used for credit scoring models. For the last two decades various researchers has developed numerous data mining tools and statistical methods for credit scor- ing. Some of the methods are linear discriminant models (Reichert, Cho, & Wagner, 1983), logistic regression models (Henley, 1995), k-nearest neighborhood models (Henley & Hand, 1996), neural network models (Desai, Crook, & Overstreet, 1996; Malhotra & Malhotra, 2002; West, 2000) genetic programming models (Ong, Huang, & Tzeng, 2005; Koza, 1992). Chen and Huang (2003) presented a work to the credit industry that demostrates the advan- tages of Neural network and Genetic algorithm to credit analysis.). Each study has shown some comparative result with other methods. Neural network model is seen to be more effective in credit risk pre- diction comparative to other methods (Tam & Kiang, 1992). Logistic regressions, K-nearest neighborhood method for credit scoring also have a great significance in the view of accuracy and efficiency. Con- sequently, Neural network models are treated as the benchmark in the view of accuracy and solutions. But to get a good solution for a large dataset, more number of hidden layers is required in the neural network model. Consequently, the computational time is very high. So the efficiency is low. Recent research works have focused on increasing the accuracy of the credit scoring model and developing some advanced meth- ods. For example, Ho mann, Baesens, Martens, Put, and Vanthienen (2002) suggested a neuro fuzzy and a genetic fuzzy classifier. A integrated model based on clustering and neural networks for credit scoring was suggested by Hsieh (2005; Garson, 1991; Zhang, 2000). A hybrid system with artificial networks and multivariate adaptive regression splines was proposed by Lee and Chen (2005).There are more hybrid models. Lee, Chiu, Lu, and Chen (2002) suggested a hybrid credit scoring model with neural net- works and discrimininant analysis. Recent research work involves integrating various artificial intelligence methods to data mining approach to increase the accuracy and flexibility. There are many data mining and statistical approach for cluster- ing. Support vector machine (SVM) is an important data mining tool which is being used for clustering, classification etc. Support vector machine was first proposed by Vapnik (1995). After that re- searches have been done to apply this SVM tool in a wide range of many applications. Now SVM is used in many applications like clustering of data, pattern reorganization, text categorization, bio- statistics etc. A simple decomposition method for support vector machine is illustrated by Hsu, Chang, and Lin (2003). In credit scor- ing model classification is necessary. SVM model is also used in credit scoring model for making decision. In recent past few years there has been some comparative as well as hybrid approach stud- ies between SVM and other computational approach. A compara- tive study between SVM and neural network model was done by Huang, Chen, Hsu, Chen, and Wu (2004). An integrated SVM model with genetic algorithm was suggested by Huang, Chen, and Wang (2007); Fro¨hlich and Chapelle (2003); Pontil and Verri (1998). They have shown that the result is comparable to benchmark methods. All the previous studies about credit scoring are discussed about the accuracy of the model. Most probably no previous study discussed about the computational time. 21st century is for high performance computing. Everybody is conscious about the compu- tational time of the method. Any method with low computational time is much more efficient and thus gives more profit to the company. There is not any concrete study to include to sampling methodology in SVM for credit scoring model with the integrating F score (Weston et al., 2001). In this study a new approach has been proposed about the reduction in computational time. In this paper, we have taken a stratified sample and we have done the credit scor- ing model with SVM and F score. Then we have done a comparative study with computation of the whole data and all characteristics. This study is incorporated with the concept of reduction of unnecessary features with the calculation of F score. The reduction of features from the calculation of the sample data takes less time than the reduction of features from the calculation of whole data- set (Kohavi & John, 1997). Here the computational time is reduced for the two reasons: eliminating the unnecessary features and tak- ing a sample instead of considering the whole sample It is shown in that paper that with reduction of features from the data set from the stratified sample gives similar accuracy with other benchmark methods. As a reduction of features and reduction of size of data, the computational time decreases significantly. The paper organized as follows: Section 2 briefly describes the procedure of support vector model. The concept of sampling method and stratified sampling are described in Section 3.In Section 4, new strategy for reduction of computation time is discussed. In Section 5, empirical results are shown for real data set and comparative study is done here. In Section 6, the remarks and conclusion are drawn. 2. Concepts of support vector machine (SVM) classifier SVM classifier was most probably first proposed by Vapnik (1995). Here we have illustrated the concept of SVM (support vector machine) and its application as a two class classifier. Basically SVM is a supervised learning method that analyzes data and recognizes pat- terns, used for statistical classification and regression analysis. Suppose there are given some dataset of pairs (xi,di), i = 1,2,3,. . . ,n where xi 2 Rn and di 2 {À1,+ 1}. The value of di helps us to indicate the class to which the point xi belongs. Each xi is actually a p-dimensional real vector. With the help of we can find out the maximum margin hyper-plane that divides the points having di = 1 from those having di = À1. For this reason SVM is also known as maximum margin classifier. Any hyperplane can be written as the set of points x satisfying r Á x À b ¼ 0 ð1Þ where Á denotes the dot product and the vector r is a normal vector which is perpendicular to the hyperplane. The offset of the A.B. Hens, M.K. Tiwari / Expert Systems with Applications 39 (2012) 6774–6781 6775
  • 3. hyperplane from the origin along the normal vector n can be determined by the parameter b krk . We have to choose the n and b to maximize the margin. The margin is defined as the distance between the parallel hyperplanes that are as far apart as possible while still classifying the data. These hyperplanes are expressed by the follow- ing equations: r Á x À b ¼ 1 ð2Þ and r Á x À b ¼ À1 ð3Þ Our main objective is to Minimize krk subject to constraint diðr:xi À bÞ P 1 for i ¼ f1; 2; . . . ; ng ð4Þ To execute optimization problem in (4) we require the square root computation for finding out the norm. Sometimes we may face dif- ficulty in the square root computation. For this reason, the form of the optimization problem in (4) has been changed to Minimize 1 2 rT r Subject to diðr:xi À bÞ P 1 for i ¼ f1; 2; . . . ; ng ð5Þ This optimization problem in (5) is clearly a quadratic optimization problem. In this optimization problem, the saddle point has to be found out. The optimization problem in (5) can also be written as min r;b max a 1 2 rT r À Xn i¼1 aiðdiðr:xi À bÞ À 1Þ ( ) ð6Þ where ai is the Lagrange multiplier, hence ai > =0. The solution of this optimization problem can be expressed by terms of linear com- bination of the training vectors as r ¼ Xn i¼1 aixidi ð7Þ For the sake of computation we perform differentiation with re- spect to r and b, as well as we introduce the Karush–Kuhn–Tucker (KKT) condition (Mao, 2004). As a result, the expression in (7) can be transformed to the dual Lagrangian LD(a): Max a LDðaÞ ¼ Xn i¼1 ai À 1 2 Xn i;j¼1 aiajdidj < xi Á xj > ð8Þ Subject to: ai P 0 for i = 1,2,. . .,n and Pn i¼1aidi ¼ 0 The solution ai determines the parameters r⁄ and b⁄ of the opti- mal hyperplane in the case of dual optimization problem. Thus we can express the optimal hyperplane decision function as fðx; aà ; b Ã Þ ¼ sgn Xn i¼1 diaà i < xi Á xj > þb à ! ð9Þ But in reality, only a small number of Lagrange multipliers usually tend to be positive and these vectors are in the proximity of the optimal hyperplane. The respective training vectors to these posi- tive lagrange multipliers are support vectors. The optimal hyper- plane f(x,a⁄ ,b⁄ ) depends on these support vectors. The extension of the above concept can be found in nonseper- able case (i.e. linear generalized support vector machine). In the purpose of minimum number of training error, the problem of finding the hyperplane for these induced hyperplane has the fol- lowing expression: Min r;b;n 1 2 rT r þ C Xn i¼1 ni subject to : dið< r:xi > þbÞ þ ni À 1 P 0 and ni P 0 ð10Þ where ni is the positive slack variables and C is a penalty parameter for training error during validation on test data set. The optimization problem in (10) can be solved with the help of Lagrangian method. The corresponding optimization problem can be written as: Max a Xn i¼1 ai À 1 2 Xn i;j¼1 aiajdidj < xi:xj > Subject to : 0 6 ai 6 C for i ¼ 1; 2; . . . ; n and Xn i¼1 aidi ¼ 0 ð11Þ The user defined penalty parameter C is the upper bound of ai.. The nonlinear Support vector machine helps for the mapping of the training samples from the input space into a higher dimen- sional feature space via a mapping function U. The inner product has to be replaced by kernel function as the following expression (Scholkopt & Smola, 2000): ðUðxiÞ Á UðxjÞÞ ¼ kðxi;xjÞ ð12Þ Then the equation will be transformed to: Max a Xn i¼1 ai À 1 2 Xn i;j¼1 aiajdidjkðxi; xjÞ Subject to : 0 6 ai 6 C for i ¼ 1; 2; . . . ; n and Xn i¼1 aidi ¼ 0 ð13Þ For the linear generalized case, the decision function is as following expression: fðx; aà ; b Ã Þ ¼ sgn Xn i¼1 diaà i kðxi; xjÞ þ b à ! ð14Þ 3. Concept of stratified sampling Stratification is the process of grouping members of the popula- tion into relatively homogeneous subgroups before sampling. The strata should be mutually exclusive: every element in the popula- tion must be assigned to only one stratum. The strata should also be collectively exhaustive: no population element can be excluded. Then random or systematic sampling is applied within each stra- tum. This often improves the representativeness of the sample by reducing sampling error. Thus stratified sampling is one of the best sampling methods that represent the characteristics of the data. It has been proved that the variation of result with the stratified sam- pling is less than most of the sampling processes. In Stratified sampling the population of N units in first divided of into subpopulation of N1, N2,. . .,NL units respectively. These sub- populations are overlapping and together they comprise the whole of the population i.e. N1 þ N2 þ Á Á Á þ NL ¼ N ð15Þ These subpopulations are called as strata. When the strata have been determined, a sample is drawn from each, the drawings being made independently in different strata. The sample sizes within the strata are denoted by n1,n2,. . .,nL, respectively such that n1 þ n2 þ Á Á Á þ nL ¼ n ð16Þ where n is the total sample size. In this study proportionate stratified sampling method is uti- lized. The main criteria of proportionate stratified sampling is: nh n ¼ Nh N ð18Þ where Nh denotes the total number of units in the hth strata and nh denotes the total number of units drawn from the hth strata as a sample. From the Eq. (18) it is clear that if we have taken the Nh 6776 A.B. Hens, M.K. Tiwari / Expert Systems with Applications 39 (2012) 6774–6781
  • 4. to be almost equal for all the strata, so the all the nh should be nearly equal in magnitude. 4. Reduction of computational time by using F score and sampling approach 4.1. Sample selection form the data In this study we use proportionate stratified sampling approach because the dataset is homogeneous. We know that stratified sam- pling is applicable to homogeneous data. It is one of the most well known sampling approaches for creating a good sample which rep- resent the characteristics of the dataset. First, we have created some strata which contains almost equal number of data i.e. some bins containing almost equal number of data. Then randomly se- lect some defined percentage of data from each stratum. Then the selected data are put together to generate the sample. This is the method for generating a sample using stratified sampling. Here we also have taken previous dataset and make some strata of al- most equal sizes. Then we create the sample using the stratified sampling approach. 4.2. Sorting the input features using F score The F score computation was first proposed by Chen and Lin (2005). F score computation is a very simple technique but it is very much efficient for the measurement the discrimination of two sets of real numbers. First of all, we will find out the F score for every feature from the sample. Suppose the training vectors are xk (k = 1,2,. . .,m). There are certain numbers of positive and negative instances. We denote the number of positive instances as s+ and the number of negative instances as sÀ respectively. We denote xi as the averages of the ith feature of the whole dataset whereas x ðþÞ i and x ðÀÞ i denote averages of the ith feature of the po- sitive and ith feature onegative datasets respectively. The ith fea- ture of kth positive instance and ith feature of kth negative instances can be denoted as x ðþÞ k;i and x ðÀÞ k;i respectively. Then the F score of every feature can be computed as the following expression: Fi ¼ x ðþÞ i À xi 2 þ x ðÀÞ i À xi 2 1 sþÀ1 Pnþ k¼1 x ðþÞ k;i À x ðþÞ i 2 þ 1 sÀÀ1 PnÀ k¼1 x ðÀÞ k;i À x ðÀÞ i 2 ð19Þ In the expression of the F score above, the numerator signifies the discrimination between the positive and negative sets. The denom- inator of the F score is summation of the sample variance of the po- sitive sets and the negative sets. The larger value of F score implies that corresponding feature is more discriminative. By the following expression of F score we can easily compute F score of every feature from the sample of the credit dataset. 4.3. Reduction of features Suppose there are m features. All features may not provide their impact for making decision in credit scoring. If we consider all the unnecessary features for the computation of credit scoring, it will take a long time. So it is unworthy. If we delete those unnecessary features from the dataset, computational time makes fast and it re- duces the complicacy of the computation. We sorted the features in descending order according to their F score taken calculated from sample and the features are given rank from 1 to m. We select the cutoff feature by the following method described below. After getting the cut off feature we will take only the features from the feature ranked as 1 to the cut off feature for further calculation. The cut off feature can be found out by the following procedure: Step 1. Calculate the F score of every feature form the sample. Step 2. Sort the F score in the descending order and give them rank from 1 to m. Step 3. Select the feature from rank 1 to rank k(k = 1,2,. . .,m). For each case go to step 4. Step 4. (a) Randomly split the training data into training dataset and validation dataset using 10-fold cross validation. For each fold the following steps are done (b) Suppose for a particular fold Dt be the training data and Dv be the validation data. Using the SVM proce- dure the predictor has to be found out from Dt. The obtained predictor from SVM has to be applied on Dv to follow the performance. (c) Calculate the average validation accuracy for the 10- fold cross validation. Store this result. Step 5. Plot all the results. Step 6. The plot has to be analyzed carefully. From which point onwards the fluctuation in the accuracy are less and the accuracy are nearby the value of the accuracy of taking all the features. That particular feature is to be considered as the cut off feature. The next features of the cut off fea- ture and onwards are not to be considered in the compu- tation for further SVM model calculation as these features do not show their importance the result. Henceforth, if one can get another dataset of similar types, he can easily drop out the some unnecessary features. The total computation SVM integrated with F score ranking to be done on the sample. The size of the sample has to be determined by the creditor. It has been experi- enced that the computational time has been reduced significantly. To verifytheresultobtainedfromthenewmethoddescribedinthispaper, we have done the calculation on the whole dataset using all features. It has been shown that the accuracy obtained in our model is almost same to the accuracy obtained from the computation on the whole dataset and all features for both the datasets. Thus the computation makes faster, easy and of less computational time. 5. Empirical analysis 5.1. Credit data sets We have taken two real world data sets for the analysis in this study. These are Australian dataset and German dataset. The sources of these two datasets are the UCI Repository of machine learning databases. Total number of instances in the German data- set is 1000. Each of the instances has 24 attributes and one class attribute. 700 instances of the whole dataset are creditworthy applicants and there are 300 instances where credit is not worthy. On the other hand the total number of instances in the Australian dataset is 690. Each of the instances has 6 nominal, 8 numeric attri- butes and one class attributes. 307 instances of the whole dataset are creditworthy and the rest 383 instances imply that credit is not creditworthy for these instances. Later we can see that we have got some interesting results from the analysis of these two datasets. Characteristics of Australian and German real dataset has been pre- sented in Table 1. The German dataset is more unbalanced than Australian dataset (see Table 1). 5.2. Experimental result for Australian dataset In this study, we have taken a 25% stratified sample of the Aus- tralian dataset. In the Australian dataset, there are 14 features. First we have calculated the F score of each attribute from the sample. We have calculated the F score for each attribute from the whole A.B. Hens, M.K. Tiwari / Expert Systems with Applications 39 (2012) 6774–6781 6777
  • 5. data set also. We can see form the Table 2 that the F score for both the sample and the whole data sets are almost same and the rank- ing of the features in the descending order for both cases are al- most same. In Fig. 1 we can easily see that the F scores for both the actual and the sample data. It is clear from the Fig. 1 that the F score for both actual data and the sample data are almost same. So, the discrimination of the attributes in the actual dataset and the sam- ple dataset are similar. The entire features are not so much neces- sary for the computation of the credit scoring. Some features have a little importance in the model. We can eliminate those features to reduce the computational time. The deviation of accuracy for elimination of some feature does not show their impact in the re- sult. So we have to eliminate those features. At first, we have sorted the features in descending order according to their F score from the sample. Then we rank them from 1 to 14. Then we take the k features starting from rank 1(k = 1,2,3,. . .,14), and perform 10 cross validation using support vector model procedure and evaluated the average accuracy rate in 10-fold cross validation. Then we have to plot the average accu- racy rate for each case. The accuracy for each case is shown in Ta- ble 3. From the characteristics of the plot, we can decide the cut off feature. We have to choose that particular feature in the plot from that and onwards the average accuracy rate in SVM are not fluctu- ating so much. From the Fig. 2, we can select the cut off feature of the Australian dataset as to rank 9. So we will not consider the fea- tures of rank 10 and onwards as adding these features do not show their impact for the average accuracy rate of the SVM computation. Thus, this reduction of features reduces our computational time significantly as runtime complexity of SVM procedure is more than linear time multiplicity (i.e. O(nk ), k 1 and n = number of data points in the dataset). We have verified the runtime in MATLAB. We see that the runtime reduces significantly. To verify cut off fea- ture of our result in the stratified sample, we have again perform the same thing for the whole data like the sample data. But in this time the ranking is by the F score in the actual data not according to the sample data. Then we have plotted (in Fig. 2) the average accuracy rate in the SVM procedure. It is clear from the plot that the accuracy rates from 9 and onwards are almost same with a lit- tle variance. So, we do not consider the feature 10 and onwards for our computation. 5.3. Experimental result for German dataset Like the Australian dataset, we have taken a 25% stratified sam- ple of the German dataset. In the German dataset, there are 24 fea- tures. First we have calculated the F score of each attribute from the sample. We have calculated the F score for each attribute from the whole data set also. We can see form the Table 4 that the F score for both the sample and the whole data sets are almost same and we have also noticed that the ranking of the features in the descending order in both cases are almost same. In Fig. 3 we can easily see that the F scores for both the actual and the sample data. It is clear from the Fig. 1 that the F score for both actual data and the sample data are almost same. So, the discrimination of the attributes in the actual dataset and the sam- ple dataset are similar. As the entire feature are not so much necessary for the computation of the credit scoring. Some features have a little importance in the model. The variation in the value of these features does not have much impact. These unnecessary fea- tures are not considered to reduce the computational time. The deviation of accuracy after elimination of some feature does not show their impact in the result. We have eliminated those features. At first, we have sorted the features in descending order accord- ing to their F score from the sample. Then we rank them from 1 to 14.Then we take the k features starting from rank 1(k = 1,2,3, . . .,24), and perform 10 cross validation using support vector model procedure and evaluated the average accuracy rate in 10-fold cross validation. The result is shown in Table 5. Then we have to plot the average accuracy rate for each case. From the characteristics of the plot, we can decide the cut off features. We have to choose that feature in the plot from that and onwards the average accuracy rate in SVM are not fluctuating so much and the average accuracy of that feature is almost same to the accuracy for the case of considering all the features, shown in Table 6 reveals those features which to be considered for further computation in Australian and German dataset. From the Fig. 4, we can select the cut off feature of the German dataset as to rank 13. So we will not consider the features of rank 14 and onwards as adding these features do not show their impact for the average accuracy rate of the SVM computation. Thus, this reduction of features reduces our computational time significantly as runtime complexity of SVM procedure is more than linear time multiplicity (i.e. O(nk ), k 1 and n = number of data points in the dataset). We have verified the runtime in MATLAB. We see that the runtime reduces significantly. To verify cut off feature of our Table 1 Characteristics of two real dataset. Data set No of classes No of instances Nominal feature Numeric feature Total features Australian 2 690 6 8 14 German 2 1000 0 8 24 Table 2 F score for the features in the Australian dataset for the sample data and the whole dataset. Feature 1 2 3 4 5 6 7 Actual data 0.0002 0.0269 0.0443 0.0411 0.1662 0.0658 0.1110 Sample data 0.0023 0.1014 0.0059 0.0438 0.1723 0.1209 0.1338 Feature 8 9 10 11 12 13 14 Actual data 1.1506 0.2683 0.1835 0.0010 0.0141 0.0104 0.0290 Sample data 1.2468 0.2777 0.1631 0.0000 0.0194 0.0115 0.0653 Fig. 1. F score plot for sample data and actual data of Australian dataset. 6778 A.B. Hens, M.K. Tiwari / Expert Systems with Applications 39 (2012) 6774–6781
  • 6. result in the stratified sample, we have again perform the same thing for the whole data like the sample data. But in this time the ranking is by the F score in the actual data not according to the sample data. Then we have plotted the average accuracy rate in the SVM procedure. It is clear from the plot that the accu- racy rates from 13 and onwards is almost same with a little vari- ance. So, we do not consider the feature 14 and onwards for our computation. 5.4. Comparison to other methods in computational time In previous studies, several approaches like genetic program- ming, neural network, support vector model, decision tree, SVM based genetic algorithm has been applied to credit scoring (Quin- lan, 1986). All these models are performing well for credit scoring. In neural network model, one may not get expected result at the first time. In order to get expected result, the numbers of hidden layers have to be optimized. Larger the number of hidden layers in neural network model, the flexibility of the neural network model will be larger because then the network has more parameter to optimize. Consequently, the accuracy level will be high. But with Table 3 Accuracy rate for SVM method for sample data and whole data of Australian dataset. No of features in the sorted list 1 2 3 4 5 6 7 Sample data 0.8753 0.8378 0.8225 0.8661 0.8851 0.8349 0.8669 Actual data 0.8530 0.8716 0.8623 0.8667 0.8598 0.8554 0.8559 no of features in the sorted list 8 9 10 11 12 13 14 Sample data 0.8661 0.8598 0.8487 0.8536 0.8631 0.8516 0.8683 Actual data 0.8521 0.8723 0.8701 0.8658 0.8693 0.8619 0.8710 Fig. 2. Accuracy for sample data and the actual data of Australian dataset. Table 4 F score of features of the sample data and the actual dataset for the German dataset. Feature 1 2 3 4 5 6 7 8 Sample data 0.2022 0.0153 0.0869 0.0197 0.0336 0.0475 0.0033 0.0015 Actual data 0.2055 0.0619 0.0752 0.0286 0.0498 0.0186 0.0105 0 feature 9 10 11 12 13 14 15 16 Sample data 0.0131 0.0004 0.0177 0.0183 0.0119 0.0001 0.0009 0.0389 Actual data 0.0285 0.0116 0.0156 0.0029 0 0.0018 0.0114 0.0124 feature 17 18 19 20 21 22 23 24 Sample data 0.0314 0.0098 0.0016 0.0113 0.0167 0.0086 0.0014 0.0055 Actual data 0.0157 0 0.0048 0.0112 0.0242 0 0.0007 0.0003 Fig. 3. Plot of the F score from actual data and sample data of German dataset. A.B. Hens, M.K. Tiwari / Expert Systems with Applications 39 (2012) 6774–6781 6779
  • 7. the increase of hidden layers, the runtime will be also very high. Hence, for a large database, credit scoring based on neural network model will take a long time. Genetic programming also will take a long time because at first the function set is initialized. We will get the terminal set from the dataset. If we will take function sets of many functions, it will have more flexibility. Thus, the accuracy will be high. But at the same time, with a large function set and a large dataset the computational time will be much high. Both the GP and BPN are stochastic process. So it will take a long com- putational time. But support vector model is a quadratic optimization procedure. Here user does not require to specify any parameter beforehand. Its runtime is faster than the BPN, GP model. While the GA based SVM model (Huang et al. 2005) is time costly than simple SVM model. The time complexity for SVM model is more than linear time com- plexity (i.e. O(nk ), k 1 and n = number of data points in the data- set). In this study, the runtime decreased significantly because of taking sample data instead of whole data set and reduction of unnecessary features using F score. The significant decrease in run- time for the execution of the SVM model with less data sets and less number of features can be experienced easily in MATLAB. We have eliminated the features using the F score calculation from sample rather than the calculation from the whole data set. Overall, the runtime is less than other methods. Moreover, the procedure of discussed in this paper produces similar accuracy like other benchmark methods. 5.5. Comparison to other method in accuracy efficiency Then we measured the accuracy rate for the four procedure and we compared our sampling based SVM procedure with other methods. The comparative results for two data set s are shown in Tables 7 and 8. It is clear from the table our fast computation Table 5 Accuracy rate of SVM for actual data and sample data from German dataset. No of features in the sorted list 1 2 3 4 5 6 7 8 Sample data 0.7281 0.7314 0.7815 0.7753 0.8042 0.7687 0.7829 0.7775 Actual data 0.6912 0.7129 0.7499 0.7517 0.7526 0.7562 0.7689 0.7570 No of features in the sorted list 9 10 11 12 13 14 15 16 Sample data 0.7747 0.7674 0.7513 0.7675 0.7508 0.7431 0.7519 0.7423 Actual data 0.7581 0.7657 0.7632 0.7670 0.7674 0.7560 0.7613 0.7736 No of features in the sorted list 17 18 19 20 21 22 23 24 Sample data 0.7611 0.7468 0.7608 0.7478 0.7537 0.7637 0.7586 0.7560 Actual data 0.7739 0.7768 0.7591 0.7689 0.7651 0.7521 0.7732 0.7716 Table 6 Features to be considered for further computation in two dataset. Dataset Total features Features to be considered for further computation Australian dataset 14 9 German dataset 24 13 Fig. 4. Plot of accuracy for sample and actual data set for German dataset. Table 7 Comparative study for various methods for Australian dataset. Method Accuracy rate (in %) Std (in %) Australian data Sampling procedure in SVM 85.98 3.89 SVM + GA 86.76 3.78 BPN 86.71 3.41 GP 86.83 3.96 Table 8 Comparative study for various methods for German dataset. Method Accuracy rate (in %) Std (in %) German Data Sampling procedure in SVM 75.08 3.92 SVM + GA 76.84 3.82 BPN 76.69 3.24 GP 77.26 4.06 6780 A.B. Hens, M.K. Tiwari / Expert Systems with Applications 39 (2012) 6774–6781
  • 8. method is well competitive with respect to other methods. The average accuracy of the new method is almost same with other methods. 6. Conclusion Credit scoring is very much necessary for every bank to make decision to a new applicant. Credit industry is increasing rapidly. Banks want to get more profit by issuing more credit cards with the constraint of minimum risk (i.e. minimizing the number of pos- sible fraud applications). Credit scoring model helps to classify a new applicant as accepted or rejected. There are various method for creating a credit scoring model such as traditional statistical techniques, neural networks, support vector model, genetic pro- gramming etc. For statistical techniques the creditor should know the relationship among the various features. But the other methods like GP, BPN, SVM do not require any underlying relationship among the features. For GP, the creditors have to specify the func- tion set. For different function set the result may be different. For BPN, the creditors have to specify the structure of the neural net- work. More the number of hidden layers, the flexibility will be high. Consequently the computational time will be high. BPN and GP are the stochastic process, so it requires high amount of compu- tational time. Comparatively, SVM is a quadratic optimization problem. So, Creditor does not require to specify any parameter for the computation. With respect to GP, the computational time of SVM is less. Sometimes due to large size of dataset the compu- tational time may be high but still is less than the computational time of GP. In this paper, we have suggested a hybrid approach of sam- pling, SVM and F score. Our main objective is to study the new approach and make a comparative analysis of the computa- tional time and accuracy with some other methods. Here we summarize the whole method. From the whole dataset, creditor have to take a stratified sample as the stratified sample is one of the best sampling method that represents the characteristics of the dataset. The determination of sample size is very important. Sample size is to be predicted in such a way that study of the sample nearly represents the result obtained from the study of whole dataset. Depending on the size of the dataset, creditors have to predict the size of the sample that will reduce the devi- ation from the computational result of actual dataset. After cal- culating the F score from the sample, the features have to be sorted in descending order according to their F score. F score actually signifies the importance of each feature in the dataset. Then perform the SVM as described in Section 4. From the plot one can easily eliminate the features which are not needed for future calculation. Initially, the differences in the accuracy re- sults for consecutive results are higher than later because there may be some correlation between features. By selecting some features, there may be some unselected feature which is corre- lated to some selected feature. But after certain steps the results becomes comparatively stable. From that step we can find out the unnecessary features. These unnecessary features unneces- sarily increase the runtime of the computation. Thus by decreas- ing the features from the computation from the sample is less costly than the same from the computation from the whole dataset. Thus new method for credit scoring which is proposed in this study, is very much computationally efficient as well as reliable in the view of its accuracy. References Baesens, B., Van Gestel, T., Viaene, S., Stepanova, M., Suykens, J., Vanthienen, J. (2003). Benchmarking state-of-the-art classification algorithms for credit scoring. Journal of the Operational Research Society, 54(6), 627–635. Chen, Y.-W., Lin, C.-J. (2005). Combining SVMs with various feature selection strategies. Available from http://www.csie.ntu.edu.tw/$cjlin/papers/ features.pdf. Chen, M. C., Huang, S. H. (2003). Credit scoring and rejected instances reassigning through evolutionary computation techniques. Expert Systems with Applications, 24(4), 433–441. Desai, V. S., Crook, J. N., Overstreet, G. A. (1996). A comparison of neural networks and linear scoring models in the credit union environment. European Journal of Operational Research, 95(1), 24–37. Fro¨hlich, H., Chapelle, O. (2003), Feature selection for support vector machines by means of genetic algorithms. In Proceedings of the 15th IEEE international conference on tools with artificial intelligence, Sacramento, California, USA, (pp. 142–148). Garson, G. D. (1991). Interpreting neural-network connection weights. AI Expert, 6(4), 47–51. Henley, W. E. (1995), Statistical aspects of credit scoring. Dissertation, The Open University, Milton Keynes, UK. Henley, W. E., Hand, D. J. (1996). A k-nearest neighbor classifier for assessing consumer credit risk. Statistician, 44(1), 77–95. Ho mann, F., Baesens, B., Martens, J., Put, F., Vanthienen, J. (2002). Comparing a genetic fuzzy and a neurofuzzy classifier for credit scoring. International Journal of Intelligent Systems, 17(11), 1067–1083. Hsieh, N.-C. (2005). Hybrid mining approach in the design of credit scoring models. Expert Systems with Applications, 28(4), 655–665. Hsu, C. W., Chang, C. C., Lin, C. J. (2003), A practical guide to support vector classification. Available from http://www.csie.ntu.edu.tw/$cjlin/papers/ guide/guide.pdf. Huang, Z., Chen, H., Hsu, C.-J., Chen, W.-H., Wu, S. (2004). Credit rating analysis with support vector machines and neural networks: A market comparative study. Decision Support Systems, 37(4), 543–558. Huang, C. L., Chen, M. C., Wang, J. W. (2007). Credit scoring with a data mining approach based on support vector machine. Expert Systems with Applications, 33(2007), 847–856. Kohavi, R., John, G. (1997). Wrappers for feature subset selection. Artificial Intelligence, 97(1–2), 273–324. Koza, J. R. (1992). Genetic Programming: On the Programming of Computers by Means of Natural Selection. Cambridge, MA: The MIT Press. Lee, T.-S., Chen, I.-F. (2005). A two-stage hybrid credit scoring model using artificial neural networks and multivariate adaptive regression splines. Expert Systems with Applications, 28(4), 743–752. Lee, T.-S., Chiu, C.-C., Lu, C.-J., Chen, I.-F. (2002). Credit scoring using the hybrid neural discriminant technique. Expert Systems with Applications, 23(3), 245–254. Malhotra, R., Malhotra, D. K. (2002). Differentiating between good credits and bad credits using neuro-fuzzy systems. European Journal of Operational Research, 136(1), 190–211. Mao, K. Z. (2004). Feature subset selection for support vector machines through discriminative function pruning analysis. IEEE Transactions on Systems, Man, and Cybernetics, 34(1), 60–67. Ong, C.-S., Huang, J.-J., Tzeng, G.-H. (2005). Building credit scoring models using genetic programming. Expert Systems with Applications, 29(1), 41–47. Pontil, M., Verri, A. (1998). Support vector machines for 3D object recognition. IEEE Transactions on Pattern Analysis and Machine Intelligence, 20(6), 637–646. Quinlan, J. R. (1986). Induction of decision trees. Machine Learning, 1(1), 81–106. Reichert, A. K., Cho, C. C., Wagner, G. M. (1983). An examination of the conceptual issues involved in developing credit-scoring models. Journal of Business and Economic Statistics, 1(2), 101–114. Scholkopf, B., Smola, A. J. (2000). Statistical Learning and Kernel Methods. Cambridge, MA: MIT Press. Somol, P., Baesens, B., Pudil, P., Vanthienen, J. (2005). Filter-versus wrapper-based feature selection for credit scoring. International Journal of Intelligent Systems, 20(10), 985–999. Tam, K. Y., Kiang, M. Y. (1992). Managerial applications of the neural networks: The case of bank failure prediction. Management Science, 38(7), 926–947. Vapnik, V. N. (1995). The Nature of Statistical Learning Theory. New York: Springer- Verlag. West, D. (2000). Neural network credit scoring models. Computers and Operations Research, 27(11–12), 1131–1152. Weston, J., Mukherjee, S., Chapelle, O., Pontil, M., Poggio, T., Vapnik, V. (2001). Feature Selection for SVM. In S. A. Solla, T. K. Leen, K.-R. Muller (Eds.). Advances in Neural Information Processing Systems (Vol. 13, pp. 668–674). Cambridge, MA: MIT Press. Zhang, G. P. (2000). Neural networks for classification: a survey. IEEE Transactions on Systems, Man, and Cybernetics—Part C: Applications and Reviews, 30(4), 451–462. A.B. Hens, M.K. Tiwari / Expert Systems with Applications 39 (2012) 6774–6781 6781