Download Link > https://ertekprojects.com/gurdal-ertek-publications/blog/scoring-and-predicting-risk-preferences/
This study presents amethodology to determine risk scores of individ-uals, for a given financial risk preference survey. To this end, we use a regression-based iterative algorithm to determine the weights for survey questions in the scoring process. Next, we generate classification models to classify individuals into risk-averse and risk-seeking categories, using a subset of survey questions. We illustrate the methodology through a sample survey with 656 respondents. We find that the demographic (indirect) questions can be almost as successful as risk-related (direct) questions in predicting risk preference classes of respon-dents. Using a decision-tree based classification model, we discuss how one can generate actionable business rules based on the findings.
ENSEMBLE LEARNING MODEL FOR SCREENING AUTISM IN CHILDRENijcsit
Autistic Spectrum Disorder (ASD) is a neurological condition associated with communication, repetitive,
and social challenges. ASD screening is the process of detecting potential autistic traits in individuals
using tests conducted by a medical professional, a caregiver, or a parent. These tests often contain large
numbers of items to be covered by the user and they generate a score based on scoring functions designed
by psychologists and behavioural scientists. Potential technologies that may improve the reliability and
accuracy of ASD tests are Artificial Intelligence and Machine Learning. This paper presents a new
framework for ASD screening based on Ensembles Learning called Ensemble Classification for Autism
Screening (ECAS). ECAS employs a powerful learning method that considers constructing multiple
classifiers from historical cases and controls and then utilizes these classifiers to predict autistic traits in
test instances. ECAS performance has been measured on a real dataset related to cases and controls of
children and using different Machine Learning techniques. The results revealed that ECAS was able to
generate better classifiers from the children dataset than the other Machine Learning methods considered
in regard to levels of sensitivity, specificity, and accuracy.
This document provides an overview of different types of health research. It discusses theoretical vs applied research, with theoretical research seeking to expand knowledge and applied research creating practical solutions. Preventive research tests treatments to prevent disease, while therapeutic research tests treatments for disease. Bench research is done in laboratories, while bedside research involves patients. Exploratory research investigates new problems, while confirmatory research tests predefined hypotheses. Implementation research applies knowledge to health policies and practices, and translational research translates basic findings to clinical applications. The document also discusses causes and effects, errors in research, confounders, and effect modifiers.
Impact of Perceived Fairness on Performance Appraisal System for Academic Sta...IJSRP Journal
This study investigates the employees’ perception of fairness in the performance appraisal system for academic staff of the General Sir Jhon Kotelawala Defence University.
Meta-analysis is defined as quantitatively combining and integrating the findings of multiple research studies on a particular topic. It was coined by Glass in 1976 and refers to analyzing the results of several studies that address a shared research hypothesis. The key steps in a meta-analysis involve defining a hypothesis, locating relevant studies, inputting empirical data, calculating an overall effect size by standardizing statistics, and analyzing any moderating variables if heterogeneity exists. An example provided is a meta-analysis on coping behaviors of cancer patients that would statistically analyze results from quantitative studies with similar age groups.
This document is a student assignment applying exploratory factor analysis to survey data on the importance of supermarket features. It includes an introduction outlining the study's purpose and structure. The document then reviews the theory of exploratory factor analysis and applies it to analyze survey data on 14 items measuring the importance of supermarket features. The analysis identifies underlying dimensions or factors in the data. The document presents the results of the factor analysis and discusses implications for marketing grocery stores to students.
This document provides an overview of statistics used in meta-analysis. It discusses key concepts like odds ratios, relative risk, confidence intervals, heterogeneity, and fixed and random effects models. It also summarizes different types of meta-analyses including realist reviews, meta-narrative reviews, and network meta-analyses. Software for performing meta-analyses and potential pitfalls in systematic reviews are also briefly covered.
A Framework for Statistical Simulation of Physiological Responses (SSPR).Waqas Tariq
The problem of variable selection from a large number of variables to predict certain important dependent variables has been of interest to both applied statisticians and other researchers in applied physiology. For this purpose, various statistical techniques have been developed. This framework embedded various statistical techniques of sampling and resampling and help in Statistical Simulation for Physiological Responses under different Environmental condition. The population generation and other statistical calculations are based on the inputs provided by the user as mean vector and covariance matrix and the data. This framework is developed in a way that it can work for the original data as well as for simulated data generated by the software. Approach: The mean vector and covariance matrix are sufficient statistics when the underlying distribution is multivariate normal. This framework uses these two inputs and is able to generate simulated multivariate normal population for any number of variables. The software changes the manual operation into a computer-based system to automate the study, provide efficiency, accuracy, timelessness, and economy. Result: A complete framework that can statistically simulate any type and any number of responses or variables. If the simulated data is analyzed using statistical techniques; the results of such analysis will be the same as that using the original data. If the data is missing for some of the variables, in that case the system will also help. Conclusion: The proposed system makes it possible to carry out the physiological studies and statistical calculations even if the actual data is not present.
A conceptual design of analytical hierachical process model to the boko haram...Alexander Decker
This document describes using the Analytical Hierarchical Process (AHP) model to analyze solutions to the Boko Haram crisis in Nigeria. The AHP model was used to build a hierarchy with the overall goal of resolving the crisis at the top, then criteria, objectives, and potential alternatives below. Experts were surveyed to determine the relative priorities of criteria, objectives, and alternatives. The results found that dialogue should focus on imposition of Sharia rule and security, as these had the highest priority for Boko Haram and the Federal Government respectively. For a lasting solution, violent demonstrations should be replaced with dialogue centered on these key issues.
The document discusses important statistical terms related to sampling. It defines population as the set of all measurements of interest to the researcher, and sample as a subset of the population. Sampling is done to get information about large populations at lower cost and with greater accuracy compared to studying the entire population. The document outlines different types of sampling methods including probability and non-probability sampling, and provides examples like simple random sampling, systematic sampling, and cluster sampling. It also discusses factors like sampling size, sampling error, and type 1 and type 2 errors.
Assessment of prospective physician characteristics by SWOT analysisThira Woratanarat
This document summarizes a study that used SWOT (strengths, weaknesses, opportunities, threats) analysis to assess the characteristics of 568 medical students in Thailand from 2008-2010. The analysis identified 4 key issues: not wanting to be a doctor, having inadequate medical skills, not wanting to work in rural areas, and wanting to pursue high-paying specialties. The percentages of students not wanting to be doctors or work in rural areas increased over the 3 years. The study concludes these attitudes could impact Thailand's ability to address its physician shortage if not addressed by medical schools through intervention.
This research examines using the Analytical Hierarchy Process (AHP) to help a potential graduate student select the best school to attend for a JD/PhD in Management. AHP quantifies qualitative factors to help make objective decisions. The researcher evaluates 3 schools based on proximity to home, job prospects, financial aid, and prestige. A pairwise comparison analysis assigns weights to each factor. Results show Northwestern is the best option as it most closely aligns with the student's preferences of proximity, aid, and career outcomes. AHP maintains consistency and prevents bias, providing an effective tool for graduate school selection.
This document summarizes a study that used machine learning algorithms to predict happiness based on survey data from over 4,600 users. The researchers analyzed data from 100+ survey questions along with demographics to predict if users identified as happy or unhappy. They tested multiple algorithms including naive Bayes, decision trees, random forests, gradient boosting, and support vector machines. Gradient boosting achieved the highest AUC score of 0.68 on test data, outperforming other algorithms. The researchers concluded machine learning can effectively predict happiness from subjective survey responses, with ensemble methods like gradient boosting and random forests performing best.
This document provides an overview of meta-analysis, including what it is, why and when it should be conducted, and how to perform one. It defines meta-analysis as using statistical techniques to combine results from multiple studies on a topic to produce a single estimate. It describes when meta-analysis is appropriate, how to assess heterogeneity between studies, account for publication bias, and estimate summary effects. Statistical tests and graphs are presented to evaluate heterogeneity and bias. The document concludes by listing some programs and techniques used for meta-analysis.
1. The document discusses sampling techniques and sample size calculations for quantitative and qualitative data. It provides formulas to calculate sample size based on population parameters, desired confidence level, and allowable error.
2. Meta-analysis is defined as the statistical analysis of results from multiple studies to integrate findings. Conducting meta-analysis allows for more precise and generalizable treatment estimates compared to single studies.
3. Both advantages and limitations of meta-analysis are discussed. While it provides powerful tools to synthesize evidence, limitations include heterogeneity between studies, publication bias, and potential for poor methodology.
This document discusses network meta-analysis (NMA), which synthesizes both direct and indirect evidence from randomized controlled trials (RCTs) that compare multiple interventions. NMA allows for comparisons between interventions that have not been directly compared in RCTs. It provides treatment relative rankings and effect estimates. Assumptions of NMA include similarity of trials, homogeneity within comparisons, and consistency between direct and indirect evidence. Tests for heterogeneity and inconsistency help evaluate if these assumptions are valid. Software like Addis, WinBUGS, NetMetaXL, and RevMan can be used to conduct NMA.
Decision Support Systems in Clinical EngineeringAsmaa Kamel
This document provides an overview of the Analytic Hierarchy Process (AHP) decision support system and presents a case study on using AHP to make medical equipment scrapping decisions. The key points are:
1) AHP breaks down a complex decision problem into a hierarchy, then uses pairwise comparisons to determine criteria weights and rank alternatives. It was used in this case study to evaluate 9 dialysis machines for potential scrapping.
2) Criteria for the dialysis machine scrapping decision included age, performance, safety record, and costs. Data was incomplete so the study simulated different scenarios to examine the impact.
3) AHP derived local and global priorities to determine each machine's overall priority for scra
a) Experimental
b) Observational
The study in a) manipulates one variable (giving one group a herb vs placebo) and observes the effect on another variable (respiratory tract infections), making it an experimental study.
The study in b) passively observes behaviors or events without manipulation, making it an observational study.
Sample size calculation in medical researchKannan Iyanar
A short description on estimation of sample size in health care research. It describes the basic concepts in sample size estimation and various important formulae used for it.
GA-CFS APPROACH TO INCREASE THE ACCURACY OF ESTIMATES IN ELECTIONS PARTICIPATIONijfcstjournal
This paper proposes a combined GA-CFS approach to increase the accuracy of predicting participation in elections by identifying and removing noisy features. The approach uses genetic algorithm as a search method to select important features for election participation based on correlation-based feature selection, which evaluates feature subsets. When applied to a dataset on election participation factors, the combined method improved the predictive accuracy of classification algorithms compared to using the full feature set. The results demonstrate that the GA-CFS approach is effective at identifying and removing irrelevant and noisy features to enhance predictive performance.
The document discusses key concepts related to sampling and sample size, including:
- The difference between a population and a sample, with a sample being a subset of the population.
- Factors that influence sample representativeness, such as sampling procedure, sample size, and participation rate.
- The importance of defining the target population, sampling frame, sampling method, and determining an appropriate sample size.
- The two main types of sampling techniques - probability sampling and non-probability sampling. Probability sampling allows results to be generalized while non-probability sampling does not.
- Formulas for calculating sample sizes needed for estimating population means, comparing two independent samples, and estimating proportions.
- Examples
Enhancing Performance in Medical Articles Summarization with Multi-Feature Se...IJECEIAES
This document summarizes a study that aimed to enhance the performance of medical article summarization through multi-feature selection. The study utilized 7,346 online medical articles to generate summaries using maximal marginal relevance with an n-Best value of 0.7. Feature selection techniques explored included title, word counts, noun frequency, and word category in medical content. Evaluation of the summarization system found a precision of 91.6%, recall of 92.6%, and F-measure of 92.2% when combining feature selection with word category classification. The study contributed by determining the optimal n-Best value, analyzing feature selection combinations, and providing a classification of sentence types in medical texts.
8 2008-normative data for the letter cancellation task in school childrenElsa von Licy
The document presents normative data for the letter-cancellation task, a psychomotor performance test, in 819 Indian school children aged 9-16 years. Both age and sex influenced performance, with scores increasing with age and higher in females. Regression models were used to develop normative data tables stratified by age and sex, allowing for quantitative evaluation and wider clinical use of the letter-cancellation task in India.
This document discusses meta-analysis and its use and limitations in synthesizing data from multiple studies on a research question. It notes that while meta-analysis provides an objective means of synthesis, it is still susceptible to biases depending on how it is conducted. Key steps in performing a rigorous meta-analysis are outlined, including having a clear research question, documenting literature search methods, extracting study details, assessing heterogeneity and publication bias, and exploring potential moderators of findings. Concerns raised decades ago about the potential for meta-analyses to be "gamed" remain important to consider.
DEA-Based Benchmarking Models In Supply Chain Management: An Application-Orie...ertekg
Download Link > https://ertekprojects.com/gurdal-ertek-publications/blog/data-envelopment-analysis/
Data Envelopment Analysis (DEA) is a mathematical methodology for benchmarking a group of entities in a group. The inputs of a DEA model are the resources that the entity consumes, and the outputs of the outputs are the desired outcomes generated by the entity, by using the inputs. DEA returns important benchmarking metrics, including efficiency score, reference set, and projections. While DEA has been extensively applied in supply chain management (SCM) as well as a diverse range of other fields, it is not clear what has been done in the literature in the past, especially given the domain, the model details, and the country of application. Also, it is not clear what would be an acceptable number of DMUs in comparison to existing research. This paper follows a recipe-based approach, listing the main characteristics of the DEA models for supply chain management. This way, practitioners in the field can build their own models without having to perform detailed literature search. Further guidelines are also provided in the paper for practitioners, regarding the application of DEA in SCM benchmarking.
Kimya Sanayinde Su Tasarrufu İçin Karar Destek Sistemi ertekg
İndirmek çin Bağlantı > https://ertekprojects.com/gurdal-ertek-publications/blog/kimya-sanayinde-su-tasarrufu-icin-karar-destek-sistemi/
Bu bildiride, Türkiye’nin sanayileşmiş bölgelerinden Gebze’de bulunan bir temizlik kimyasalları fabrikası için geliştirdiğimiz ve 7 ay boyunca kullanılarak test edilen bir Karar Destek Sistemi (KDS) tanıtılacak ve yapılan çalışma özetlenecektir. Üretim planlamadan sorumlu fabrika çalışanları bu yeni sistemi uygulamaya aldıktan sonra firma haftada 1 tona yaklaşan su tasarrufu sağlamıştır. Su tasarrufunun yanısıra maliyet, enerji ve işgücü kazançları da gözlemlenmiştir. Temizlik kimyasallarının üretiminin planlamasında faydası ve kullanılabilirliği kanıtlanan bu sistem, ürünlerarası geçişin ürün karakteristiklerine göre yıkama gerektirdiği boya, tekstil, gıda ve diğer kimya sanayilerinde de kullanılabilme potansiyeline sahiptir.
Este documento resume los resultados de la 12a jornada de la 2a categoría cadete de la Copa Coca Cola. Los equipos C.D. Monte Sion "B", Santa Ana Albal C.F. "B" y Colegio Salgui E.D.E. "B" encabezan la tabla de posiciones con 26, 26 y 27 puntos respectivamente.
El documento resume las características del sueño. Explica que el sueño es un estado de suspensión de las actividades mentales conscientes que permite el reposo del organismo. Es una necesidad básica para la supervivencia que permite la recuperación de energía. El sueño está regulado por un reloj biológico e involucra diferentes fases como el sueño de ondas lentas y el sueño REM caracterizado por movimientos oculares rápidos y los sueños.
This guest gave the accommodation a positive review, praising the host Tony for being friendly, helpful, and checking in regularly without being intrusive. The property was beautifully presented, met the family's needs, and was ideally located within walking distance of village shops and transport, while also providing easy access to major shopping centers and London. The kitchen facilities provided better value than other options in the area. The guest highly recommended the accommodation and said they hoped to visit again in the future.
SAP Advanced Delivery Management aims to radically change traditional services models by applying a modular approach like the automotive industry. It redesigns and repackages services, provides pre-assembled solutions, and offers various deployment strategies through new delivery models like Rapid Deployment Solutions. This helps SAP provide more flexible and scalable services to clients, potentially saving them time and costs.
This document summarizes the experience and qualifications of Paul L. Clay, a mechanical technician with over 25 years of experience in aerospace mechanical systems. He has held roles as a maintenance technician for Bell Helicopter and Arista Aviation, where he performed inspections, repairs, and maintenance on UH-1H II aircraft. Prior to that, he worked as a flightline supervisor for the Army and a senior field engineer in Afghanistan, maintaining aerostats and surveillance equipment. Clay is skilled in troubleshooting, quality assurance, and team leadership. He seeks to apply his expertise and strong work ethic to an organization that values dedication and results.
Migración en temas de dignidad humana Martha Karen
Análisis de la migración con contexto de la dignidad humana, una problemática ética y social.
¿Cuáles son los principales problemas que presentan los migrantes?
¿Cuáles son las implicaciones sociales?
A los migrantes, ¿quién los defiende?
¿De quién es el problema?
¿Qué podemos hacer?
This is a summary of a 5-day seminar for experienced developers looking to immerse themselves in learning mobile development for the Apple iOS platform.
Analyzing the solutions of DEA through information visualization and data min...ertekg
Download Link > https://ertekprojects.com/gurdal-ertek-publications/blog/analyzing-the-solutions-of-dea-through-information-visualization-and-data-mining-techniques-smartdea-framework/
Data envelopment analysis (DEA) has proven to be a useful tool for assessing efficiency or productivity of organizations, which is of vital practical importance in managerial decision making. DEA provides a significant amount of information from which analysts and managers derive insights and guidelines to promote their existing performances. Regarding to this fact, effective and methodologic analysis and interpretation of DEA solutions are very critical. The main objective of this study is then to develop a general decision support system (DSS) framework to analyze the solutions of basic DEA models. The paper formally shows how the solutions of DEA models should be structured so that these solutions can be examined and interpreted by analysts through information visualization and data mining techniques effectively. An innovative and convenient DEA solver, SmartDEA, is designed and developed in accordance with the pro-posed analysis framework. The developed software provides a DEA solution which is consistent with the framework and is ready-to-analyze with data mining tools, through a table-based structure. The developed framework is tested and applied in a real world project for benchmarking the vendors of a leading Turkish automotive company. The results show the effectiveness and the efficacy of the proposed framework.
Ramada Hotel, Ahmedabad – A premium luxury hotel with a distinct blend of class and comfort to delight both business and leisure travellers.
Location: Ahmedabad
Company: Wyndham Worldwide
Sourcing Partner: Excella Worldwide
This paper discusses fundamental issues in dairy logistics in a tutorial format. We summarize findings of more than twenty student groups who carried out independent literature surveys and interviewed professionals in the industry. The critical issues in carrying out dairy products logistics, the logistics strategies that are employed by dairy producers in the world and some newly introduced products in the industry and in what ways the introduction of these new products changes the logistics operations are pointed out. The importance of hygiene, cooling, time, humidity, cost, distance, flexibility and meeting the demand is emphasized under the subtitle of critical issues. Except those critical issues, there are some others like short shelf life, quality, emulsion, pasteurization, UHT which depend on the characteristics of the milk and milk products. Logistics strategies in dairy industry are studied by dividing it into two subtitles: the ones that are used in the world and the ones in Turkey. A benchmarking between Turkey and the world is also included at the end. As the variety of milk and milk products increase day by day, the new ingredients of new products also affects the transportation plans. Those impacts are also discussed as a part of our paper. Some descriptive drawings and figures are also embodied. Throughout this paper, only the production, warehousing and transportation of milk, cheese, yoghurt, and similar dairy products are discussed. Ice-cream especially is set out of the scope as it completely differs from actual dairy products as milk, cheese and yoghurt in the means of production and distribution.
Information Management Training & Certification from Data Management Advisors.
info@dmadvisors.co.uk
Courses available include:
Information Management Fundamentals,
Data Governance,
Data Quality Management,
Master & Reference Data,
Data Modelling,
Data Warehouse & Business Intelligence,
Metadata Management,
Data Security & Risk,
Data Integration & Interoperability,
DAMA CDMP Certification,
Business Process Discovery
Scoring and predicting risk preferencesGurdal Ertek
This study presents a methodology to determine risk scores of individuals, for a given financial risk preference survey. To this end, we use a regression based iterative algorithm to determine the weights for survey questions in the scoring process. Next, we generate classification models to classify individuals into risk-averse and risk-seeking categories, using a subset of survey questions. We illustrate the methodology through a sample survey with 656 respondents. We find that the demographic (indirect) questions can be almost as successful as risk-related (direct) questions in predicting risk preference classes of respondents. Using a decision-tree based classification model, we discuss how one can
generate actionable business rules based on the findings.
http://research.sabanciuniv.edu.
Systematic reviews and meta-analyses aim to summarize all available evidence on a topic. A systematic review collects and analyzes results from relevant studies, while a meta-analysis uses statistical methods to combine results into a pooled estimate. Meta-analyses can determine if an effect exists and its direction, but are subject to biases from unpublished or missing studies. They provide more reliable conclusions than individual studies but also have limitations like heterogeneity between studies.
Here are the steps to determine if the classification accuracy of a discriminant function is sufficiently high relative to chance classification:
1. Calculate the chance accuracy rate based on the proportion of cases in each group. For example, if 60% of cases are in Group 1 and 40% in Group 2, the chance accuracy rate would be 60%.
2. Compare the actual classification accuracy of the discriminant function to the chance accuracy rate. If the actual accuracy is only slightly higher than chance, it may not be meaningful.
3. Calculate a chi-square statistic to test if the actual classification accuracy is significantly higher than the chance accuracy rate. The chi-square statistic compares the observed classification counts to expected counts based on chance.
Here is a draft 10-minute PowerPoint presentation outlining the market research needs for a hypothetical company:
Slide 1:
Title: Planning Market Research
Slide 2:
What is market research?
- Systematic gathering and analysis of information about customers, competitors, and the market
- Helps companies make better business decisions and understand customer needs
Slide 3:
Company overview
- [Company name] is a small retailer specializing in outdoor equipment
- Currently operates 3 stores in regional areas
- Seeking to expand into the city market
Slide 4:
Market trends in outdoor equipment retail
- Growing interest in outdoor activities like hiking and camping
- Shift to online shopping for certain
This document discusses risk assessment in social work. It notes that risk assessment aims to improve decisions by making risks explicit and reducing unpredictable events. The document examines different types of risk assessment schedules and considers whether they can accurately predict risk levels. It also discusses the strengths and weaknesses of various risk assessment tools, noting they have particular strengths and weaknesses. Researchers have found risk assessment tools are not always scientific or objective and may rely on value judgments rather than facts.
Alcohol consumption in higher education institutes is not a new problem; but excessive drinking by
underage students is a serious health concern. Excessive drinking among students is associated with a number
of life-threatening consequences that include serious injuries; alcohol poisoning; temporary loss of
consciousness; academic failure; violence, unplanned pregnancy; sexually transmitted diseases, troubles with
authorities, property damage; and vocational and criminal consequences that could jeopardize future job
prospects. This article describes a learning technique to improve the efficiency of academic performance in
the educational institutions for students who consume alcohol. This move can help in identifying the students
who need special advising or counselling to understand the danger of consuming alcohol. This was carried
out in two major phases: feature selection which aims at constructing diverse feature selection algorithms
such as Gain Ratio attribute evaluation, Correlation based Feature Selection, Symmetrical Uncertainty and
Particle Swarm Optimization Algorithms. Afterwards, a subset of features is chosen for the classification
phase. Next, several machine-learning classification methods are chosen to estimate the teenager’s alcohol
addiction possibility. Experimental results demonstrated that the proposed approach could improve the
accuracy performance and achieve promising results with a limited number of features.
Qualitative Research Evaluation Essay
Essay on Types Of Research
Mba
Sampling Methods Essay
Sample Methodology Essay
Research Methodology Report Sample
Essay on Research Methodology
English 101 Research Paper
Example Of Search Strategy
Essay on Medical Research
Research Methods Essay
Importance And Purpose Of Research Essay
Sample Research Proposal on Methodology
Example Of A Research Paper
Career Research Essay
Methodology of Research Essay examples
Essay about Sampling
Research Critique Essay example
Quantitative research focuses on collecting and analyzing numerical data using statistical and computational methods. It emphasizes objective measurements to analyze data collected from surveys, questionnaires, or pre-existing statistical data. There are three main types of quantitative research: descriptive research aims to describe characteristics of a population or phenomenon; correlational research examines relationships between variables; and experimental research tests hypotheses by manipulating variables and controlling for other factors to determine cause-and-effect relationships. Quantitative research generates results that can be generalized to wider populations and aims to classify, count, and statistically explain observed data.
This chapter discusses research methods and procedures. It describes the descriptive method of research, which involves observing and describing phenomena without influencing it. Common data collection methods like interviews and questionnaires are discussed. The document also covers developing a good research instrument, sampling design including different probability sampling techniques, and guidelines for selecting appropriate statistical analysis procedures.
This document discusses reliability and validity, which are two important concepts for evaluating data collection methods in human services. Reliability refers to the consistency and dependability of measurements or assessments, and there are different types of reliability such as inter-rater reliability and test-retest reliability. Validity refers to whether a measurement or assessment accurately measures what it claims to measure. The document emphasizes that reliability and validity are crucial for human services to obtain accurate information through effective data collection methods when evaluating programs and services.
This document summarizes a research study that developed a discriminant analysis model to classify loan applications as accepted or rejected using ranked data. The study used a sample of 350 loan applications, including variables like credit rating, occupation, loan-to-value ratio, and payment-to-income ratio. Rank transformation was applied to minimize outliers and non-normality. Statistical software was used to generate classification functions and classify applications. The resulting model based on ranked data provided accurate classifications without violating assumptions of traditional discriminant analysis.
Retrospective versus | Meta analysis | Systematic literature reviewPubrica
Systematic review for prospective studies is a meticulous and essential process ensuring research findings’ reliability and validity. The key to success lies in adhering to a well-structured methodology that includes defining the research question, developing a comprehensive search strategy, screening studies based on pre-defined criteria, and critically appraising the selected articles.
https://pubrica.com/academy/manuscript-editing/conduct-a-systematic-review-for-prospective-studies/
Risk Assessment Model and its Integration into an Established Test Processijtsrd
In industry, testing has to be performed under severe pressure due to limited resources. Risk based testing which uses risks to guide the test process is applied to allocate resources and to reduce product risks. Risk assessment, i.e., risk identi cation, analysis and evaluation, determines the signi cance of the risk values assigned to tests and therefore the quality of the overall risk based test process. In this paper we provide a risk assessment model and its integration into an established test process. This framework is derived on the basis of best practices extracted from published risk based testing approaches and applied to an industrial test process. Ashwani Kumar | Prince Sood "Risk Assessment Model and its Integration into an Established Test Process" Published in International Journal of Trend in Scientific Research and Development (ijtsrd), ISSN: 2456-6470, Volume-3 | Issue-5 , August 2019, URL: https://www.ijtsrd.com/papers/ijtsrd26757.pdfPaper URL: https://www.ijtsrd.com/engineering/computer-engineering/26757/risk-assessment-model-and-its-integration-into-an-established-test-process/ashwani-kumar
This study examined the formative impact of general practice appraisals through a questionnaire given to GPs who had undergone appraisal at a primary care trust in Wessex, UK. The study found that appraisals increased GPs' confidence, improved patient care, and contributed to delayed retirement. Appraisals helped identify clear and achievable learning goals in areas like clinical skills, practice management, and personal development. Regular appraiser training and experience with multiple appraisals helped increase GPs' comfort with the process. The study provides insight into the educational benefits of appraisals when separated from revalidation requirements.
Pre Assessment Quantitative And Qualitative Data EssayTiffany Sandoval
Here are the key factors to consider when deciding between quantitative and qualitative data:
- Sample size - Qualitative data uses smaller samples to gain an in-depth understanding of each case, while quantitative data relies on larger samples for generalizability.
- Data type - Quantitative data is numerical and can be easily grouped, compared, and analyzed statistically. Qualitative data includes text, images, and narratives that require different analysis methods.
- Research questions - Qualitative research is best for exploring a problem or generating hypotheses, while quantitative research tests hypotheses and measures outcomes.
- Resources - Qualitative data collection and analysis takes more time and resources per subject compared to quantitative methods with standardized instruments.
- Validity - It can
The Developmental Coordination Disorder QuestionnaireMandy Cross
Here are the key points about isolation/causation in psychological experiments:
- Isolation means that only the independent variable (IV) is manipulated, while all other factors are kept constant. This allows researchers to conclude that any changes in the dependent variable (DV) are caused by changes in the IV.
- It is difficult to achieve perfect isolation in psychology experiments since humans are complex and many variables can influence behavior and mental processes. Even subtle cues or expectations may influence participants.
- Researchers try to maximize isolation through control groups, random assignment, counterbalancing, blinding procedures, standardized instructions/procedures, and controlling the experimental environment/context. However, complete isolation is impossible.
- Correlation between IV
http://home.ubalt.edu/ntsbarsh/business-stat/opre/partIX.htm
Tools for Decision Analysis: Analysis of Risky Decisions
If you will begin with certainties, you shall end in doubts, but if you will content to begin with doubts, you shall end in almost certainties. -- Francis Bacon
Making decisions is certainly the most important task of a manager and it is often a very difficult one. This site offers a decision making procedure for solving complex problems step by step.It presents the decision-analysis process for both public and private decision-making, using different decision criteria, different types of information, and information of varying quality. It describes the elements in the analysis of decision alternatives and choices, as well as the goals and objectives that guide decision-making. The key issues related to a decision-maker's preferences regarding alternatives, criteria for choice, and choice modes, together with the risk assessment tools are also presented.
Professor Hossein Arsham
MENU
1. Introduction & Summary
2. Probabilistic Modeling: From Data to a Decisive Knowledge
3. Decision Analysis: Making Justifiable, Defensible Decisions
4. Elements of Decision Analysis Models
5. Decision Making Under Pure Uncertainty: Materials are presented in the context of Financial Portfolio Selections.
6. Limitations of Decision Making under Pure Uncertainty
7. Coping with Uncertainties
8. Decision Making Under Risk: Presentation is in the context of Financial Portfolio Selections under risk.
9. Making a Better Decision by Buying Reliable Information: Applications are drawn from Marketing a New Product.
10. Decision Tree and Influence Diagram
11. Why Managers Seek the Advice From Consulting Firms
12. Revising Your Expectation and its Risk
13. Determination of the Decision-Maker's Utility
14. Utility Function Representations with Applications
15. A Classification of Decision Maker's Relative Attitudes Toward Risk and Its Impact
16. The Discovery and Management of Losses
17. Risk: The Four Letters Word
18. Decision's Factors-Prioritization & Stability Analysis
19. Optimal Decision Making Process
20. JavaScript E-labs Learning Objects
21. A Critical Panoramic View of Classical Decision Analysis
22. Exercise Your Knowledge to Enhance What You Have Learned (PDF)
23. Appendex: A Collection of Keywords and Phrases
Companion Sites:
· Business Statistics
· Success Science
· Leadership Decision Making
· Linear Programming (LP) and Goal-Seeking Strategy
· Linear Optimization Software to Download
· Artificial-variable Free LP
Solution
Algorithms
· Integer Optimization and the Network Models
· Tools for LP Modeling Validation
· The Classical Simplex Method
· Zero-Sum Games with Applications
· Computer-assisted Learning Concepts and Techniques
· Linear Algebra and LP Connections
· From Linear to Nonlinear Optimization with Business Applications
· Construction of the Sensitivity Region for LP Models
· Zero Sagas in Four Dimensions
· Systems Simulation
· B.
This document discusses various forecasting methods and principles. It covers:
- Qualitative methods like expert surveys, intentions surveys, and simulated interaction.
- Quantitative methods like extrapolation, rule-based forecasting, and simple regression which use numerical data.
- Checklists can improve forecasting by ensuring the latest evidence is included. The document provides a checklist for developing knowledge models.
- Forecasting principles like being conservative and choosing simple explanations are discussed.
- Estimating forecast uncertainty is important. Methods discussed include using empirical prediction intervals and decomposing errors by source.
IJRET : International Journal of Research in Engineering and Technology is an international peer reviewed, online journal published by eSAT Publishing House for the enhancement of research in various disciplines of Engineering and Technology. The aim and scope of the journal is to provide an academic medium and an important reference for the advancement and dissemination of research results that support high-level learning, teaching and research in the fields of Engineering and Technology. We bring together Scientists, Academician, Field Engineers, Scholars and Students of related fields of Engineering and Technology.
Reliability Analysis Of Refined Model With 25 Items And 5...Jessica Myers
This study examines the psychological factors that motivate different expressions of prejudice in modern society. The researchers analyzed both covert and overt manifestations of bias using a scale to measure the motivation to express prejudice. Through four survey studies, the researchers aimed to distinguish between deliberate and subconscious prejudice by assessing the influence of social norms as well as internal and external forces. The results indicated that prejudice is not solely dictated by social norms, but also other psychological factors, helping to explain prejudice at both the conscious and unconscious levels.
Similar to Scoring and Predicting Risk Preferences (20)
Rule-based expert systems for supporting university studentsertekg
Download Link > https://ertekprojects.com/gurdal-ertek-publications/blog/rule-based-expert-systems-for-supporting-university-students/
There are more than 15 million college students in the US alone. Academic advising for courses and scholarships is typically performed by human advisors, bringing an immense managerial workload to faculty members, as well as other staff at universities. This paper reports and discusses the development of two educational expert systems at a private international university. The first expert system is a course advising system which recommends courses to undergraduate students. The second system suggests scholarships to undergraduate students based on their eligibility. While there have been reported systems for course advising, the literature does not seem to contain any references to expert systems for scholarship recommendation and eligibility checking. Therefore the scholarship recommender that we developed is first of its kind. Both systems have been implemented and tested using Oracle Policy Automation (OPA) software.
Optimizing the electric charge station network of EŞARJertekg
Download Link > https://ertekprojects.com/gurdal-ertek-publications/blog/optimizing-the-electric-charge-station-network-of-esarj/
In this study, we adopt the classic capacitated p-median location model for the solution of a network design problem, in the domain of electric charge station network design, for a leading company in Turkey. Our model encompasses the location preferences of the company managers as preference scores incorporated into the objective function. Our model also incorporates the capacity concerns of the managers through constraints on maximum number of districts and maximum population that can be served from a location. The model optimally selects the new station locations and the visualization of model results provides additional insights.
Competitiveness of Top 100 U.S. Universities: A Benchmark Study Using Data En...ertekg
Download Link > https://ertekprojects.com/gurdal-ertek-publications/blog/benchmark-study-using-data-envelopment-analysis/
This study presents a comprehensive benchmarking study of the top 100 U.S. Universities. The methodologies used to come up with insights into the domain are Data Envelopment Analysis (DEA) and information visualization. Various approaches to evaluating academic institutions have appeared in the literature, including a DEA literature dealing with the ranking of universities. Our study contributes to this literature by the extensive incorporation of information visualization and subsequently the discovery of new insights.
Industrial Benchmarking through Information Visualization and Data Envelopmen...ertekg
Download Link > https://ertekprojects.com/gurdal-ertek-publications/blog/industrial-benchmarking-through-information-visualization-and-data-envelopment-analysis-a-new-framework/
We present a benchmarking study on the companies in the Turkish food industry based on their financial data. Our aim is to develop a comprehensive benchmarking framework using Data Envelopment Analysis (DEA) and information visualization. Besides DEA, a traditional tool for financial benchmarking based on financial ratios is also incorporated. The consistency/inconsistency between the two methodologies is investigated using information visualization tools. In addition, k-means clustering, a fundamental method from machine learning, is applied to understand the relationship between k-means clustering and DEA.
Download Link > https://ertekprojects.com/gurdal-ertek-publications/blog/modelling-the-supply-chain-perception-gaps/
This study applies the research of perception gap analysis to supply chain integration and develops a generic model, the 3-Level Gaps Model, with the goal of contributing to harmonization and integration in the supply chain. The model suggests that significant perception gaps may exist among supply chain members with regards to the importance of different performance criteria. The concept of the model is conceived through an empirical and inductive approach, combining the research discipline of supply chain relationship and perception gap analysis. First hand data has been collected through a survey across a key buyer in the motor insurance industry and its eight suppliers. Rigorous statistical analysis testified the research hypotheses, which in turn verified the validity and relevance of the developed 3-Level Gaps Model. The research reveals the significant existence of supply chain perception gaps at all three levels as defined, which could be the root-causes to underperformed supply chain.
Risk Factors and Identifiers for Alzheimer’s Disease: A Data Mining Analysisertekg
Download Link > https://ertekprojects.com/gurdal-ertek-publications/blog/risk-factors-and-identifiers-for-alzheimers-disease-a-data-mining-analysis/
The topic of this paper is the Alzheimer’s Disease (AD), with the goal being the analysis of risk factors and identifying tests that can help diagnose AD. While there exists multiple studies that analyze the factors that can help diagnose or predict AD, this is the first study that considers only non-image data, while using a multitude of techniques from machine learning and data mining. The applied methods include classification tree analysis, cluster analysis, data visualization, and classification analysis. All the analysis, except classification analysis, resulted in insights that eventually lead to the construction of a risk table for AD. The study contributes to the literature not only with new insights, but also by demonstrating a framework for analysis of such data. The insights obtained in this study can be used by individuals and health professionals to assess possible risks, and take preventive measures.
Download Link > https://ertekprojects.com/gurdal-ertek-publications/blog/text-mining-with-rapidminer/
The goal of this chapter is to introduce the text mining capabilities of RAPIDMINER through a use case. The use case involves mining reviews for hotels at TripAdvisor.com, a popular web portal. We will be demonstrating basic text mining in RAPIDMINER using the text mining extension. We will present two different RAPIDMINER processes, namely Process01 andProcess02, which respectively describe how text mining can be combined with association mining and cluster modeling. While it is possible to construct each of these processes from scratch by inserting the appropriate operators into the process view, we will instead import these two processes readily from existing model files. Throughout the chapter, we will at times deliberately instruct the reader to take erroneous steps that result in undesired outcomes. We believe that this is a very realistic way of learning to use RAPIDMINER, since in practice, the modeling process frequently involves such steps that are later corrected.
Competitive Pattern-Based Strategies under Complexity: The Case of Turkish Ma...ertekg
Download Link > https://ertekprojects.com/gurdal-ertek-publications/blog/competitive-pattern-based-strategies-under-complexity-the-case-of-turkish-managers/
This paper aims to augment current Enterprise Architecture (EA) frameworks to become pattern-based. The main motivation behind pattern-based EA is the support for strategic decisions based on the patterns prioritized in a country or industry. Thus, to validate the need for pattern-based EA, it is essential to show how different patterns gain priority under different contexts, such as industries. To this end, this chapter also reveals the value of alternative managerial strategies across different industries and business functions in a specific market, namely Turkey. Value perceptions for alternative managerial strategies were collected via survey, and the values for strategies were analyzed through the rigorous application of statistical techniques. Then, evidence was searched and obtained from business literature that support or refute the statistically-supported hypothesis. The results obtained through statistical analysis are typically confirmed with reports of real world cases in the business literature. Results suggest that Turkish firms differ significantly in the way they value different managerial strategies. There also exist differences based on industries and business functions. Our study provides guidelines to managers in Turkey, an emerging country, on which strategies are valued most in their industries. This way, managers can have a better understanding of their competitors and business environment, and can develop the appropriate pattern-based EA to cope with complexity and succeed in the market.
Supplier and Buyer Driven Channels in a Two-Stage Supply Chainertekg
Download Link > https://ertekprojects.com/gurdal-ertek-publications/blog/supplier-and-buyer-driven-channels-in-a-two-stage-supply-chain/
We explore the impact of power structure on price, sensitivity of market price, and profits in a two-stage supply chain with single product, supplier and buyer, and a price sensitive market. We develop and analyze the case where the supplier has dominant bargaining power and the case where the buyer has dominant bargaining power. We consider a pricing scheme for the buyer that involves both a multiplier and a markup. We show that it is optimal for the buyer to set the markup to zero and use only a multiplier. We also show that the market price and its sensitivity are higher when operational costs (namely distribution and inventory) exist. We observe that the sensitivity of the market price increases non-linearly as the wholesale price increases, and derive a lower bound for it. Through experimental analysis, we show that marginal impact of increasing shipment cost and carrying charge (interest rate) on prices and profits are decreasing in both cases. Finally, we show that there exist problem instances where the buyer may prefer supplier-driven case to markup-only buyer-driven and similarly problem instances where the supplier may prefer markup-only buyer-driven case to supplier-driven.
Simulation Modeling For Quality And Productivity In Steel Cord Manufacturingertekg
Download Link > https://ertekprojects.com/gurdal-ertek-publications/blog/simulation-modeling-for-quality-and-productivity-in-steel-cord-manufacturing/
We describe the application of simulation modeling to estimate and improve quality and productivity performance of a steel cord manufacturing system. We describe the typical steel cord manufacturing plant, emphasize its distinguishing characteristics, identify various production settings and discuss applicability of simulation as a management decision support tool. Besides presenting the general structure of the developed simulation model, we focus on wire fractures, which can be an important source of system disruption.
Visual and analytical mining of transactions data for production planning f...ertekg
Download Link > https://ertekprojects.com/gurdal-ertek-publications/blog/visual-and-analytical-mining-of-sales-transaction-data-for-production-planning-and-marketing/
Recent developments in information technology paved the way for the collection of large amounts of data pertaining to various aspects of an enterprise. The greatest challenge faced in processing these massive amounts of raw data gathered turns out to be the effective management of data with the ultimate purpose of deriving necessary and meaningful information out of it. The following paper presents an attempt to illustrate the combination of visual and analytical data mining techniques for planning of marketing and production activities. The primary phases of the proposed framework consist of filtering, clustering and comparison steps
implemented using interactive pie charts, K-Means algorithm and parallel coordinate plots respectively. A prototype decision support system is developed and a sample analysis session is conducted to demonstrate the applicability of the framework.
Download Link > https://ertekprojects.com/gurdal-ertek-publications/blog/a-tutorial-on-crossdocking/
In crossdocking, the inbound materials coming in trucks to the crossdock facility are directed to outbound doors and are directly loaded into trucks that will perform shipment, or are staged for a very brief time period before loading. Crossdocking has a great potential to bring savings in logistics: For example, most of the logistics success of Wal-Mart, the world’s leading retailer, is attributed to crossdocking.In this paper,the types of crossdocking are identified, the situations and industries where crossdocking is applicable are explained, prerequisites, advantages and drawbacks are listed, and implementation issues are discussed. Finally a case study that describes the crossdocking applications of a 3rd party logistics firm is presented.
Application Of Local Search Methods For Solving A Quadratic Assignment Probl...ertekg
Download Link > https://ertekprojects.com/gurdal-ertek-publications/blog/application-of-local-search-methods-for-solving-a-quadratic-assignment-problem-a-case-study/
This paper discusses the design and application of local search methods to a real-life application at a steel cord manufacturing plant. The case study involves a layout problem that can be represented as a Quadratic Assignment Problem (QAP). Due to the nature of the manufacturing process, certain machinery need to be allocated in close proximity to each other. This issue is incorporated into the objective function through assigning high penalty costs to the unfavorable allocations. QAP belongs to one of the most difficult class of combinatorial optimization problems, and is not solvable to optimality as the number of facilities increases. We implement the well-known local search methods, 2-opt, 3-opt and tabu search. We compare the solution performances of the methods to the results obtained from the NEOS server, which provides free access to many optimization solvers on the internet.
Financial Benchmarking Of Transportation Companies In The New York Stock Exc...ertekg
Download Link > https://ertekprojects.com/gurdal-ertek-publications/blog/financial-benchmarking-of-transportation-companies-in-the-new-york-stock-exchange-nyse-through-data-envelopment-analysis-dea-and-visualization/
In this paper, we present a benchmarking study of industrial transportation companies traded in the New York Stock Exchange (NYSE). There are two distinguishing aspects of our study: First, instead of using operational data for the input and the output items of the developed Data Envelopment Analysis (DEA) model, we use financial data of the companies that are readily available on the Internet. Secondly, we visualize the efficiency scores of the companies in relation to the subsectors and the number of employees. These visualizations enable us to discover interesting insights about the companies within each subsector, and about subsectors in comparison to each other. The visualization approach that we employ can be used in any DEA study that contains subgroups within a group. Thus, our paper also contains a methodological contribution.
Optimizing Waste Collection In An Organized Industrial Region: A Case Studyertekg
This document summarizes a case study that optimizes industrial waste collection from 17 factories located in an organized industrial region in Turkey. The authors developed a mixed integer programming model to determine the optimal waste container locations and transportation routes to minimize total costs. They applied the model to real data from an industrial zone. The optimal solution selected 3 out of 5 candidate locations and had a minimum monthly cost of 70,338 Turkish Lira. The authors also created a visualization of the optimal supply chain network to provide additional insights into the solution.
Demonstrating Warehousing Concepts Through Interactive Animationsertekg
Download Link > https://ertekprojects.com/gurdal-ertek-publications/blog/demonstrating-warehousing-concepts-through-interactive-animations/
In this paper, we report development of interactive computer animations to demonstrate warehousing concepts, providing a virtual environment for learning. Almost every company, regardless of its industry, holds inventory of goods in its warehouse(s) to respond to customer demand promptly, to coordinate supply and demand, to realize economies of scale in manufacturing or processing, to add value to its products and to reduce response time. Design, analysis, and improvement of warehouse operations can yield significant savings for a company. Warehousing science can be considered as an important field within the industrial engineering discipline. However, there is very little educational material (including web based media), and only a handful of books available in this field. We believe that the animations that we developed will significantly contribute to the understanding of warehousing concepts, and enable tomorrow’s practitioners to grasp the fundamentals of managing warehouses.
A Framework for Visualizing Association Mining Resultsertekg
Download Link > https://ertekprojects.com/gurdal-ertek-publications/blog/a-framework-for-visualizing-association-mining-results/
Association mining is one of the most used data mining techniques due to interpretable and actionable results. In this study we pro-pose a framework to visualize the association mining results, speci¯cally frequent itemsets and association rules, as graphs. We demonstrate the applicability and usefulness of our approach through a Market Basket Analysis (MBA) case study where we visually explore the data mining results for a supermarket data set. In this case study we derive several
interesting insights regarding the relationships among the items and sug-gest how they can be used as basis for decision making in retailing.
Application of the Cutting Stock Problem to a Construction Company: A Case Studyertekg
Download Link > https://ertekprojects.com/gurdal-ertek-publications/blog/application-of-the-cutting-stock-problem-to-a-construction-company-a-case-study/
This paper presents an application of the well-known cutting stock problem to a construction firm. The goal of the 1Dimensional (1D) cutting stock problem is to cut the bars of desired lengths in required quantities from longer bars of given length. The company for which we carried out this study encounters 1D cutting stock problem in cutting steel bars (reinforcement bars) for its construction projects. We have developed several solution approaches to solving the company’s problem: Building and solving an integer programming (IP) model in a modeling environment, developing our own software that uses a mixed integer programming (MIP) software library, and testing some of the commercial software packages available on the internet. In this paper, we summarize our experiences with all the three approaches. We also present a benchmark of existing commercial software packages, and some critical insights. Finally, we suggest a visual approach for increasing performance in solving the cutting stock problem and demonstrate the applicability of this approach using the company’s data on two construction projects.
Benchmarking The Turkish Apparel Retail Industry Through Data Envelopment Ana...ertekg
Download Link > https://ertekprojects.com/gurdal-ertek-publications/blog/benchmarking-the-turkish-apparel-retail-industry-through-data-envelopment-analysis-dea-and-data-visualization/
This paper presents a benchmarking study of the Turkish apparel retailing industry. We have applied the Data Envelopment Analysis (DEA) methodology to determine the efficiencies of the companies in the industry. In the DEA model the number of stores, number of corners, total sales area and number of employees were included as inputs and annual sales revenue was included as the output. The efficiency scores obtained through DEA were visualized for gaining insights about the industry and revealing guidelines that can aid in strategic decision making.
NIMA2024 | De toegevoegde waarde van DEI en ESG in campagnes | Nathalie Lam |...BBPMedia1
Nathalie zal delen hoe DEI en ESG een fundamentele rol kunnen spelen in je merkstrategie en je de juiste aansluiting kan creëren met je doelgroep. Door middel van voorbeelden en simpele handvatten toont ze hoe dit in jouw organisatie toegepast kan worden.
❼❷⓿❺❻❷❽❷❼❽ Dpboss Matka Result Satta Matka Guessing Satta Fix jodi Kalyan Final ank Satta Matka Dpbos Final ank Satta Matta Matka 143 Kalyan Matka Guessing Final Matka Final ank Today Matka 420 Satta Batta Satta 143 Kalyan Chart Main Bazar Chart vip Matka Guessing Dpboss 143 Guessing Kalyan night
Navigating the world of forex trading can be challenging, especially for beginners. To help you make an informed decision, we have comprehensively compared the best forex brokers in India for 2024. This article, reviewed by Top Forex Brokers Review, will cover featured award winners, the best forex brokers, featured offers, the best copy trading platforms, the best forex brokers for beginners, the best MetaTrader brokers, and recently updated reviews. We will focus on FP Markets, Black Bull, EightCap, IC Markets, and Octa.
Starting a business is like embarking on an unpredictable adventure. It’s a journey filled with highs and lows, victories and defeats. But what if I told you that those setbacks and failures could be the very stepping stones that lead you to fortune? Let’s explore how resilience, adaptability, and strategic thinking can transform adversity into opportunity.
The APCO Geopolitical Radar - Q3 2024 The Global Operating Environment for Bu...APCO
The Radar reflects input from APCO’s teams located around the world. It distils a host of interconnected events and trends into insights to inform operational and strategic decisions. Issues covered in this edition include:
How are Lilac French Bulldogs Beauty Charming the World and Capturing Hearts....Lacey Max
“After being the most listed dog breed in the United States for 31
years in a row, the Labrador Retriever has dropped to second place
in the American Kennel Club's annual survey of the country's most
popular canines. The French Bulldog is the new top dog in the
United States as of 2022. The stylish puppy has ascended the
rankings in rapid time despite having health concerns and limited
color choices.”
Discover innovative uses of Revit in urban planning and design, enhancing city landscapes with advanced architectural solutions. Understand how architectural firms are using Revit to transform how processes and outcomes within urban planning and design fields look. They are supplementing work and putting in value through speed and imagination that the architects and planners are placing into composing progressive urban areas that are not only colorful but also pragmatic.
Unveiling the Dynamic Personalities, Key Dates, and Horoscope Insights: Gemin...my Pandit
Explore the fascinating world of the Gemini Zodiac Sign. Discover the unique personality traits, key dates, and horoscope insights of Gemini individuals. Learn how their sociable, communicative nature and boundless curiosity make them the dynamic explorers of the zodiac. Dive into the duality of the Gemini sign and understand their intellectual and adventurous spirit.
Best practices for project execution and deliveryCLIVE MINCHIN
A select set of project management best practices to keep your project on-track, on-cost and aligned to scope. Many firms have don't have the necessary skills, diligence, methods and oversight of their projects; this leads to slippage, higher costs and longer timeframes. Often firms have a history of projects that simply failed to move the needle. These best practices will help your firm avoid these pitfalls but they require fortitude to apply.
Part 2 Deep Dive: Navigating the 2024 Slowdownjeffkluth1
Introduction
The global retail industry has weathered numerous storms, with the financial crisis of 2008 serving as a poignant reminder of the sector's resilience and adaptability. However, as we navigate the complex landscape of 2024, retailers face a unique set of challenges that demand innovative strategies and a fundamental shift in mindset. This white paper contrasts the impact of the 2008 recession on the retail sector with the current headwinds retailers are grappling with, while offering a comprehensive roadmap for success in this new paradigm.
Best Competitive Marble Pricing in Dubai - ☎ 9928909666Stone Art Hub
Stone Art Hub offers the best competitive Marble Pricing in Dubai, ensuring affordability without compromising quality. With a wide range of exquisite marble options to choose from, you can enhance your spaces with elegance and sophistication. For inquiries or orders, contact us at ☎ 9928909666. Experience luxury at unbeatable prices.
Presentation by Herman Kienhuis (Curiosity VC) on Investing in AI for ABS Alu...Herman Kienhuis
Presentation by Herman Kienhuis (Curiosity VC) on developments in AI, the venture capital investment landscape and Curiosity VC's approach to investing, at the alumni event of Amsterdam Business School (University of Amsterdam) on June 13, 2024 in Amsterdam.
[To download this presentation, visit:
https://www.oeconsulting.com.sg/training-presentations]
This PowerPoint compilation offers a comprehensive overview of 20 leading innovation management frameworks and methodologies, selected for their broad applicability across various industries and organizational contexts. These frameworks are valuable resources for a wide range of users, including business professionals, educators, and consultants.
Each framework is presented with visually engaging diagrams and templates, ensuring the content is both informative and appealing. While this compilation is thorough, please note that the slides are intended as supplementary resources and may not be sufficient for standalone instructional purposes.
This compilation is ideal for anyone looking to enhance their understanding of innovation management and drive meaningful change within their organization. Whether you aim to improve product development processes, enhance customer experiences, or drive digital transformation, these frameworks offer valuable insights and tools to help you achieve your goals.
INCLUDED FRAMEWORKS/MODELS:
1. Stanford’s Design Thinking
2. IDEO’s Human-Centered Design
3. Strategyzer’s Business Model Innovation
4. Lean Startup Methodology
5. Agile Innovation Framework
6. Doblin’s Ten Types of Innovation
7. McKinsey’s Three Horizons of Growth
8. Customer Journey Map
9. Christensen’s Disruptive Innovation Theory
10. Blue Ocean Strategy
11. Strategyn’s Jobs-To-Be-Done (JTBD) Framework with Job Map
12. Design Sprint Framework
13. The Double Diamond
14. Lean Six Sigma DMAIC
15. TRIZ Problem-Solving Framework
16. Edward de Bono’s Six Thinking Hats
17. Stage-Gate Model
18. Toyota’s Six Steps of Kaizen
19. Microsoft’s Digital Transformation Framework
20. Design for Six Sigma (DFSS)
To download this presentation, visit:
https://www.oeconsulting.com.sg/training-presentations
Call8328958814 satta matka Kalyan result satta guessing➑➌➋➑➒➎➑➑➊➍
Satta Matka Kalyan Main Mumbai Fastest Results
Satta Matka ❋ Sattamatka ❋ New Mumbai Ratan Satta Matka ❋ Fast Matka ❋ Milan Market ❋ Kalyan Matka Results ❋ Satta Game ❋ Matka Game ❋ Satta Matka ❋ Kalyan Satta Matka ❋ Mumbai Main ❋ Online Matka Results ❋ Satta Matka Tips ❋ Milan Chart ❋ Satta Matka Boss❋ New Star Day ❋ Satta King ❋ Live Satta Matka Results ❋ Satta Matka Company ❋ Indian Matka ❋ Satta Matka 143❋ Kalyan Night Matka..
Storytelling is an incredibly valuable tool to share data and information. To get the most impact from stories there are a number of key ingredients. These are based on science and human nature. Using these elements in a story you can deliver information impactfully, ensure action and drive change.
1. Ertek, G., Kaya, M., Kefeli, C., Onur, Ö., Uzer, K. (2012) “Scoring and predicting risk preferences”
in Behavior Computing: Modeling, Analysis, Mining and Decision. Eds: Longbing Cao, Philip S.
Yu. Springer.
Note: This is the final draft version of this paper. Please cite this paper (or this final draft) as
above. You can download this final draft from http://research.sabanciuniv.edu.
Scoring and Predicting Risk Preferences
Gürdal Ertek1, Murat Kaya1, Cemre Kefeli1, Özge Onur1, and Kerem Uzer2
1Sabancı University, Faculty of Engineering and Natural Sciences,
Orhanli, Tuzla, 34956, Istanbul, Turkey.
2Sabancı University, School of Management,
Orhanli, Tuzla, 34956, Istanbul, Turkey.abanci University
2. Scoring and Predicting Risk Preferences
¨
G¨ rdal Ertek1 , Murat Kaya1 , Cemre Kefeli1 , Ozge Onur1 , and Kerem Uzer2
u
1 Sabancı University, Faculty of Engineering and Natural Sciences,
Orhanli, Tuzla, 34956, Istanbul, Turkey. ertekg@sabanciuniv.edu
2 Sabancı University, School of Management,
Orhanli, Tuzla, 34956, Istanbul, Turkey.
Abstract. This study presents a methodology to determine risk scores of individ-
uals, for a given financial risk preference survey. To this end, we use a regression-
based iterative algorithm to determine the weights for survey questions in the
scoring process. Next, we generate classification models to classify individuals
into risk-averse and risk-seeking categories, using a subset of survey questions.
We illustrate the methodology through a sample survey with 656 respondents.
We find that the demographic (indirect) questions can be almost as successful
as risk-related (direct) questions in predicting risk preference classes of respon-
dents. Using a decision-tree based classification model, we discuss how one can
generate actionable business rules based on the findings.
1 Introduction
Financial institutions such as banks, investment funds and insurance companies have
been using surveys to elicit risk preferences of their customers3 . They analyze the col-
lected data to categorize their customer pool and to offer customized financial services.
For instance, the institution can emphasize safety and predictability of investments for
customers who are categorized as risk-averse, whereas it can emphasize potential gains
to customers who are categorized as risk-seeking. Determining customers’ risk prefer-
ences is a prerequisite for developing healthy financial plans. For this purpose, leading
financial institutions often integrate the survey results into their Customer Relations
Management (CRM) systems.
While the use of financial risk preference surveys is popular in practice, the survey
questions are rarely determined using scientific reasoning. In addition, when risk scores
are calculated for survey respondents, questions are often given identical weights. Eval-
uating 14 risk surveys in France, [26] determines that “Only a minority of the ques-
tionnaires in our sample rely on scoring techniques that attribute points for each an-
swer. Furthermore, the questionnaires under review that do rely on scoring techniques
generally fail to use sufficiently sophisticated econometric methods when setting their
scoring rules. . . . Consequently, the classification of investors is still based on subjective
judgments, rather than on data and quantified findings. ”. [26] also finds weak correla-
tion between the risk scores of different surveys. That is, different financial institutions
might be providing different financial advice to the same individual.
3 See, for example http://www.paragonwealth.com/risk_tolerance.php
3. These observations indicate the need for scientific quantitative approaches for cal-
culating risk scores using survey data. In this research, we offer a methodology to de-
termine weights for the questions of a given risk survey, applying a regression-based
iterative algorithm. Using these weights, we calculate a risk score for each survey re-
spondent, which can be used for classification purposes.
Risk preference surveys include questions on two sets of respondent attributes: (1)
Direct attributes, such as a choice between different hypothetical investment options,
that are directly related to risk preferences; (2) Indirect attributes, such as demographic
information, that are not directly related to risk preferences. The questions on direct
attributes presumably provide more valuable information on respondents’ risk prefer-
ences. However, since these questions aim at sensitive information and involve hypo-
thetical scenarios, it may be difficult to elicit truthful information from respondents.
This is particularly the case when the questions are numerous and framed too broadly. In
contrast, indirect data is often readily available or can be collected easily. Our research
offers a method to classify individuals based on their answers to indirect questions. One
can use this classification to ask more tailored direct questions, if necessary.
The definition of risk, and risk preferences is context-dependent. Risk can be de-
fined in many ways, including expected loss, expected disutility, probability of an ad-
verse outcome, combination of events/consequences and associated uncertainties, un-
certainty of outcome of actions and events, or a situation or event where something of a
human value is at stake and the outcome is uncertain [3]. In this study, we focus on risk
preferences of individuals in the context of financial investments.
The contributions of this work can be summarized as follows:
– We develop a novel behavior computing [5] methodology for scoring and prediction
of risk preferences. The two main components of the methodology are:
• Risk scoring algorithm: Given a risk survey, this iterative algorithm determines
which questions (attributes) to use and the weights for each direct question,
and calculates risk scores for all respondents based on these weights.
• Classification model: This model classifies respondents based on a set of (di-
rect, indirect or both sets) attributes.
– We illustrate the use of methodology on a sample survey with 23 direct and 9 indi-
rect questions applied to 656 respondents.
– We derive actionable business rules using a decision-tree-based classification model.
These results can be conveniently integrated into the decision support systems of
financial institutions.
In this section of the chapter, the study was introduced and motivated. In Section
2, an overview of the basic concepts in related studies is presented through a concise
literature review. In Section 3, the proposed five-step methodology is presented and the
methodology steps are illustrated through a sample survey study. In Section 4, the study
is concluded with a thorough discussion of future research directions.
2 Literature
A number of researchers have evaluated the use of risk surveys by financial institutions
to score the risk preferences of individuals and to classify them into categories. [26]’s
4. evaluation of 14 risk surveys (questionnaires) used in France finds that only one third of
the surveys try to quantify risk aversion, and those who quantify risk aversion fail to use
sufficiently sophisticated econometric methods. Less than half of the institutions have
developed scoring rules for the purpose of classification, and for most cases, classifica-
tion is conducted based on subjective judgment rather than proper analytical methods.
In addition, computed classes are only weakly correlated between different surveys.
Our study addresses some of these issues.
Researchers have long discussed whether indirect attributes can be used effectively
in classifying individuals into risk preference categories. See, for example, [13]. In par-
ticular, being male, being single, being a professional employee, younger age, higher
income, higher education, higher knowledge in financial matters and having positive
economic expectations are shown to be positively related to higher risk tolerance. How-
ever, blindly adopting such heuristics in classifying customers has its drawbacks. There
is no consensus among researchers about the validity of these heuristics, which indicate
the need for additional research (see [14] and the references therein). For example, us-
ing a survey with 20 questions, [13] finds older individuals to be more risk tolerant than
younger ones, and married individuals to be more risk tolerant than single ones, which
contradicts the common expectations. In a similar study, [14] uses the 1992 Survey of
Consumer Finances (SCF) dataset, which contains the answers of 2626 respondents.
Seven of the eight indirect attributes are found to be effective in classifying respon-
dents into three risk tolerance categories. The level of attained education and gender
are found to be the most effective attributes; whereas the effect of age attribute is found
to be insignificant. Other related studies include [31] and [16].
A different but related problem is the credit scoring problem. Credit scoring can be
defined as the application of quantitative methods to “predict the probability that a loan
applicant or existing borrower will default or become delinquent” [22]. Credit scoring
models are popular in finance, due to increasing competition in the industry and the
high cost of bad debt. [11] presents a review of credit scoring models based on statisti-
cal techniques and learning techniques, and their applications. [33] provides a review of
credit scoring and behavior scoring models, where the latter type of models use data on
the repayment and ordering history of a given customer. Numerous novel credit scoring
models have been published after the reviews of [11, 33], and are based on a variety
of techniques; including neural networks [34], self-organizing maps [18], feature selec-
tion, case based reasoning, support vector machines (SVM) [19], discriminant analysis,
multivariate adaptive regression splines (MARS), clustering, and combinations of these
techniques [6]. [30] develops a credit scoring framework and an expert system based on
neuro-fuzzy logic to assess creditworthiness of an entrepreneur.
Different from our study, the mentioned studies do not focus on the individual’s
attitude towards risk, namely, his/her risk preference. Risk preference and being risky
from a lender’s perspective are different issues. For example, an individual who is very
much risk-seeking may or may not have a high credit score (low credit risk). Also, these
studies do not provide an algorithm for determining scores in the absence of a learning
set.
Another research stream consists of the literature on customer segmentation as a
part of Customer Relationship Management (CRM). [24] presents a summary of the
5. research on supervised classification for CRM. [20] employs decision tree models for
not only generating business rules regarding behavior patterns of customers, but also
for dynamically tracking the changes in these rules.
We develop a numerical score for representing risk preferences with regards to fi-
nancial decision making, using data from a field survey. However, risk preferences can
also be estimated through controlled field experiments [17]. These experiments often
identify deviations in human behavior from theoretical predictions, which is studied in
the behavioral finance literature [4].
3 Methodology and Results
Our methodology is outlined below. In the following subsections, each step of the
methodology is presented alongside the results we obtain based on our sample survey
data.
1. Survey design
2. Survey conduct
3. Risk scoring
4. Classification
5. Insight generation
3.1 Survey Design
We investigated the risk scoring surveys of a number of financial institutions available
on the Web, and developed our survey by choosing 23 direct (risk-related) and 9 indirect
(demographic) questions among the popular ones. Appropriate selection of the direct
attributes for a survey directly affects the risk scores and the subsequent data mining
study, and hence is very important.
The questions in the survey were designed such that the choices given to respon-
dents are sorted according to (hypothesized) risk preferences. For example, in the sur-
vey questions with three choices, selecting choice (a) is assumed to reflect risk-averse
behavior, whereas selecting choice (c) is assumed to reflect risk-seeking behavior.
Examples of the questions on direct attributes include the number of times a person
plays in the stock market, the investment types that a person would feel more comfort-
able with, and the most important investment goal of that person. A number of sample
direct questions is provided in Appendix A. The complete survey (English version) is
provided in Appendix A of the supplementary document for this chapter [10].
We used the following nine indirect attributes in our study:
– Gender: male or female
– IsStudent: whether the person an employee or a student
– StudentLevel: undergrad, masters
– IncomeType: fixed salary, incentive based, or both
– SoccerTeam: the soccer team that the person supports
– HighschoolType: public, private, public science, private science, other
6. – EnglishLevel: the level of English language skill
– GermanLevel: the level of German language skill
– FrenchLevel: the level of French language skill
The other indirect questions in the survey, such as the department that a student
studies in, were not included in the scoring and prediction phases of the study because
they were open-ended.
3.2 Survey Conduct
The survey was conducted in Turkish language on 656 respondents, with balanced dis-
tribution of working people (346) vs. students (250 undergraduates and 60 graduates),
and gender (283 females vs. 373 males), from a multitude of universities and work en-
vironments. Among the working participants, 71 work only for commission, 204 work
for fixed income and 71 work for both commission and fixed income. The distribution
of values for the attributes are given in Appendix B of the supplementary document
[10].
One challenge faced while conducting the survey was the communication of finance
and insurance concepts, and the choices available to respondents. This is important for
ensuring valid answers to the survey questions and hence improving the reliability of the
sample study. To this end, all surveys were conducted through one-to-one interaction
with individuals by our research team. One drawback of this approach is that commu-
nication may influence respondents’ risk preferences. For example, [27] observes that
farmers in Netherlands exhibit more risk-seeking behavior when they understand and
trust the insurance tools through one-to-one interaction. The results of [27] confirm ear-
lier findings in India, Africa, and South America. We do not analyze the effects of such
a bias.
Once the survey was conducted, the data was assembled in a spreadsheet software
and cleaned following the guidelines in the taxonomy of dirty data in [21]. Also at the
data cleaning stage, data was anonymized, so that it can be shared with colleagues and
students in future projects.
3.3 Risk Scoring
The survey data is fed into the risk scoring algorithm in the form of an I × J sized
matrix, representing I respondents and J attributes. This algorithm determines which
direct attributes are to be used in scoring, the weights for each attribute, and based on
these, the risk scores for each respondent. The mathematical notation and the pseudo-
code of the scoring algorithm are given in Appendix B.
The initialization step in the algorithm linearly transforms ordinal choice data into
nominal values between 0 and 3. For example, if a question has five choices (a, b, c,
d, e), the corresponding numerical values would be (0.00, 0.75, 1.50, 2.25, 3.00). This
linear transformation is used for simplicity; however, there is no guarantee it is the most
accurate representation.
Following the initialization phase, quantitative attribute values are fed into a regression-
based iterative algorithm. The algorithm operates as a multi-pass self-organizing heuris-
tic, which aims at obtaining converged risk scores. The stopping criterion is satisfied
7. when the average absolute percentage difference in risk scores is less than the threshold
provided by the analyst. At each iteration of the algorithm, the value vector for each
of the selected attributes is entered into a linear regression model as factor, where the
response is the incumbent risk score vector. Weights for the attributes are updated at
the beginning of each iteration, such that the sum of the weights is equal to the num-
ber of included attributes. The algorithm allows for change in the direction of signs
when the choices for an attribute should take decreasing -rather than increasing- values
from choice (a) to the final choice. Hence, the algorithm not only eliminates irrelevant
attributes, but also suggests the direction of risk preferences for the choices of a given
attribute. The algorithm is an unsupervised algorithm, as it does not require any class la-
bels or scores from the user. It is also a self-organizing algorithm [2], as it automatically
converges to a solution at the desired error threshold.
After the risk scores are calculated for all respondents, a certain top percentage of
them are labeled as risk-seeking and the rest as risk-averse. This is used in the subse-
quent classification step of the methodology.
The algorithm was coded in Matlab computational environment [25]. The mapping
of the ordinal values O = [oi j ]656×23 to nominal values in the initialization step was
performed in the spreadsheet software, and the Matlab code was run with the obtained
matrix of nominal values A = [ai j ]656×23 . The parameters for the algorithm were se-
lected as E = 0.1 and α = 0.05. Running time for the algorithm was negligibly small
(less than one second) for this sample.
Results on scoring algorithm:
The average absolute percentage change ek in risk scores is shown in Fig. 1. We
observe ek to halve in only two iterations, and to get very close to zero after the first
10 iterations. The algorithm converges to the given threshold E rapidly, in only 19
iterations.
Fig. 2 shows the weights obtained for each of the 23 direct attributes. Five of the 23
direct attributes (Q20, Q21, Q22, Q38, Q40) are assigned a weight of 0 by the algorithm.
That is, the algorithm removes these five questions from the risk score computations,
because they fail to impact the scores in a statistically significant way, given the pres-
ence of the other 18 attributes. The positive weights are observed in the range (0.2792,
Fig. 1. The convergence of the algorithm, based on the average percentage change in risk scores
8. 1.6320). The hypothesized directions of choice ranks are found to be correct for all the
attributes (Γj = 1, ∀ j ∈ J).
Fig. 3 illustrates the histogram of the risk scores we calculate, labeling 20% of
the respondents as risk-seeking and the rest as risk-averse. While the risk scores seem
to exhibit normal distribution, Shapiro-Wilk test for normality [29], carried out in R
statistical package [32], resulted in p = 3.2E − 7 0.05, very strongly suggesting a
non-normal fit.
Fig. 2. Calculated weights for the direct attributes in the case study
Fig. 3. Risk score histogram and the definition of (risk) class labels
9. 3.4 Classification
The next step in the methodology investigates whether risk preferences can be predicted
through only direct, only indirect or both sets of attributes. To this end, we use five
classification algorithms from the field of machine learning for predicting whether a
person is risk-seeking or risk-averse, as labeled by the scoring algorithm of step 3.
These algorithms, also referred to as learners, are Naive Bayes, k-Nearest Neighbor
(kNN), C4.5, Support Vector Machines (SVM), and Decision Trees (DT)4 [8].
In classification models, a learning dataset is used by the learner for supervised
learning to later on predict the class label for new respondents. The predictors can have
nominal or categorical values, whereas the predicted class attribute should have cat-
egorical (class label) values. The success of a learner is measured primarily through
classification accuracy on a provided test dataset, besides a number of other metrics.
Classification accuracy is defined as the percentage of correct predictions made by the
classification algorithm on the test dataset.
Fig. 4 illustrates the generic classification model we construct for risk preference
prediction, as well as the widgets for decision tree analysis in the Orange data mining
software [35]. In the classification model, some of the attributes in the full dataset are
selected as the predictors and the risk-preference attribute (taking class label values of
risk-seeking or risk-averse) is selected as the class attribute.
Classification accuracy is computed through 70% sampling with ten repeats. In
other words, for each learner, ten experiments are carried out, with a random 70% of
Fig. 4. Classification model for predicting risk preference behavior, together with the decision
tree analysis widgets.
4 also referred to as classification trees
10. Table 1. Classification accuracies of the models for predicting risk preferences
Learner Model Model Model Model Model Model
1a 2a 3a 1b 2b 3b
1 Naive Bayes 0.9635 0.7888 0.9650 0.9467 0.8954 0.9452
2 kNN 0.9279 0.7675 0.9091 0.9391 0.8756 0.9452
3 C4.5 0.9279 0.8020 0.9269 0.9198 0.8985 0.9173
4 SVM 0.9528 0.8020 0.9452 0.9650 0.8985 0.9584
5 DT 0.9142 0.7741 0.9030 0.9239 0.8919 0.9137
the sample being used as the training dataset each time, and the remaining used as the
test dataset.
Results on classification models:
Table 1 presents the classification accuracy results of the six models. We observe
that in Model 1a, Naive Bayes learner successfully classifies (on the average) 96.35%
of the respondents in the test dataset. This is not surprising, since the direct attributes
that Model 1a uses were used in the computation of risk scores in the first place, which
are eventually transformed into the risk preference class labels. Therefore, high clas-
sification accuracy for Model 1a is expected. What is surprising is the relatively high
(around 80%) classification accuracy that the learners in Model 2b achieve. This find-
ing suggests that indirect attributes can be almost as successful as direct attributes in
predicting risk preference.
Another surprising outcome is the poor performance of Models 3a and 3b, which
use both direct and indirect attributes. Model 3a is outperformed by Model 1a with
all but one learner. The comparison between Models 3b and 1b is also similar. This
observation suggests that if one is already using the direct attributes, adding indirect
attributes can deteriorate the classification performance of learners.
While not yielding the highest classification accuracy in any of the models, decision
tree (DT) may be preferred over other (black-box) learners due to its strong explana-
tory capacity, in the form of explicit rules it generates. We discuss one decision tree
application in the following step.
3.5 Insight Generation
In this step of the methodology, we aim to determine whether the answers to direct or
indirect questions convey information about the risk preferences of respondents. To this
end, a decision tree is constructed in the Orange model.
Decision trees summarize rule-based information regarding classes using trees. As
opposed to the black-box operation of machine learning algorithms, decision trees re-
turn explicit rules, in the form “IF Antecedent THEN Consequent”, that can easily be
understood and adopted for real world applications. For example, in the context of risk,
[23] gives an example rule which states that credit card holders who withdrew money
11. at casinos had higher rates of delinquency and bankruptcy. Such rules can also encap-
sulate the domain knowledge in expert systems development, in the form of rule bases
[12]. Wagner et al. [36] state that knowledge acquisition is the greatest bottleneck in
the expert system development process, due to unavailability of experts and knowledge
engineers and difficulties with the rule extraction process. Our methodology offers a
recipe for this important bottleneck of expert systems development.
In decision trees, branching is carried out at each node according to a split crite-
rion and a tree with a desired depth is constructed. At each deeper level, the split that
yields the most increase in the split criterion is selected. [7] gives a concise review of
algorithms for decision tree analysis, explaining the characteristics of each algorithm.
In our decision tree analysis, we use the ID3 algorithm [28] in Orange software [35]
that creates branches based on the information gain criterion. Each level in the decision
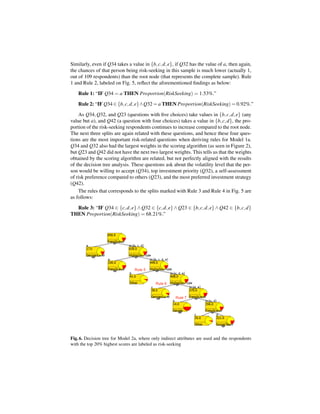
tree is based on the value of a particular variable. For instance, in Fig. 5, the root node
of the decision tree contains 656 respondents and the branching is based on question
34 (Q34). In each node of this decision tree, the dark slice of the pie chart shows the
proportion of risk-seeking participants, and the remaining portion of the pie shows risk-
averse respondents in that sub-sample. In decision trees, we are especially interested
in identifying the nodes that differ significantly from the root node with respect to the
shares of the slices, and the splits that result in significant changes in the slices of the
pie chart compared to the parent node (the node above the split).
Fig. 5 shows the decision tree for Model 1a, where only the direct attributes are
used. We observe a significant branching based on the answer given to Q34 (question
34). When Q34 takes the value a, the percentage of risk-seeking respondents drops
significantly from 20.00% (Definition “a”) to just 1.53% (2 out of 130 respondents).
Fig. 5. Decision tree for Model 1a, where only direct attributes are used and the respondents with
the top 20% highest scores are labeled as risk-seeking
12. Similarly, even if Q34 takes a value in {b, c, d, e}, if Q32 has the value of a, then again,
the chances of that person being risk-seeking in this sample is much lower (actually 1,
out of 109 respondents) than the root node (that represents the complete sample). Rule
1 and Rule 2, labeled on Fig. 5, reflect the aforementioned findings as below:
Rule 1: “IF Q34 = a THEN Proportion(RiskSeeking) = 1.53%.”
Rule 2: “IF Q34 ∈ {b, c, d, e}∧Q32 = a THEN Proportion(RiskSeeking) = 0.92%.”
As Q34, Q32, and Q23 (questions with five choices) take values in {b, c, d, e} (any
value but a), and Q42 (a question with four choices) takes a value in {b, c, d}, the pro-
portion of the risk-seeking respondents continues to increase compared to the root node.
The next three splits are again related with these questions, and hence these four ques-
tions are the most important risk-related questions when deriving rules for Model 1a.
Q34 and Q32 also had the largest weights in the scoring algorithm (as seen in Figure 2),
but Q23 and Q42 did not have the next two largest weights. This tells us that the weights
obtained by the scoring algorithm are related, but not perfectly aligned with the results
of the decision tree analysis. These questions ask about the volatility level that the per-
son would be willing to accept (Q34), top investment priority (Q32), a self-assessment
of risk preference compared to others (Q23), and the most preferred investment strategy
(Q42).
The rules that corresponds to the splits marked with Rule 3 and Rule 4 in Fig. 5 are
as follows:
Rule 3: “IF Q34 ∈ {c, d, e} ∧ Q32 ∈ {c, d, e} ∧ Q23 ∈ {b, c, d, e} ∧ Q42 ∈ {b, c, d}
THEN Proportion(RiskSeeking) = 68.21%.”
Fig. 6. Decision tree for Model 2a, where only indirect attributes are used and the respondents
with the top 20% highest scores are labeled as risk-seeking
13. Rule 4: “IF Q34 ∈ {c, d, e} ∧ Q32 ∈ {c, d, e} ∧ Q23 ∈ {b, c, d, e} ∧ Q42 ∈ {c, d}
THEN Proportion(RiskSeeking) = 86.72%.”
The only difference between Rules 3 and 4 is that in Rule 4, Q42 takes values of c
or d, rather than a value in {b, c, d}.
Next, we discuss the decision tree for Model 2a, where only the indirect attributes
are used. As the decision tree in Fig. 6 suggests, FrenchLevel and HighschoolType
are the attributes that result in the most fundamental splits. A significant change takes
place in the pie structure when HighschoolType = b (public science high school5 ),
given that FrenchLevel ∈ {b, c, d}. Specifically, in the mentioned split, the pie slice that
corresponds to risk-seeking respondents becomes much smaller (3 respondents out of
41) compared to its parent node. This is Rule 5, labeled in Fig. 6 and stated below.
Rule 5: “IF FrenchLevel ∈ {b, c, d} ∧ HighschoolType = b THEN
Proportion(RiskSeeking) = 7.31%.”
A similar split takes place when HighschoolType = c (private science high school),
again resulting in a low proportion (4 out of 38) of risk-seeking respondents:
Rule 6: “IF FrenchLevel ∈ {b, c, d} ∧ HighschoolType = c THEN
Proportion(RiskSeeking) = 10.53%.”
It is striking that respondents who graduated from public and private science high
schools are much more risk-averse, compared to other sub-groups. This has impor-
tant implications for the business world: Our finding suggests that it is unlikely for
respondents with a strong science background in high-school to establish risky busi-
nesses, such as high-technology startups. However, such startups are highly critical in
the development of an economy, and are dependent on the know-how of technically
competent people, such as professionals with a strong science background beginning in
high school. Therefore, there should be mechanisms to encourage risk-taking behavior
among science high school alumni, and to establish connections between graduates of
science high schools and those with an entrepreneurial mindset.
In Fig. 6, another major split takes place in the split labeled as Rule 7. Here, the
question that creates the split is FrenchLevel = b (French level is intermediate), given
that HighschoolType ∈ {d, e} (private high school, and state high schools with foreign
language). FrenchLevel = b results in a very high proportion (7 out of 14) of risk-
seeking respondents. Yet, the number of respondents in the mentioned sub-sample is
very small, only 14, and this rule has to be handled with caution.
Rule 7: “IF HighschoolType ∈ {d, e} ∧ FrenchLevel = b THEN
Proportion(RiskSeeking) = 50.00%.”
Upon further querying, we find that only 3 out of 17 respondents (17.65%) that have
FrenchLevel = a are risk-seeking, whereas 8 out of 18 respondents (44.44%) that have
FrenchLevel = b are risk-seeking. Risk-seeking behavior is minimal (9.33%) among
the 75 respondents that have FrenchLevel = c. What could be the explanation for such
5 Science high school: specially designated high schools that heavily implement a math- and
science-oriented curriculum
14. a pattern? One possible explanation might be the following: In Turkey, individuals that
have FrenchLevel = a typically come from wealthy families and learn French in expen-
sive private high schools. Individuals that have FrenchLevel = b typically have strived
to learn French by themselves, without going to such schools. They have aspirations to
rise socio-economically, and are ready to take the risks needed to achieve their aspira-
tions. Definitely, the true explanation for this pattern is a research question for the field
of sociology.
4 Conclusions
In this study, we develop a scoring algorithm, implement it with real world survey data,
and obtain significant insights through mining risk scores for the sample. In particu-
lar, we find that demographic attributes of individuals can be used to predict their risk
preference categories. This result has important practical implications: Without asking
any risk-related questions, but by only obtaining demographic information, one can
estimate with reasonable accuracy whether a particular respondent is risk-seeking or
risk-averse. The data for those indirect attributes is often routinely collected on the In-
ternet when registering for web sites. This would eliminate the need to collect extensive
finance-related information or sensitive personal information [37] from customers. An-
other advantage is that, respondents would typically not distort their answers to indirect
questions, whereas they could do so with direct ones. Hence, our methodology can fea-
sibly be implemented in practice, and has the potential to bring significant predictive
power to the institution at minimal effort.
Classification of customers into risk preference categories is an important prob-
lem for financial institutions. As argued in [14], incorrectly classifying a risk-averse
customer as risk-seeking may later cause the customer to sell investments at a loss;
whereas the opposite mistake may cause the customer to miss his investment objec-
tives. Using our methodology, the institution can make a pre-classification of customers
into risk-averse and risk-seeking categories. If necessary, these customers can then be
given surveys with more tailored direct (risk-related) questions. The computational na-
ture of our methodology makes it easy to be integrated into existing CRM systems in
terms of data use and result feed.
The methodology and the scoring algorithm proposed in this work are actually plat-
forms on which better methodologies and algorithms can be designed. There exists a
rich possibility of future research on this area, mostly regarding the algorithm:
– The algorithm assumes that the risk score of each respondent can be computed
with the same set of attribute weights. However, different weights may apply to
different subgroups within the population. This can be analyzed by incorporating
cluster analysis [38, 39] into the current study.
– The numeric values assigned to the ordinal values of the attributes were assumed
to be linear and equally spaced; whereas the real relation may be highly nonlin-
ear. Linearizable functions [9] or higher order polynomials can be assumed for
attributes as a whole, or each attribute may be modeled flexibly to follow any of
these functional forms. As an even more general model, weights can be computed
not only for attributes, but for each choice of each attribute.
15. – In scoring, statistical techniques for feature selection and dimensionality reduction
that exist in literature [15] may be adopted to obtain approximately the same re-
sults with fewer direct questions. This problem can be solved together with the
outlier detection problem, as in [1], where the authors present a hybrid approach
combining case-based reasoning (CBR) with genetic algorithms (GAs) to optimize
attribute weights and select relevant respondents simultaneously.
– The scoring algorithm can be developed such that consistent results are obtained
for different samples. For example, in the ideal case, a respondent who answered
the same question in a particular sample should have same score if he was a part
of another sample. In our presented algorithm, each respondent’s risk score is de-
pendent on the answers of the whole sample. This will not pose a problem when
the methodology is applied to large data sets, such as all customers of a financial
institution.
– The proposed methodology eliminates irrelevant direct attributes in computing the
risk scores, but it does not eliminate indirect attributes that are irrelevant or do not
provide significant information. All the potential indirect attributes are considered
in the classification models. Dimensionality reduction techniques can be used in
this step of the methodology. This would allow asking as few indirect questions as
possible, but still being able to predict risk preference with a high accuracy.
Acknowledgement
The authors thank Sabancı University (SU) alumni Levent Bora, Kıvanc Kılınc, Onur
¸
¨
Ozcan, Feyyaz Etiz for their work on earlier phases of the study, and students Serpil
Cetin and Nazlı Ceylan Ers¨ z for collecting the data for the case study. The authors
¸ o
also thank SU students Gizem G¨ rdeniz, Havva G¨ zde Eksio˜ lu and Dicle Ceylan for
u o ¸ g
their assistance. This chapter is dedicated to the memory of Mr. Turgut Uzer, a leading
industrial engineer in Turkey, who passed away in February 2011. Mr. Turgut Uzer
inspired the authors greatly with his vision, unmatched know-how, and dedication to
the advancement of decision sciences.
Appendix A: Selected Survey Questions
Following are selected direct (risk-related) questions from the survey of the case study,
which constitute the corresponding direct (risk-related) attributes.
Q34. Over the long term, typically, investments which are more volatile (i.e., that tend to
fluctuate more in value) have greater potential for return (Stocks, for example, have high volatil-
ity; whereas government bonds have low volatility). Given this trade-off, what would be the level
of volatility you would prefer for your investment?
a Less than 3%
b 3% to 5%
c 5% to 7%
d 7% to 13%
e More than 13%
16. Q32. What is your most important investment priority?
a I aim to protect my capital; I cannot stand losing money.
b I am OK with small growth; I cannot take much risk.
c I aim for an investment that delivers the market return rate.
d I want higher than market return; I am OK with volatility.
e Return is the most important for me. I am ready to take high risk for high return.
Q23. Compared to others, how do you rate your willingness to take risk?
a Very low
b Low
c Average
d High
e Very high
Q42. What is your most preferred investment strategy?
a I want my investments to be secure. I also need my investments to provide me with modest
income now, or to fund a large expense within the next few years.
b I want my investments to grow and I am less concerned about income. I am comfortable with
moderate market fluctuations.
c I am more interested in having my investments grow over the long-term. I am comfortable
with short-term return volatility.
d I want long-term aggressive growth and I am willing to accept significant short-term market
fluctuations.
Appendix B: ScoringAlgorithm
Following is the mathematical presentation of the developed scoring algorithm:
Sets
I: set of respondents (observations, rows) in the sample; i = 1, · · · , I
J: set of attributes (questions, columns); j = 1, · · · , J
V: set of ordinal values for each attribute; v = 1, · · · ,V . For the presented case
study, V = (a, b, c, d, e), where a ≤ b ≤ c ≤ d ≤ e
Inputs
O = [oi j ]I×J : matrix of ordinal values of all attributes for all respondents
m j: number of possible ordinal values for attribute j; m j ≤ 5 in this study
Internal Variables
A = [ai j ]I×J : matrix of numerical (nominal) values of all attributes for all respondents
yi : temporary adjusted risk score for respondent i, to be used in regression
17. Parameters
E: threshold on absolute percentage error (falling below this value will terminate
the algorithm)
α: threshold for type-1 error (probability of rejecting a hypothesis when the hy-
pothesis is in fact true)
M: a very large number
B: transformation matrix for converting the ordinal input value matrix O into the
numerical (nominal) value matrix A
Outputs
z j: whether attribute j is to be included in computing the risk score; z j ∈ {0, 1}
w j: weight for attribute j; w j ≥ 0
β0 j : intercept value for attribute j
β1 j : slope value for attribute j
Γj : sign multiplier for attribute j; Γj ∈ {−1, 1}
xi : risk score for respondent i
Functions
f (v, n) : (V, {2, · · · ,V }) → [0, 3] : mapping function for an attribute with n possible
values, that transforms the ordinal value v collected for that attribute to a nominal value
bv,n−1 .
f (v, n) = bv,n−1
where, for V = 5,
0.00 0.00 0.00 0.00
3.00 1.50 1.00 0.75
B = [bvn ]V ×(V −1) =
· 3.00 2.00 1.50
· · 3.00 2.25
· · · 3.00
regression(y, a )
solve regression model y = β0 + β1 a + ε for vectors y and a
return (p, β0 , β1 ), where p is the p-value for the regression model
preprocess()
// transform ordinal attribute values to nominal values
ai j = f (oi j , m j ) ; ∀(i, j) ∈ I × J
Iteration-Related Notation
18. k: iteration count
N: number of attributes included in risk score computations at a given iteration
W: sum of weights for attributes
εk : absolute error at a given iteration k
ek : absolute percentage error at a given iteration k
ek : average absolute percentage error at a given iteration k
ScoringAlgorithm (O, m j )
BEGIN
// perform pre-processing to transform ordinal data to nominal data
preprocess()
// initialization:
// initially, all attributes are included in scoring,
// with unit weight of 1 and sign multiplier of 1.
// all of the regression intercepts are 0.
z j = 1, w j = 1, Γj = 1, β0 j = 0; ∀ j ∈ J
N = ∑j zj
// begin with iteration count of 1
k=1
Begin Iteration
// standardize the weights, so that their sum W will equal to N
W = ∑ j w jz j
w j ← (Nw j )/W ; ; ∀ j ∈ J
// compute the average of the intercepts
β 0· = (∑ j β0 j z j )/N
// compute/update the risk scores at iteration k,
// which is composed of the average intercept value
// and the sum of weighted values for attributes
xik = β 0· + ∑ j Γj w j ai j ; ∀i ∈ I
// compute total absolute error
εk = ∑i xik − xi,k−1
// correction for the initial error values
if k = 1 then
19. ε0 = ε1
// termination condition
if εk = 0 then
go to Iterations Completed
// compute absolute percentage error,
// and then its average over the last two iterations
x·k = ∑i xik /I
ek = 100εk /x·k
ek = (ek + ek−1 )/2
// if the stopping criterion is satisfied, terminate the algorithm
if ek < E then
go to Iterations Completed
// otherwise, continue with the regression modeling for each attribute j,
// and then go to next iteration
∀j ∈ J
// if the attribute is included in the risk score calculation
if z j = 1 then
// first remove the attribute value from the incumbent score
// to eliminate its effect
yi = xik − ai j ; ∀i ∈ I
// then define the vectors for the regression model of that attribute
y = (yi ) ; a = (Γj a· j )
(p, β0 , β1 ) = regression(y, a )
// if the regression yields a high p value
// that is greater than the type-1 error,
// this means that attribute j does not contribute significantly
// to the risk scores
if p > α then
// and the attribute should not be included in risk calculations
zj = 0
else
// else it will be included (will just keep its default value)
zj = 1
20. // and weight for the attribute will be the slope value
// obtained from the regression
w j = β1
// the sign of the slope is important;
// if it is negative, this should be noted
if β1 < 0 then
// record the sign change in the sign multiplier
Γj = −1
else
Γj = 1
// advance the iteration count and begin the next iteration
k++
go to Begin Iteration
Iterations Completed
xi = xik
return xi , z j , w j ,Γj , β 0 j
END
References
1. H. Ahn, K. Kim, and I. Han. Hybrid genetic algorithms and case-based reasoning systems for
customer classification. Expert Systems, 23(3):127–144, 2006.
2. W.R. Ashby. Principles of the self-organizing system. Principles of Self-organization, pages
255–278, 1962.
3. T. Aven and O. Renn. Risk Management and Governance: Concepts, Guidelines and Appli-
cations. Springer Verlag, 2010.
4. N. Barberis and R.H. Thaler. A survey of behavioral finance, in Handbook of the economics
of finance, Volume 1, Part 1, George M. Constantinides, Milton Harris, Ren´ M. Stulz (Eds.).
e
pages 1053–1128. Elsevier, 2003.
5. L. Cao. Behavior informatics and analytics: Let behavior talk. In ICDMW ’08. IEEE Interna-
tional Conference on Data Mining Workshops, 2008., pages 87–96, 2008.
6. F.L. Chen and F.C. Li. Combination of feature selection approaches with SVM in credit
scoring. Expert Systems with Applications, 37(7):4902–4909, 2010.
7. C.F. Chien and L.F. Chen. Data mining to improve personnel selection and enhance hu-
man capital: A case study in high-technology industry. Expert Systems with Applications,
34(1):280–290, 2008.
8. B. Clarke, E. Fokou´ , and H.H. Zhang. Principles and theory for data mining and machine
e
learning. Springer Verlag, 2009.
21. 9. C. Daniel and F.S. Wood. Fitting functions to data. New York: Wiley, 1980.
10. G. Ertek, M. Kaya, C. Kefeli, C. Onur, and K. Uzer. Supplementary document for
“Scoring and Predicting Risk Preferences”, Available online under http://people.
sabanciuniv.edu/ertekg/papers/supp/03.pdf. 2011.
11. J. Galindo and P. Tamayo. Credit risk assessment using statistical and machine learning:
Basic methodology and risk modeling applications. Computational Economics, 15(1):107–
143, 2000.
12. J.C. Giarratano and G. Riley. Expert systems: principles and programming. Brooks/Cole
Publishing Co., 1989.
13. J. E. Grable. Financial risk tolerance and additional factors that affect risk taking in everyday.
Journal of Business and Psychology, 14(4):625–630, 2000.
14. J.E. Grable and R.H. Lytton. Investor risk tolerance: Testing the efficacy of demographics as
differentiating and classifying factors. Financial Counseling and Planning, 9(1):61–74, 1998.
15. I. Guyon and A. Elisseeff. An introduction to variable and feature selection. The Journal of
Machine Learning Research, 3:1157–1182, 2003.
16. T.A. Hallahan, R.W. Faff, and M.D. Mckenzie. An empirical investigation of personal finan-
cial risk tolerance. Financial Services Review, 13(1):57–78, 2004.
17. G.W. Harrison, M.I. Lau, and E.E. Rutstrom. Estimating risk attitudes in Denmark: A field
experiment. Scandinavian Journal of Economics, 109(2):341–368, 2007.
18. N.C. Hsieh. An integrated data mining and behavioral scoring model for analyzing bank
customers. Expert Systems with Applications, 27(4):623–633, 2004.
19. C.L. Huang, M.C. Chen, and C.J. Wang. Credit scoring with a data mining approach based
on support vector machines. Expert Systems with Applications, 33(4):847–856, 2007.
20. J.K. Kim, H.S. Song, T.S. Kim, and H.K. Kim. Detecting the change of customer behavior
based on decision tree analysis. Expert Systems, 22(4):193–205, 2005.
21. W. Kim, B.J. Choi, E.K. Hong, S.K. Kim, and D. Lee. A taxonomy of dirty data. Data
Mining and Knowledge Discovery, 7(1):81–99, 2003.
22. H.C. Koh, CT Wei, and PG Chwee. A two-step method to construct credit scoring models
with data mining techniques. International Journal of Business and Information, 1(1):96–118,
2006.
23. L. Kuykendall. September 1999. The Data-Mining Toolbox. Credit Card Management,
12(7).
24. S. Lessmann and S. Voß. Supervised classification for decision support in customer rela-
tionship management, in Intelligent Decision Support, by Andreas Bortfeldt (Ed.), page 231,
2008.
25. MathWorks. Matlab, http://www.mathworks.com. 2011.
26. A. Palma and N. Picard. Evaluation of MiFID questionnaries in France. Technical report,
AMF, 2010.
27. A. Patt, N. Peterson, M. Carter, M. Velez, U. Hess, and P. Suarez. Making index insurance
attractive to farmers. Mitigation and Adaptation Strategies for Global Change, 14(8):737–
753, 2009.
28. J.R. Quinlan. Induction of decision trees. Machine learning, 1(1):81–106, 1986.
29. S.S. Shapiro and M.B. Wilk. An analysis of variance test for normality (complete samples).
Biometrika, 52(3/4):591–611, 1965.
30. D.K. Sreekantha and R.V. Kulkarni. Expert system design for credit risk evaluation using
neuro-fuzzy logic. Expert Systems. doi: 10.1111/j.1468-0394.2010.00562.x.
31. J. Sung and S. Hanna. Factors related to risk tolerance. Financial Counseling and Planning,
7, 1996.
32. The R Foundation for Statistical Computing. R Project, http://www.r-project.org.
2011.
22. 33. L.C. Thomas. A survey of credit and behavioural scoring: forecasting financial risk of lend-
ing to consumers. International Journal of Forecasting, 16(2):149–172, 2000.
34. C.F. Tsai and J.W. Wu. Using neural network ensembles for bankruptcy prediction and credit
scoring. Expert Systems with Applications, 34(4):2639–2649, 2008.
35. University of Ljubljana, Bioinformatics Laboratory. Orange, http://orange.biolab.
si/. 2011.
36. W.P. Wagner, M.K. Najdawi, and Q.B. Chung. Selection of knowledge acquisition tech-
niques based upon the problem domain characteristics of production and operations manage-
ment expert systems. Expert Systems, 18(2):76–87, 2001.
37. X.T. Wang, D.J. Kruger, and A. Wilke. Life history variables and risk-taking propensity.
Evolution and Human Behavior, 30(2):77–84, 2009.
38. R. Xu, and D. Wunsch. Survey of clustering algorithms. IEEE Transactions on Neural
Networks, 16(3):645–678, 2005.
39. D. Zakrzewska and J. Murlewski. Clustering algorithms for bank customer segmentation.
2005.