Download Link > https://ertekprojects.com/gurdal-ertek-publications/blog/a-framework-for-visualizing-association-mining-results/
Association mining is one of the most used data mining techniques due to interpretable and actionable results. In this study we pro-pose a framework to visualize the association mining results, speci¯cally frequent itemsets and association rules, as graphs. We demonstrate the applicability and usefulness of our approach through a Market Basket Analysis (MBA) case study where we visually explore the data mining results for a supermarket data set. In this case study we derive several
interesting insights regarding the relationships among the items and sug-gest how they can be used as basis for decision making in retailing.
Re-Mining Association Mining Results Through Visualization, Data Envelopment ...ertekg
İndirmek için Bağlantı > https://ertekprojects.com/gurdal-ertek-publications/blog/re-mining-association-mining-results-through-visualization-data-envelopment-analysis-and-decision-trees/
Re-mining is a general framework which suggests the execution of additional data mining steps based on the results of an original data mining process. This study investigates the multi-faceted re-mining of association mining results, develops and presents a practical methodology, and shows the applicability of the developed methodology through real world data. The methodology suggests re-mining using data visualization, data envelopment analysis, and decision trees. Six hypotheses, regarding how re-mining can be carried out on association mining results, are answered in the case study through empirical analysis.
This document compares hierarchical and non-hierarchical clustering algorithms. It summarizes four clustering algorithms: K-Means, K-Medoids, Farthest First Clustering (hierarchical algorithms), and DBSCAN (non-hierarchical algorithm). It describes the methodology of each algorithm and provides pseudocode. It also describes the datasets used to evaluate the performance of the algorithms and the evaluation metrics. The goal is to compare the performance of the clustering methods on different datasets.
IRJET- Evidence Chain for Missing Data Imputation: SurveyIRJET Journal
This document summarizes research on techniques for imputing missing data. It begins with an abstract describing a new method called Missing value Imputation Algorithm based on an Evidence Chain (MIAEC) that provides accurate imputation for increasing rates of missing data using a chain of evidence. It then reviews several existing imputation techniques including mean, regression, likelihood-based methods, and nearest neighbor approaches. The document proposes extending MIAEC with MapReduce for large-scale data processing. Key advantages of MIAEC include utilizing all relevant evidence to estimate missing values and ability to process large datasets.
This document provides a review of graph-based image classification and frequent subgraph mining algorithms. It first introduces graph-based image representation and the need for approximate subgraph matching to account for noise and distortions. It then surveys several existing frequent subgraph mining algorithms, including CSMiner, SUBDUE, gdFil, FSG, and PrefixSpan. These algorithms are categorized as Apriori-based approaches or pattern-growth approaches. The document also discusses applications of graph mining in other domains such as chemistry and biology.
A STUDY ON SIMILARITY MEASURE FUNCTIONS ON ENGINEERING MATERIALS SELECTION cscpconf
This document presents a study on using similarity measure functions to select engineering materials from a database. Thirteen similarity/distance functions are examined to quantify the similarity between materials based on their properties. A performance index measure is used to evaluate how well a selected material matches the target material. The materials are ranked based on their normalized performance index values. An algorithm is presented that takes a target material, calculates similarities to materials in a database using different functions, computes performance indexes, and selects the material with the minimum normalized performance index as the best match. Experimental results applied the approach to select materials from a database of 5670 materials that best match a target material described by 25 properties.
Day by day data is increasing, and most of the data stored in a database after manual transformations and derivations. Scientists can facilitate data intensive applications to study and understand the behaviour of a complex system. In a data intensive application, a scientific model facilitates raw data products to produce new data products and that data is collected from various sources such as physical, geological, environmental, chemical and biological etc. Based on the generated output, it is important to have the ability of tracing an output data product back to its source values if that particular output seems to have an unexpected value. Data provenance helps scientists to investigate the origin of an unexpected value. In this paper our aim is to find a reason behind the unexpected value from a database using query inversion and we are going to propose some hypothesis to make an inverse query for complex aggregation function and multiple relationship (join, set operation) function.
This document summarizes an article from the International Journal of Computer Engineering and Technology (IJCET) that proposes different indexing models for multiple queries called Indexing for Multiple Queries (IMQ). It first proposes using k-Nearest Neighbor (kNN) indexing for queries. It then describes an online method that creates an indexing model for each query based on similar labeled queries. It also describes two offline methods that pre-create indexing models to improve efficiency. Experimental results showed the online and offline kNN methods performed better than a baseline single indexing model method.
This document proposes using a b-colouring technique in graph theory to perform clustering analysis on the Pima Indian Diabetes database. B-colouring involves assigning colors (clusters) to graph vertices such that no adjacent vertices share a color, and each color class has a dominating vertex connected to all other color classes. This guarantees separation between clusters. The document applies b-colouring clustering to the Pima dataset and evaluates classification accuracy compared to other methods, achieving favorable results. Experimental analysis demonstrates the b-colouring approach and reviews cluster validity indices for determining the optimal partition number.
The document proposes an improved clustering algorithm for social network analysis. It combines BSP (Business System Planning) clustering with Principal Component Analysis (PCA) to group social network objects into classes based on their links and attributes. Specifically, it applies PCA before BSP clustering to reduce the dimensionality of the social network data and retain only the most important variables for clustering. This improves the BSP clustering results by focusing on the key information in the social network.
IJRET : International Journal of Research in Engineering and Technology is an international peer reviewed, online journal published by eSAT Publishing House for the enhancement of research in various disciplines of Engineering and Technology. The aim and scope of the journal is to provide an academic medium and an important reference for the advancement and dissemination of research results that support high-level learning, teaching and research in the fields of Engineering and Technology. We bring together Scientists, Academician, Field Engineers, Scholars and Students of related fields of Engineering and Technology.
Semi-Supervised Discriminant Analysis Based On Data Structureiosrjce
IOSR Journal of Computer Engineering (IOSR-JCE) is a double blind peer reviewed International Journal that provides rapid publication (within a month) of articles in all areas of computer engineering and its applications. The journal welcomes publications of high quality papers on theoretical developments and practical applications in computer technology. Original research papers, state-of-the-art reviews, and high quality technical notes are invited for publications.
Data mining techniques application for prediction in OLAP cubeIJECEIAES
Data warehouses represent collections of data organized to support a process of decision support, and provide an appropriate solution for managing large volumes of data. OLAP online analytics is a technology that complements data warehouses to make data usable and understandable by users, by providing tools for visualization, exploration, and navigation of data-cubes. On the other hand, data mining allows the extraction of knowledge from data with different methods of description, classification, explanation and prediction. As part of this work, we propose new ways to improve existing approaches in the process of decision support. In the continuity of the work treating the coupling between the online analysis and data mining to integrate prediction into OLAP, an approach based on automatic learning with Clustering is proposed in order to partition an initial data cube into dense sub-cubes that could serve as a learning set to build a prediction model. The technique of data mining by regression trees is then applied for each sub-cube to predict the value of a cell.
Comparative study of various supervisedclassification methodsforanalysing def...eSAT Publishing House
IJRET : International Journal of Research in Engineering and Technology is an international peer reviewed, online journal published by eSAT Publishing House for the enhancement of research in various disciplines of Engineering and Technology. The aim and scope of the journal is to provide an academic medium and an important reference for the advancement and dissemination of research results that support high-level learning, teaching and research in the fields of Engineering and Technology. We bring together Scientists, Academician, Field Engineers, Scholars and Students of related fields of Engineering and Technology.
This document provides an overview of different techniques for clustering categorical data. It discusses various clustering algorithms that have been used for categorical data, including K-modes, ROCK, COBWEB, and EM algorithms. It also reviews more recently developed algorithms for categorical data clustering, such as algorithms based on particle swarm optimization, rough set theory, and feature weighting schemes. The document concludes that clustering categorical data remains an important area of research, with opportunities to develop techniques that initialize cluster centers better.
IJRET : International Journal of Research in Engineering and Technology is an international peer reviewed, online journal published by eSAT Publishing House for the enhancement of research in various disciplines of Engineering and Technology. The aim and scope of the journal is to provide an academic medium and an important reference for the advancement and dissemination of research results that support high-level learning, teaching and research in the fields of Engineering and Technology. We bring together Scientists, Academician, Field Engineers, Scholars and Students of related fields of Engineering and Technology.
An experimental evaluation of similarity-based and embedding-based link predi...IJDKP
The task of inferring missing links or predicting future ones in a graph based on its current structure
is referred to as link prediction. Link prediction methods that are based on pairwise node similarity
are well-established approaches in the literature and show good prediction performance in many realworld graphs though they are heuristic. On the other hand, graph embedding approaches learn lowdimensional representation of nodes in graph and are capable of capturing inherent graph features,
and thus support the subsequent link prediction task in graph. This paper studies a selection of
methods from both categories on several benchmark (homogeneous) graphs with different properties
from various domains. Beyond the intra and inter category comparison of the performances of the
methods, our aim is also to uncover interesting connections between Graph Neural Network(GNN)-
based methods and heuristic ones as a means to alleviate the black-box well-known limitation.
IRJET- Customer Segmentation from Massive Customer Transaction DataIRJET Journal
This document discusses various methods for customer segmentation through analysis of massive customer transaction data, including K-Means clustering, PAM clustering, agglomerative clustering, divisive clustering, and density-based clustering. It finds that K-Means is the most commonly used partitioning method. The document also reviews related work on customer segmentation and clustering algorithms like CLARA, CLARANS, BIRCH, ROCK, CHAMELEON, CURE, DHCC, DBSCAN, and LOF. It proposes a framework for an online shopping site that would apply these techniques to group customers based on their product preferences in transaction data.
The document discusses non-linear data structures, specifically trees. It provides definitions and terminology related to trees, including root, parent, child, ancestors, descendants, path, height, depth, degree, siblings, and subtrees. It also describes the tree abstract data type (ADT) and common tree traversal algorithms like level order traversal. Key topics covered include the tree ADT methods (accessor, generic, query, update), exceptions that may occur, and binary trees as a specific type of tree where each node has no more than two children.
ENHANCING KEYWORD SEARCH OVER RELATIONAL DATABASES USING ONTOLOGIEScsandit
This document summarizes a research paper that proposes a system to enhance keyword search over relational databases using ontologies. The system builds structures during pre-processing like a reachability index to store connectivity information and an ontology concept graph. During querying, it maps keywords to concepts, uses the ontology to find related concepts and tuples, and generates top-k answer trees combining syntactic and semantic matches while limiting redundant results. The system is expected to perform better than existing approaches by reducing storage requirements through its approach to materializing neighborhood information in the reachability index.
GI-ANFIS APPROACH FOR ENVISAGE HEART ATTACK DISEASE USING DATA MINING TECHNIQUESAM Publications
The process of selecting a subset of relevant features from the feature space for use in model construction and used to carry out the feature selection process is called as pre processing step. The filter approach computationally fast and given accuracy results. The Professional Medical Conduct Board Actions data consist of all public actions taken against physicians, physician assistants, specialist assistants, and medical professional. The Classification and Regression Trees (CART), which described the generation of binary decision trees CART were invented independently of one another at around the same time, yet follow a similar approach for learning decision trees from training tuples. The research used GI-ANFIS is used to data mining technique on heart data sets to provide the diagnosis results.
Application Of Extreme Value Theory To Bursts PredictionCSCJournals
Bursts and extreme events in quantities such as connection durations, file sizes, throughput, etc. may produce undesirable consequences in computer networks. Deterioration in the quality of service is a major consequence. Predicting these extreme events and burst is important. It helps in reserving the right resources for a better quality of service. We applied Extreme value theory (EVT) to predict bursts in network traffic. We took a deeper look into the application of EVT by using EVT based Exploratory Data Analysis. We found that traffic is naturally divided into two categories, Internal and external traffic. The internal traffic follows generalized extreme value (GEV) model with a negative shape parameter, which is also the same as Weibull distribution. The external traffic follows a GEV with positive shape parameter, which is Frechet distribution. These findings are of great value to the quality of service in data networks, especially when included in service level agreement as traffic descriptor parameters.
PATTERN GENERATION FOR COMPLEX DATA USING HYBRID MININGIJDKP
This document discusses a hybrid data mining approach called combined mining that can generate informative patterns from complex data sources. It proposes applying three techniques: 1) Using the Lossy-counting algorithm on individual data sources to obtain frequent itemsets, 2) Generating incremental pair and cluster patterns using a multi-feature approach, 3) Combining FP-growth and Bayesian Belief Network using a multi-method approach to generate classifiers. The approach is tested on two datasets to obtain more useful knowledge and the results are compared.
IRJET- Customer Relationship and Management SystemIRJET Journal
This document discusses a customer relationship management (CRM) system that uses data mining techniques like classification, clustering, and regression to analyze customer data and improve customer relationships. It specifically proposes using fuzzy c-means clustering, which assigns customers to clusters based on membership values rather than binary classifications. This allows a customer to belong to multiple clusters, addressing limitations of traditional k-means clustering. The paper outlines the fuzzy c-means clustering algorithm and concludes it has advantages over crisp clustering methods for segmenting customer data in a CRM system.
Fuzzy logic applications for data acquisition systems of practical measurement IJECEIAES
In laboratory works, the error in measurement, reading the measurring devices, similarity of experimental data and lack of understanding of practicum materials are often found. These will lead to the inacurracy and invalid in data obtanined. As an alternative solution, application of fuzzy logic to the data acquisition system using a web server. This research focuses on the design of data acquisition systems with the target of reducing the error rate in measuring experimental data on the laboratory. Data measurement on laboratory practice module is done by taking the analog data resulted from the measurement. Furthermore, the data are converted into digital data via arduino and stored on the server. To get valid data, the server will process the data by using fuzzy logic method. The valid data are integrated into a web server so that it can be accessed as needed. The results showed that the data acquisition system based on fuzzy logic is able to provide recommendation of measurement result on the lab works based on the degree value of membership and truth value. Fuzzy logic will select the measured data with a maximum error percentage of 5% and select the measurement result which has minimum error rate.
Developing Competitive Strategies in Higher Education through Visual Data Miningertekg
Download Link > https://ertekprojects.com/gurdal-ertek-publications/blog/visual-data-mining-for-developing-competitive-strategies-in-higher-education/
Information visualization is the growing field of computer science that aims at visually mining data for knowledge discovery. In this paper, a data mining framework and a novel information visualization scheme is developed and applied to the domain of higher education. The presented framework consists of three main types of visual data analysis: Discovering general insights, carrying out competitive benchmarking, and planning for High School Relationship Management (HSRM). In this paper the framework and the square tiles visualization scheme are described and an application at a private university in Turkey with the goal of attracting bright-est students is demonstrated.
Insights into the Efficiencies of On-Shore Wind Turbines: A Data-Centric Anal...ertekg
Download Link > https://ertekprojects.com/gurdal-ertek-publications/blog/insights-into-the-efficiencies-of-on-shore-wind-turbines-a-data-centric-analysis/
Literature on renewable energy alternative of wind turbines does not include a multidimensional benchmarking studythat can help investment decisions as well as design processes. This paper presents a data-centric analysis of commercial on-shore wind turbines and provides actionable insights through analytical benchmarking through Data Envelopment Analysis (DEA), visual data analysis, and statistical hypothesis testing. The paper also introduces a novel visualization approach for the understanding and the interpretation of reference sets, the set of efficient wind turbines that should be taken as benchmark by inefficient ones.
O documento discute como histórias podem emocionar, ensinar, inspirar e motivar as pessoas. A organização Anastásia cria conexões entre aqueles que precisam de ajuda e aqueles que podem ajudar por meio de histórias para transformar vidas. Eles financiam a produção de histórias de ONGs e divulgam para arrecadar apoio para causas específicas.
El documento habla sobre la motivación. Define la motivación como los estímulos que activan el organismo y conducen a una conducta dirigida a un objetivo. Explica que la motivación es lo que hace que un individuo actúe de una determinada manera como resultado de una combinación de procesos intelectuales, fisiológicos y psicológicos. También describe el ciclo motivacional que incluye las etapas de homeostasis, estímulo, necesidad, estado de tensión, comportamiento y satisfacción.
Kathleen O'Leary is an academic advisor at Bitterroot College who has made significant contributions to student success and the growth of the college. When the coordinator for disability services started working there, the college needed guidance and support. O'Leary took a leadership role in creating the advising program from scratch to ensure students succeed. She has also shown her talents through taking on extra projects and roles. The coordinator asserts that O'Leary is an important asset to Bitterroot College and its increasing success as part of the University of Montana system.
Best B2B Ecommerce Solution In India, China, Taiwan, Germany & KoreaPrathamesh Landge
This document describes the features and capabilities of the YUJ B2B e-commerce platform. It provides a comprehensive B2B solution that includes catalog management, pricing tools, order processing, and mobile apps for sales teams and customers. The platform aims to automate the entire B2B process from order entry to fulfillment tracking to improve efficiency. It also includes tools like bulk product uploads, custom reports, and integrations with payment gateways and ERP systems.
INFOGRAPHIC: How to Measure Your Upfront/NewFront ROIagencyEA
Consider two critical avenues to measure your success and think beyond the traditional definition of ROI. Establish metrics to reflect the return on investment AND the return on innovation in order to effectively demonstrate the value gained from your upfront participation.
Adelina loves whales and wants to see them in the tropical lagoon near her home. She goes with her family to the bluff overlooking the lagoon and sees a group of whales swimming and making rumbling sounds. A biologist explains to Adelina that the whales are a family group and uses the lagoon as a safe place to rest and care for their calves.
Clear Language report for Draft_White_Paper_PGHD_Policy_FrameworkDon Taylor
Consumer health technologies have increased the availability of patient-generated health data (PGHD) that can empower patients and provide benefits to clinicians and researchers. However, challenges remain in incorporating PGHD into clinical and research workflows due to a lack of technical infrastructure, guidance on use, and evidence of benefits. Developing a policy framework with enabling actions for stakeholders could help advance the appropriate capture, use, and sharing of PGHD to improve care delivery and research.
Android KitKat was designed to run fast on a broader range of devices through improved memory management that launches services serially and more aggressively protects system memory. It introduced a printing framework that allows users to discover printers, change paper sizes, select pages to print, and print any content over Wi-Fi. KitKat also included low-power sensor batching and step detection/counting as well as new ways to build immersive, full-screen apps with rich visual content and animations. A tool called ProcStats was added to help analyze memory resources and identify background services by keeping track of how apps run over time.
The document discusses an enterprise information management (EIM) framework and big data readiness assessment. It provides an overview of key components of an EIM framework, including data governance, data integration, data lifecycle management, and maturity assessments of EIM disciplines and enablers. It then describes a big data readiness assessment that helps organizations address questions around their need for and ability to exploit big data by determining which foundational EIM capabilities must be established and what aspects need improvement before embarking on a big data initiative.
A framework for visualizing association mining resultsGurdal Ertek
Association mining is one of the most used data mining tech-
niques due to interpretable and actionable results. In this study we propose a framework to visualize the association mining results, specifically frequent itemsets and association rules, as graphs. We demonstrate the applicability and usefulness of our approach through a Market Basket Analysis (MBA) case study where we visually explore the data mining results for a supermarket data set. In this case study we derive several
interesting insights regarding the relationships among the items and suggest how they can be used as basis for decision making in retailing.
http://research.sabanciuniv.edu.
Linking Behavioral Patterns to Personal Attributes through Data Re-Miningertekg
Download Link >https://ertekprojects.com/gurdal-ertek-publications/blog/linking-behavioral-patterns-to-personal-attributes-through-data-re-mining/
A fundamental challenge in behavioral informatics is the development of methodologies and systems that can achieve its goals and tasks, including be-havior pattern analysis. This study presents such a methodology, that can be con-verted into a decision support system, by the appropriate integration of existing tools for association mining and graph visualization. The methodology enables the linking of behavioral patterns to personal attributes, through the re-mining of colored association graphs that represent item associations. The methodology is described and mathematically formalized, and is demonstrated in a case study related with retail industry.
Linking Behavioral Patterns to Personal Attributes through Data Re-MiningGurdal Ertek
A fundamental challenge in behavioral informatics is the development of methodologies and systems that can achieve its goals and tasks, including behavior pattern analysis. This study presents such a methodology, that can be converted
into a decision support system, by the appropriate integration of existing tools for association mining and graph visualization. The methodology enables the linking of behavioral patterns to personal attributes, through the re-mining of colored association graphs that represent item associations. The methodology is described and mathematically formalized, and is demonstrated in a case study related with retail industry.
http://research.sabanciuniv.edu.
Re-Mining Association Mining Results through Visualization, Data Envelopment ...Gurdal Ertek
Re-mining is a general framework which suggests the execution of additional data mining steps based on the results of an original data mining process. This study investigates the multi-faceted re-mining of association mining results, develops and presents a practical methodology, and shows the applicability of the developed methodology through real world data. The methodology suggests re-mining using data visualization, data envelopment analysis, and decision trees. Six hypotheses, regarding how re-mining can be carried out on association mining results, are answered in the case study through empirical analysis.
http://research.sabanciuniv.edu.
Recommendation system using unsupervised machine learning algorithm & associjerd
This document discusses using a combination of unsupervised machine learning algorithms, including Farthest First clustering and the Apriori association rule algorithm, for a course recommendation system. It presents an approach that clusters student data from a learning management system (LMS) like Moodle without needing to preprocess the data. Then, association rules are generated to find the best combinations of courses based on the student clusters. The combined approach is tested on sample LMS data to demonstrate its ability to recommend courses without requiring data preparation steps compared to using only the Apriori algorithm.
1) The document discusses a review of semantic approaches for nearest neighbor search. It describes using an ontology to add a semantic layer to an information retrieval system to relate concepts using query words.
2) A technique called spatial inverted index is proposed to locate multidimensional information and handle nearest neighbor queries by finding the hospitals closest to a given address.
3) Several semantic approaches are described including using clustering measures, specificity measures, link analysis, and relation-based page ranking to improve search and interpret hidden concepts behind keywords.
Developing Competitive Strategies in Higher Education through Visual Data MiningGurdal Ertek
Information visualization is the growing field of computer science that aims at visually mining data for knowledge discovery. In this paper, a data mining framework and a novel information visualization scheme is developed and applied
to the domain of higher education. The presented framework consists of three main types of visual data analysis: Discovering general insights, carrying out competitive
benchmarking, and planning for High School Relationship Management (HSRM). In this paper the framework and the square tiles visualization scheme are described and an application at a private university in Turkey with the goal of attracting brightest students is demonstrated.
http://research.sabanciuniv.edu.
International Journal of Computational Engineering Research (IJCER) is dedicated to protecting personal information and will make every reasonable effort to handle collected information appropriately. All information collected, as well as related requests, will be handled as carefully and efficiently as possible in accordance with IJCER standards for integrity and objectivity.
Analyzing the solutions of DEA through information visualization and data min...ertekg
Download Link > https://ertekprojects.com/gurdal-ertek-publications/blog/analyzing-the-solutions-of-dea-through-information-visualization-and-data-mining-techniques-smartdea-framework/
Data envelopment analysis (DEA) has proven to be a useful tool for assessing efficiency or productivity of organizations, which is of vital practical importance in managerial decision making. DEA provides a significant amount of information from which analysts and managers derive insights and guidelines to promote their existing performances. Regarding to this fact, effective and methodologic analysis and interpretation of DEA solutions are very critical. The main objective of this study is then to develop a general decision support system (DSS) framework to analyze the solutions of basic DEA models. The paper formally shows how the solutions of DEA models should be structured so that these solutions can be examined and interpreted by analysts through information visualization and data mining techniques effectively. An innovative and convenient DEA solver, SmartDEA, is designed and developed in accordance with the pro-posed analysis framework. The developed software provides a DEA solution which is consistent with the framework and is ready-to-analyze with data mining tools, through a table-based structure. The developed framework is tested and applied in a real world project for benchmarking the vendors of a leading Turkish automotive company. The results show the effectiveness and the efficacy of the proposed framework.
Comparison of Cost Estimation Methods using Hybrid Artificial Intelligence on...IJERA Editor
Cost estimating at schematic design stage as the basis of project evaluation, engineering design, and cost
management, plays an important role in project decision under a limited definition of scope and constraints in
available information and time, and the presence of uncertainties. The purpose of this study is to compare the
performance of cost estimation models of two different hybrid artificial intelligence approaches: regression
analysis-adaptive neuro fuzzy inference system (RANFIS) and case based reasoning-genetic algorithm (CBRGA)
techniques. The models were developed based on the same 50 low-cost apartment project datasets in
Indonesia. Tested on another five testing data, the models were proven to perform very well in term of accuracy.
A CBR-GA model was found to be the best performer but suffered from disadvantage of needing 15 cost drivers
if compared to only 4 cost drivers required by RANFIS for on-par performance.
ESTIMATING PROJECT DEVELOPMENT EFFORT USING CLUSTERED REGRESSION APPROACHcscpconf
Due to the intangible nature of “software”, accurate and reliable software effort estimation is a challenge in the software Industry. It is unlikely to expect very accurate estimates of software
development effort because of the inherent uncertainty in software development projects and the complex and dynamic interaction of factors that impact software development. Heterogeneity exists in the software engineering datasets because data is made available from diverse sources.
This can be reduced by defining certain relationship between the data values by classifying them into different clusters. This study focuses on how the combination of clustering and
regression techniques can reduce the potential problems in effectiveness of predictive efficiency due to heterogeneity of the data. Using a clustered approach creates the subsets of data having a degree of homogeneity that enhances prediction accuracy. It was also observed in this study that ridge regression performs better than other regression techniques used in the analysis.
Estimating project development effort using clustered regression approachcsandit
Due to the intangible nature of “software”, accurate and reliable software effort estimation is a
challenge in the software Industry. It is unlikely to expect very accurate estimates of software
development effort because of the inherent uncertainty in software development projects and the
complex and dynamic interaction of factors that impact software development. Heterogeneity
exists in the software engineering datasets because data is made available from diverse sources.
This can be reduced by defining certain relationship between the data values by classifying
them into different clusters. This study focuses on how the combination of clustering and
regression techniques can reduce the potential problems in effectiveness of predictive efficiency
due to heterogeneity of the data. Using a clustered approach creates the subsets of data having
a degree of homogeneity that enhances prediction accuracy. It was also observed in this study
that ridge regression performs better than other regression techniques used in the analysis.
A Framework for Automated Association Mining Over Multiple Databasesertekg
Download Link > https://ertekprojects.com/gurdal-ertek-publications/blog/a-framework-for-automated-association-mining-over-multiple-databases/
Literature on association mining, the data mining methodology that investigates associations between items, has primarily focused on efficiently mining larger databases. The motivation for association mining is to use the rules obtained from historical data to influence future transactions. However, associations in transactional processes change significantly over time, implying that rules extracted for a given time interval may not be applicable for a later time interval. Hence, an analysis framework is necessary to identify how associations change over time. This paper presents such a framework, reports the implementation of the framework as a tool, and demonstrates the applicability of and the necessity for the framework through a case study in the domain of finance.
Analyzing the solutions of DEA through information visualization and data min...Gurdal Ertek
Data envelopment analysis (DEA) has proven to be a useful tool for assessing efficiency or productivity of organizations, which is of vital practical importance in managerial decision making. DEA provides a significant amount of information from which analysts and managers derive insights and guidelines to promote their existing performances. Regarding to this fact, effective and methodologic analysis and interpretation of DEA solutions are very critical. The main objective of this study is then to develop a general decision support system (DSS) framework to analyze the solutions of basic DEA models. The paper formally shows how the solutions of DEA models should be structured so that these solutions can be examined and interpreted by analysts through information visualization and data mining techniques effectively. An innovative and convenient DEA solver, Smart DEA, is designed and developed in accordance with the proposed analysis framework. The developed software provides a DEA solution which is consistent with the framework and is ready-to-analyze with data mining tools, through a table-based structure. The developed framework is tested and applied in a real world project for bench marking the vendors of a leading Turkish automotive company. The results show the effectiveness and the efficacy of the proposed framework.
http://research.sabanciuniv.edu.
Usage and Research Challenges in the Area of Frequent Pattern in Data MiningIOSR Journals
This document discusses the usage of frequent patterns in data mining, including for association mining, classification, and clustering. It provides background on foundational approaches for mining associations using frequent patterns, such as the Apriori, FP-growth, and ECLAT algorithms. It also discusses how frequent patterns have been used for classification tasks, such as generating discriminative features for training classifiers. Finally, it covers various ways frequent patterns have been applied to clustering problems, such as using frequent itemsets to represent and group documents for clustering. The document provides an overview of the state-of-the-art in applying frequent pattern mining across different data mining applications.
A Novel Multi- Viewpoint based Similarity Measure for Document ClusteringIJMER
International Journal of Modern Engineering Research (IJMER) is Peer reviewed, online Journal. It serves as an international archival forum of scholarly research related to engineering and science education.
International Journal of Modern Engineering Research (IJMER) covers all the fields of engineering and science: Electrical Engineering, Mechanical Engineering, Civil Engineering, Chemical Engineering, Computer Engineering, Agricultural Engineering, Aerospace Engineering, Thermodynamics, Structural Engineering, Control Engineering, Robotics, Mechatronics, Fluid Mechanics, Nanotechnology, Simulators, Web-based Learning, Remote Laboratories, Engineering Design Methods, Education Research, Students' Satisfaction and Motivation, Global Projects, and Assessment…. And many more.
MAP/REDUCE DESIGN AND IMPLEMENTATION OF APRIORIALGORITHM FOR HANDLING VOLUMIN...acijjournal
Apriori is one of the key algorithms to generate frequent itemsets. Analysing frequent itemset is a crucial
step in analysing structured data and in finding association relationship between items. This stands as an
elementary foundation to supervised learning, which encompasses classifier and feature extraction
methods. Applying this algorithm is crucial to understand the behaviour of structured data. Most of the
structured data in scientific domain are voluminous. Processing such kind of data requires state of the art
computing machines. Setting up such an infrastructure is expensive. Hence a distributed environment
such as a clustered setup is employed for tackling such scenarios. Apache Hadoop distribution is one of
the cluster frameworks in distributed environment that helps by distributing voluminous data across a
number of nodes in the framework. This paper focuses on map/reduce design and implementation of
Apriori algorithm for structured data analysis.
A Framework for Automated Association Mining Over Multiple DatabasesGurdal Ertek
Literature on association mining, the data mining methodology that investigates associations between items, has primarily focused on efficiently mining larger databases. The motivation for association mining is to use the rules obtained from historical data to influence future transactions. However, associations in transactional processes change significantly over time, implying that rules extracted for a given time interval may not be applicable for a later time interval. Hence, an
analysis framework is necessary to identify how associations change over time. This paper presents such a framework, reports the implementation of the framework as a tool, and demonstrates the applicability of and the necessity for the framework through a case study in the domain of finance.
http://research.sabanciuniv.edu.
This document proposes a new similarity measure for comparing spatial MDX queries in a spatial data warehouse to support spatial personalization approaches. The proposed similarity measure takes into account the topology, direction, and distance between the spatial objects referenced in the MDX queries. It defines the topological distance between spatial scenes referenced in queries based on a conceptual neighborhood graph. It also defines the directional distance between queries based on a graph of spatial directions and transformation costs. The similarity measure will be included in a recommendation approach the authors are developing to recommend relevant anticipated queries to users based on their previous queries.
Re-mining Positive and Negative Association Mining Resultsertekg
Download Link > https://ertekprojects.com/gurdal-ertek-publications/blog/re-mining-positive-and-negative-association-mining-results/
Positive and negative association mining are well-known and extensively studied data mining techniques to analyze market basket data. Efficient algorithms exist to find both types of association, sepa-rately or simultaneously. Association mining is performed by operating on the transaction data. Despite being an integral part of the transaction data, the pricing and time information has not been incorporated into market basket analysis so far, and additional attributes have been han-dled using quantitative association mining. In this paper, a new approach is proposed to incorporate price, time and domain related attributes into data mining by re-mining the association mining results. The underlying factors behind positive and negative relationships, as indicated by the as-sociation rules, are characterized and described through the second data mining stagere-mining. The applicability of the methodology is demon-strated by analyzing data coming from apparel retailing industry, where price markdown is an essential tool for promoting sales and generating increased revenue.
Similar to A Framework for Visualizing Association Mining Results (20)
Rule-based expert systems for supporting university studentsertekg
Download Link > https://ertekprojects.com/gurdal-ertek-publications/blog/rule-based-expert-systems-for-supporting-university-students/
There are more than 15 million college students in the US alone. Academic advising for courses and scholarships is typically performed by human advisors, bringing an immense managerial workload to faculty members, as well as other staff at universities. This paper reports and discusses the development of two educational expert systems at a private international university. The first expert system is a course advising system which recommends courses to undergraduate students. The second system suggests scholarships to undergraduate students based on their eligibility. While there have been reported systems for course advising, the literature does not seem to contain any references to expert systems for scholarship recommendation and eligibility checking. Therefore the scholarship recommender that we developed is first of its kind. Both systems have been implemented and tested using Oracle Policy Automation (OPA) software.
Optimizing the electric charge station network of EŞARJertekg
Download Link > https://ertekprojects.com/gurdal-ertek-publications/blog/optimizing-the-electric-charge-station-network-of-esarj/
In this study, we adopt the classic capacitated p-median location model for the solution of a network design problem, in the domain of electric charge station network design, for a leading company in Turkey. Our model encompasses the location preferences of the company managers as preference scores incorporated into the objective function. Our model also incorporates the capacity concerns of the managers through constraints on maximum number of districts and maximum population that can be served from a location. The model optimally selects the new station locations and the visualization of model results provides additional insights.
Competitiveness of Top 100 U.S. Universities: A Benchmark Study Using Data En...ertekg
Download Link > https://ertekprojects.com/gurdal-ertek-publications/blog/benchmark-study-using-data-envelopment-analysis/
This study presents a comprehensive benchmarking study of the top 100 U.S. Universities. The methodologies used to come up with insights into the domain are Data Envelopment Analysis (DEA) and information visualization. Various approaches to evaluating academic institutions have appeared in the literature, including a DEA literature dealing with the ranking of universities. Our study contributes to this literature by the extensive incorporation of information visualization and subsequently the discovery of new insights.
Industrial Benchmarking through Information Visualization and Data Envelopmen...ertekg
Download Link > https://ertekprojects.com/gurdal-ertek-publications/blog/industrial-benchmarking-through-information-visualization-and-data-envelopment-analysis-a-new-framework/
We present a benchmarking study on the companies in the Turkish food industry based on their financial data. Our aim is to develop a comprehensive benchmarking framework using Data Envelopment Analysis (DEA) and information visualization. Besides DEA, a traditional tool for financial benchmarking based on financial ratios is also incorporated. The consistency/inconsistency between the two methodologies is investigated using information visualization tools. In addition, k-means clustering, a fundamental method from machine learning, is applied to understand the relationship between k-means clustering and DEA.
Download Link > https://ertekprojects.com/gurdal-ertek-publications/blog/modelling-the-supply-chain-perception-gaps/
This study applies the research of perception gap analysis to supply chain integration and develops a generic model, the 3-Level Gaps Model, with the goal of contributing to harmonization and integration in the supply chain. The model suggests that significant perception gaps may exist among supply chain members with regards to the importance of different performance criteria. The concept of the model is conceived through an empirical and inductive approach, combining the research discipline of supply chain relationship and perception gap analysis. First hand data has been collected through a survey across a key buyer in the motor insurance industry and its eight suppliers. Rigorous statistical analysis testified the research hypotheses, which in turn verified the validity and relevance of the developed 3-Level Gaps Model. The research reveals the significant existence of supply chain perception gaps at all three levels as defined, which could be the root-causes to underperformed supply chain.
Risk Factors and Identifiers for Alzheimer’s Disease: A Data Mining Analysisertekg
Download Link > https://ertekprojects.com/gurdal-ertek-publications/blog/risk-factors-and-identifiers-for-alzheimers-disease-a-data-mining-analysis/
The topic of this paper is the Alzheimer’s Disease (AD), with the goal being the analysis of risk factors and identifying tests that can help diagnose AD. While there exists multiple studies that analyze the factors that can help diagnose or predict AD, this is the first study that considers only non-image data, while using a multitude of techniques from machine learning and data mining. The applied methods include classification tree analysis, cluster analysis, data visualization, and classification analysis. All the analysis, except classification analysis, resulted in insights that eventually lead to the construction of a risk table for AD. The study contributes to the literature not only with new insights, but also by demonstrating a framework for analysis of such data. The insights obtained in this study can be used by individuals and health professionals to assess possible risks, and take preventive measures.
Download Link > https://ertekprojects.com/gurdal-ertek-publications/blog/text-mining-with-rapidminer/
The goal of this chapter is to introduce the text mining capabilities of RAPIDMINER through a use case. The use case involves mining reviews for hotels at TripAdvisor.com, a popular web portal. We will be demonstrating basic text mining in RAPIDMINER using the text mining extension. We will present two different RAPIDMINER processes, namely Process01 andProcess02, which respectively describe how text mining can be combined with association mining and cluster modeling. While it is possible to construct each of these processes from scratch by inserting the appropriate operators into the process view, we will instead import these two processes readily from existing model files. Throughout the chapter, we will at times deliberately instruct the reader to take erroneous steps that result in undesired outcomes. We believe that this is a very realistic way of learning to use RAPIDMINER, since in practice, the modeling process frequently involves such steps that are later corrected.
Competitive Pattern-Based Strategies under Complexity: The Case of Turkish Ma...ertekg
Download Link > https://ertekprojects.com/gurdal-ertek-publications/blog/competitive-pattern-based-strategies-under-complexity-the-case-of-turkish-managers/
This paper aims to augment current Enterprise Architecture (EA) frameworks to become pattern-based. The main motivation behind pattern-based EA is the support for strategic decisions based on the patterns prioritized in a country or industry. Thus, to validate the need for pattern-based EA, it is essential to show how different patterns gain priority under different contexts, such as industries. To this end, this chapter also reveals the value of alternative managerial strategies across different industries and business functions in a specific market, namely Turkey. Value perceptions for alternative managerial strategies were collected via survey, and the values for strategies were analyzed through the rigorous application of statistical techniques. Then, evidence was searched and obtained from business literature that support or refute the statistically-supported hypothesis. The results obtained through statistical analysis are typically confirmed with reports of real world cases in the business literature. Results suggest that Turkish firms differ significantly in the way they value different managerial strategies. There also exist differences based on industries and business functions. Our study provides guidelines to managers in Turkey, an emerging country, on which strategies are valued most in their industries. This way, managers can have a better understanding of their competitors and business environment, and can develop the appropriate pattern-based EA to cope with complexity and succeed in the market.
Supplier and Buyer Driven Channels in a Two-Stage Supply Chainertekg
Download Link > https://ertekprojects.com/gurdal-ertek-publications/blog/supplier-and-buyer-driven-channels-in-a-two-stage-supply-chain/
We explore the impact of power structure on price, sensitivity of market price, and profits in a two-stage supply chain with single product, supplier and buyer, and a price sensitive market. We develop and analyze the case where the supplier has dominant bargaining power and the case where the buyer has dominant bargaining power. We consider a pricing scheme for the buyer that involves both a multiplier and a markup. We show that it is optimal for the buyer to set the markup to zero and use only a multiplier. We also show that the market price and its sensitivity are higher when operational costs (namely distribution and inventory) exist. We observe that the sensitivity of the market price increases non-linearly as the wholesale price increases, and derive a lower bound for it. Through experimental analysis, we show that marginal impact of increasing shipment cost and carrying charge (interest rate) on prices and profits are decreasing in both cases. Finally, we show that there exist problem instances where the buyer may prefer supplier-driven case to markup-only buyer-driven and similarly problem instances where the supplier may prefer markup-only buyer-driven case to supplier-driven.
Simulation Modeling For Quality And Productivity In Steel Cord Manufacturingertekg
Download Link > https://ertekprojects.com/gurdal-ertek-publications/blog/simulation-modeling-for-quality-and-productivity-in-steel-cord-manufacturing/
We describe the application of simulation modeling to estimate and improve quality and productivity performance of a steel cord manufacturing system. We describe the typical steel cord manufacturing plant, emphasize its distinguishing characteristics, identify various production settings and discuss applicability of simulation as a management decision support tool. Besides presenting the general structure of the developed simulation model, we focus on wire fractures, which can be an important source of system disruption.
Visual and analytical mining of transactions data for production planning f...ertekg
Download Link > https://ertekprojects.com/gurdal-ertek-publications/blog/visual-and-analytical-mining-of-sales-transaction-data-for-production-planning-and-marketing/
Recent developments in information technology paved the way for the collection of large amounts of data pertaining to various aspects of an enterprise. The greatest challenge faced in processing these massive amounts of raw data gathered turns out to be the effective management of data with the ultimate purpose of deriving necessary and meaningful information out of it. The following paper presents an attempt to illustrate the combination of visual and analytical data mining techniques for planning of marketing and production activities. The primary phases of the proposed framework consist of filtering, clustering and comparison steps
implemented using interactive pie charts, K-Means algorithm and parallel coordinate plots respectively. A prototype decision support system is developed and a sample analysis session is conducted to demonstrate the applicability of the framework.
Download Link > https://ertekprojects.com/gurdal-ertek-publications/blog/a-tutorial-on-crossdocking/
In crossdocking, the inbound materials coming in trucks to the crossdock facility are directed to outbound doors and are directly loaded into trucks that will perform shipment, or are staged for a very brief time period before loading. Crossdocking has a great potential to bring savings in logistics: For example, most of the logistics success of Wal-Mart, the world’s leading retailer, is attributed to crossdocking.In this paper,the types of crossdocking are identified, the situations and industries where crossdocking is applicable are explained, prerequisites, advantages and drawbacks are listed, and implementation issues are discussed. Finally a case study that describes the crossdocking applications of a 3rd party logistics firm is presented.
Application Of Local Search Methods For Solving A Quadratic Assignment Probl...ertekg
Download Link > https://ertekprojects.com/gurdal-ertek-publications/blog/application-of-local-search-methods-for-solving-a-quadratic-assignment-problem-a-case-study/
This paper discusses the design and application of local search methods to a real-life application at a steel cord manufacturing plant. The case study involves a layout problem that can be represented as a Quadratic Assignment Problem (QAP). Due to the nature of the manufacturing process, certain machinery need to be allocated in close proximity to each other. This issue is incorporated into the objective function through assigning high penalty costs to the unfavorable allocations. QAP belongs to one of the most difficult class of combinatorial optimization problems, and is not solvable to optimality as the number of facilities increases. We implement the well-known local search methods, 2-opt, 3-opt and tabu search. We compare the solution performances of the methods to the results obtained from the NEOS server, which provides free access to many optimization solvers on the internet.
Financial Benchmarking Of Transportation Companies In The New York Stock Exc...ertekg
Download Link > https://ertekprojects.com/gurdal-ertek-publications/blog/financial-benchmarking-of-transportation-companies-in-the-new-york-stock-exchange-nyse-through-data-envelopment-analysis-dea-and-visualization/
In this paper, we present a benchmarking study of industrial transportation companies traded in the New York Stock Exchange (NYSE). There are two distinguishing aspects of our study: First, instead of using operational data for the input and the output items of the developed Data Envelopment Analysis (DEA) model, we use financial data of the companies that are readily available on the Internet. Secondly, we visualize the efficiency scores of the companies in relation to the subsectors and the number of employees. These visualizations enable us to discover interesting insights about the companies within each subsector, and about subsectors in comparison to each other. The visualization approach that we employ can be used in any DEA study that contains subgroups within a group. Thus, our paper also contains a methodological contribution.
Optimizing Waste Collection In An Organized Industrial Region: A Case Studyertekg
This document summarizes a case study that optimizes industrial waste collection from 17 factories located in an organized industrial region in Turkey. The authors developed a mixed integer programming model to determine the optimal waste container locations and transportation routes to minimize total costs. They applied the model to real data from an industrial zone. The optimal solution selected 3 out of 5 candidate locations and had a minimum monthly cost of 70,338 Turkish Lira. The authors also created a visualization of the optimal supply chain network to provide additional insights into the solution.
Demonstrating Warehousing Concepts Through Interactive Animationsertekg
Download Link > https://ertekprojects.com/gurdal-ertek-publications/blog/demonstrating-warehousing-concepts-through-interactive-animations/
In this paper, we report development of interactive computer animations to demonstrate warehousing concepts, providing a virtual environment for learning. Almost every company, regardless of its industry, holds inventory of goods in its warehouse(s) to respond to customer demand promptly, to coordinate supply and demand, to realize economies of scale in manufacturing or processing, to add value to its products and to reduce response time. Design, analysis, and improvement of warehouse operations can yield significant savings for a company. Warehousing science can be considered as an important field within the industrial engineering discipline. However, there is very little educational material (including web based media), and only a handful of books available in this field. We believe that the animations that we developed will significantly contribute to the understanding of warehousing concepts, and enable tomorrow’s practitioners to grasp the fundamentals of managing warehouses.
Application of the Cutting Stock Problem to a Construction Company: A Case Studyertekg
Download Link > https://ertekprojects.com/gurdal-ertek-publications/blog/application-of-the-cutting-stock-problem-to-a-construction-company-a-case-study/
This paper presents an application of the well-known cutting stock problem to a construction firm. The goal of the 1Dimensional (1D) cutting stock problem is to cut the bars of desired lengths in required quantities from longer bars of given length. The company for which we carried out this study encounters 1D cutting stock problem in cutting steel bars (reinforcement bars) for its construction projects. We have developed several solution approaches to solving the company’s problem: Building and solving an integer programming (IP) model in a modeling environment, developing our own software that uses a mixed integer programming (MIP) software library, and testing some of the commercial software packages available on the internet. In this paper, we summarize our experiences with all the three approaches. We also present a benchmark of existing commercial software packages, and some critical insights. Finally, we suggest a visual approach for increasing performance in solving the cutting stock problem and demonstrate the applicability of this approach using the company’s data on two construction projects.
Benchmarking The Turkish Apparel Retail Industry Through Data Envelopment Ana...ertekg
Download Link > https://ertekprojects.com/gurdal-ertek-publications/blog/benchmarking-the-turkish-apparel-retail-industry-through-data-envelopment-analysis-dea-and-data-visualization/
This paper presents a benchmarking study of the Turkish apparel retailing industry. We have applied the Data Envelopment Analysis (DEA) methodology to determine the efficiencies of the companies in the industry. In the DEA model the number of stores, number of corners, total sales area and number of employees were included as inputs and annual sales revenue was included as the output. The efficiency scores obtained through DEA were visualized for gaining insights about the industry and revealing guidelines that can aid in strategic decision making.
Visual Mining of Science Citation Data for Benchmarking Scientific and Techno...ertekg
Download Link > https://ertekprojects.com/gurdal-ertek-publications/blog/visual-mining-of-science-citation-data-for-benchmarking-scientific-and-technological-competitiveness-of-world-countries/
In this paper we present a study where we visually analyzed science citation data to investigate the competitiveness of world countries in selected categories of science. The dataset that we worked on in our study includes the number of papers published and the number of citations made in the ESI (Essential Science Indicators) database in 2004. The dataset lists these values for practically every country in the world. In analyzing the data, we employ methods and software tools developed and used in the data mining and information visualization fields of the Computer Science. Some of the questions for which we look for answers in this study are the following: (a) Which countries are most competitive in the selected categories of science? (i.e. Engineering, Computer Science, Economics & Business) (b) What type of correlations exist between different categories of science? For example, do countries with many published papers in the field of Engineering science also have many papers published on Computer Science or Economics & Business? (c) Which countries produce the most influential papers? This analysis is needed since a country may have many papers published but these papers may be cited very rarely. (d) Can we gain useful and actionable insights by combining science citation data with socioeconomic and geographical data?
Best Competitive Marble Pricing in Dubai - ☎ 9928909666Stone Art Hub
Stone Art Hub offers the best competitive Marble Pricing in Dubai, ensuring affordability without compromising quality. With a wide range of exquisite marble options to choose from, you can enhance your spaces with elegance and sophistication. For inquiries or orders, contact us at ☎ 9928909666. Experience luxury at unbeatable prices.
Navigating the world of forex trading can be challenging, especially for beginners. To help you make an informed decision, we have comprehensively compared the best forex brokers in India for 2024. This article, reviewed by Top Forex Brokers Review, will cover featured award winners, the best forex brokers, featured offers, the best copy trading platforms, the best forex brokers for beginners, the best MetaTrader brokers, and recently updated reviews. We will focus on FP Markets, Black Bull, EightCap, IC Markets, and Octa.
Industrial Tech SW: Category Renewal and CreationChristian Dahlen
Every industrial revolution has created a new set of categories and a new set of players.
Multiple new technologies have emerged, but Samsara and C3.ai are only two companies which have gone public so far.
Manufacturing startups constitute the largest pipeline share of unicorns and IPO candidates in the SF Bay Area, and software startups dominate in Germany.
SATTA MATKA SATTA FAST RESULT KALYAN TOP MATKA RESULT KALYAN SATTA MATKA FAST RESULT MILAN RATAN RAJDHANI MAIN BAZAR MATKA FAST TIPS RESULT MATKA CHART JODI CHART PANEL CHART FREE FIX GAME SATTAMATKA ! MATKA MOBI SATTA 143 spboss.in TOP NO1 RESULT FULL RATE MATKA ONLINE GAME PLAY BY APP SPBOSS
How are Lilac French Bulldogs Beauty Charming the World and Capturing Hearts....Lacey Max
“After being the most listed dog breed in the United States for 31
years in a row, the Labrador Retriever has dropped to second place
in the American Kennel Club's annual survey of the country's most
popular canines. The French Bulldog is the new top dog in the
United States as of 2022. The stylish puppy has ascended the
rankings in rapid time despite having health concerns and limited
color choices.”
[To download this presentation, visit:
https://www.oeconsulting.com.sg/training-presentations]
This PowerPoint compilation offers a comprehensive overview of 20 leading innovation management frameworks and methodologies, selected for their broad applicability across various industries and organizational contexts. These frameworks are valuable resources for a wide range of users, including business professionals, educators, and consultants.
Each framework is presented with visually engaging diagrams and templates, ensuring the content is both informative and appealing. While this compilation is thorough, please note that the slides are intended as supplementary resources and may not be sufficient for standalone instructional purposes.
This compilation is ideal for anyone looking to enhance their understanding of innovation management and drive meaningful change within their organization. Whether you aim to improve product development processes, enhance customer experiences, or drive digital transformation, these frameworks offer valuable insights and tools to help you achieve your goals.
INCLUDED FRAMEWORKS/MODELS:
1. Stanford’s Design Thinking
2. IDEO’s Human-Centered Design
3. Strategyzer’s Business Model Innovation
4. Lean Startup Methodology
5. Agile Innovation Framework
6. Doblin’s Ten Types of Innovation
7. McKinsey’s Three Horizons of Growth
8. Customer Journey Map
9. Christensen’s Disruptive Innovation Theory
10. Blue Ocean Strategy
11. Strategyn’s Jobs-To-Be-Done (JTBD) Framework with Job Map
12. Design Sprint Framework
13. The Double Diamond
14. Lean Six Sigma DMAIC
15. TRIZ Problem-Solving Framework
16. Edward de Bono’s Six Thinking Hats
17. Stage-Gate Model
18. Toyota’s Six Steps of Kaizen
19. Microsoft’s Digital Transformation Framework
20. Design for Six Sigma (DFSS)
To download this presentation, visit:
https://www.oeconsulting.com.sg/training-presentations
Profiles of Iconic Fashion Personalities.pdfTTop Threads
The fashion industry is dynamic and ever-changing, continuously sculpted by trailblazing visionaries who challenge norms and redefine beauty. This document delves into the profiles of some of the most iconic fashion personalities whose impact has left a lasting impression on the industry. From timeless designers to modern-day influencers, each individual has uniquely woven their thread into the rich fabric of fashion history, contributing to its ongoing evolution.
Storytelling is an incredibly valuable tool to share data and information. To get the most impact from stories there are a number of key ingredients. These are based on science and human nature. Using these elements in a story you can deliver information impactfully, ensure action and drive change.
Digital Marketing with a Focus on Sustainabilitysssourabhsharma
Digital Marketing best practices including influencer marketing, content creators, and omnichannel marketing for Sustainable Brands at the Sustainable Cosmetics Summit 2024 in New York
𝐔𝐧𝐯𝐞𝐢𝐥 𝐭𝐡𝐞 𝐅𝐮𝐭𝐮𝐫𝐞 𝐨𝐟 𝐄𝐧𝐞𝐫𝐠𝐲 𝐄𝐟𝐟𝐢𝐜𝐢𝐞𝐧𝐜𝐲 𝐰𝐢𝐭𝐡 𝐍𝐄𝐖𝐍𝐓𝐈𝐃𝐄’𝐬 𝐋𝐚𝐭𝐞𝐬𝐭 𝐎𝐟𝐟𝐞𝐫𝐢𝐧𝐠𝐬
Explore the details in our newly released product manual, which showcases NEWNTIDE's advanced heat pump technologies. Delve into our energy-efficient and eco-friendly solutions tailored for diverse global markets.
Unveiling the Dynamic Personalities, Key Dates, and Horoscope Insights: Gemin...my Pandit
Explore the fascinating world of the Gemini Zodiac Sign. Discover the unique personality traits, key dates, and horoscope insights of Gemini individuals. Learn how their sociable, communicative nature and boundless curiosity make them the dynamic explorers of the zodiac. Dive into the duality of the Gemini sign and understand their intellectual and adventurous spirit.
Best practices for project execution and deliveryCLIVE MINCHIN
A select set of project management best practices to keep your project on-track, on-cost and aligned to scope. Many firms have don't have the necessary skills, diligence, methods and oversight of their projects; this leads to slippage, higher costs and longer timeframes. Often firms have a history of projects that simply failed to move the needle. These best practices will help your firm avoid these pitfalls but they require fortitude to apply.
HOW TO START UP A COMPANY A STEP-BY-STEP GUIDE.pdf46adnanshahzad
How to Start Up a Company: A Step-by-Step Guide Starting a company is an exciting adventure that combines creativity, strategy, and hard work. It can seem overwhelming at first, but with the right guidance, anyone can transform a great idea into a successful business. Let's dive into how to start up a company, from the initial spark of an idea to securing funding and launching your startup.
Introduction
Have you ever dreamed of turning your innovative idea into a thriving business? Starting a company involves numerous steps and decisions, but don't worry—we're here to help. Whether you're exploring how to start a startup company or wondering how to start up a small business, this guide will walk you through the process, step by step.
Brian Fitzsimmons on the Business Strategy and Content Flywheel of Barstool S...Neil Horowitz
On episode 272 of the Digital and Social Media Sports Podcast, Neil chatted with Brian Fitzsimmons, Director of Licensing and Business Development for Barstool Sports.
What follows is a collection of snippets from the podcast. To hear the full interview and more, check out the podcast on all podcast platforms and at www.dsmsports.net
A Framework for Visualizing Association Mining Results
1. Ertek, G. and Demiriz, A. (2006). "A framework for visualizing association mining results.”
Lecture Notes in Computer Science, vol: 4263, pp. 593-602.
Note: This is the final draft version of this paper. Please cite this paper (or this final draft) as
above. You can download this final draft from http://research.sabanciuniv.edu.
A Framework for Visualizing
Association Mining Results
Gürdal Ertek1 and Ayhan Demiriz2
1 Sabanci University
Faculty of Engineering and Natural Sciences
Orhanli, Tuzla, 34956, Istanbul, Turkey
2 Department of Industrial Engineering
Sakarya University
54187, Sakarya, Turkey
2. A Framework for Visualizing
Association Mining Results
G¨rdal Ertek1 and Ayhan Demiriz2
u
1
Sabanci University
Faculty of Engineering and Natural Sciences
Orhanli, Tuzla, 34956, Istanbul, Turkey
ertekg@sabanciuniv.edu
2
Department of Industrial Engineering
Sakarya University
54187, Sakarya, Turkey
ademiriz@gmail.com
Abstract. Association mining is one of the most used data mining tech-
niques due to interpretable and actionable results. In this study we pro-
pose a framework to visualize the association mining results, specifically
frequent itemsets and association rules, as graphs. We demonstrate the
applicability and usefulness of our approach through a Market Basket
Analysis (MBA) case study where we visually explore the data mining
results for a supermarket data set. In this case study we derive several
interesting insights regarding the relationships among the items and sug-
gest how they can be used as basis for decision making in retailing.
1 Introduction
Association mining is an increasingly used data mining and business tool among
practitioners and business analysts [7]. Interpretable and actionable results of
association mining can be considered as the major reasons for the popularity
of this type of data mining tools. Association rules can be classified based on
several criteria, as outlined in [11]. In this paper, we focus on single-dimensional,
single-level boolean association rules, in the context of market basket analysis.
By utilizing efficient algorithms such as Apriori [2] to analyze very large trans-
actional data -frequently from transactional sales data- will result in a large set
of association rules. Commonly, finding the association rules from very large
data sets is considered and emphasized as the most challenging step in associa-
tion mining. Often, results are presented in a text (or table) format with some
querying and sorting functionalities. The rules include “if” clauses by default.
The structure of such rules is as follows: “If the customer purchases Item A, then
with probability C% he/she will buy Item B.”
This probability, C%, is referred to as confidence level. More formally, the
confidence level can be computed as follows: C = f requency(A∩B) , where A ∩ B
f requency(A)
refers to the transactions that have both Item A and Item B. Confidence level
is also equivalent to the conditional probability of having Item B given Item A.
3. 2 G¨ rdal Ertek and Ayhan Demiriz
u
Another important statistic in association mining is the support level. Support
level is basically equal to the fraction of the transactions that have both Item A
and Item B. Thus the support level S is computed as follows: S = f requency(A∩B)
T
where T is equal to the total number of the transactions. Left and right hand
sides of the rule are called antecedent and consequent of the rule respectively.
There exists an extensive literature where a multitude of interestingness mea-
sures for association rules are suggested [22] and efficient data mining algorithms
are presented for deriving these measures. However, there is considerably less
work that focuses on the interpretation of the association mining results.
Information visualization, a growing field of research in computer science [6,
8, 13], investigates ways of visually representing multi-dimensional data with the
purpose of knowledge discovery. The significance and the impact of information
visualization is reflected by the development and availability of highly user-
friendly and successful software tools such as Miner3D [18], Spotfire [21], Advizor
[1], DBMiner [11], and IBM Intelligent Miner Visualization [15].
Our motivation for this study stems from the idea that visualizing the results
of association mining can help end-users significantly by enabling them to derive
previously unknown insights. We provide a framework that is easy to implement
(since it simply merges two existing fields of computer science) and that provides
a flexible and human-centered way of discovering insights.
In spite of successful visualization tools mentioned above, the visualization
of the association mining results in particular is somewhat a fertile field of study.
Some of the studies done in this field are summarized in the next section. We then
introduce our proposed framework in Section 3. We explain our implementation
in Section 4. We report our findings from the case study in Section 5. We then
conclude with future research directions in Section 6.
2 Literature Review
The visualization of association mining results has attracted attention recently,
due to the invention of information visualization schemes such as parallel coor-
dinate plots (||-coords). Here we summarize some of the studies that we believe
are the most interesting.
Hofmann et al. [14] elegantly visualize association rules through Mosaic plots
and Double Decker plots. While Mosaic plots allow display of association rules
with two items in the antecedent, Double Decker plots enable visualization of
association rules with more items in the antecedent. The interestingness mea-
sure of “differences of confidence” can be directly seen in Double Decker plots.
Discovering intersection and sequential structures are also discussed.
Kopanakis and Theodoulidis [17] present several visualization schemes for
displaying and exploring association rules, including bar charts, grid form mod-
els, and ||-coords. In their extensive work they also discuss a similarity based
approach for the layout of multiple association rules on the screen.
Two popular approaches for visualizing association rules are summarized in
[23]: The first, matrix based approach, maps items and itemsets in the antecedent
4. A Framework for Visualizing Association Mining Results 3
and consequent to the X and Y axes respectively. Wong et al. [23] bring an
alternative to this approach by mapping rules -instead of items- to the X axis.
In the second, directed graph approach, the items and rules are mapped to
nodes and edges of a directed graph respectively. Our framework departs from
the second approach since we map both the items and the rules to nodes.
3 Proposed Framework
We propose a graph-based framework to visualize and interpret the results of
well-known association mining algorithms as directed graphs. In our visualiza-
tions, the items, the itemsets, and the association rules are all represented as
nodes. Edges represent the links between the items and the itemsets or associa-
tions.
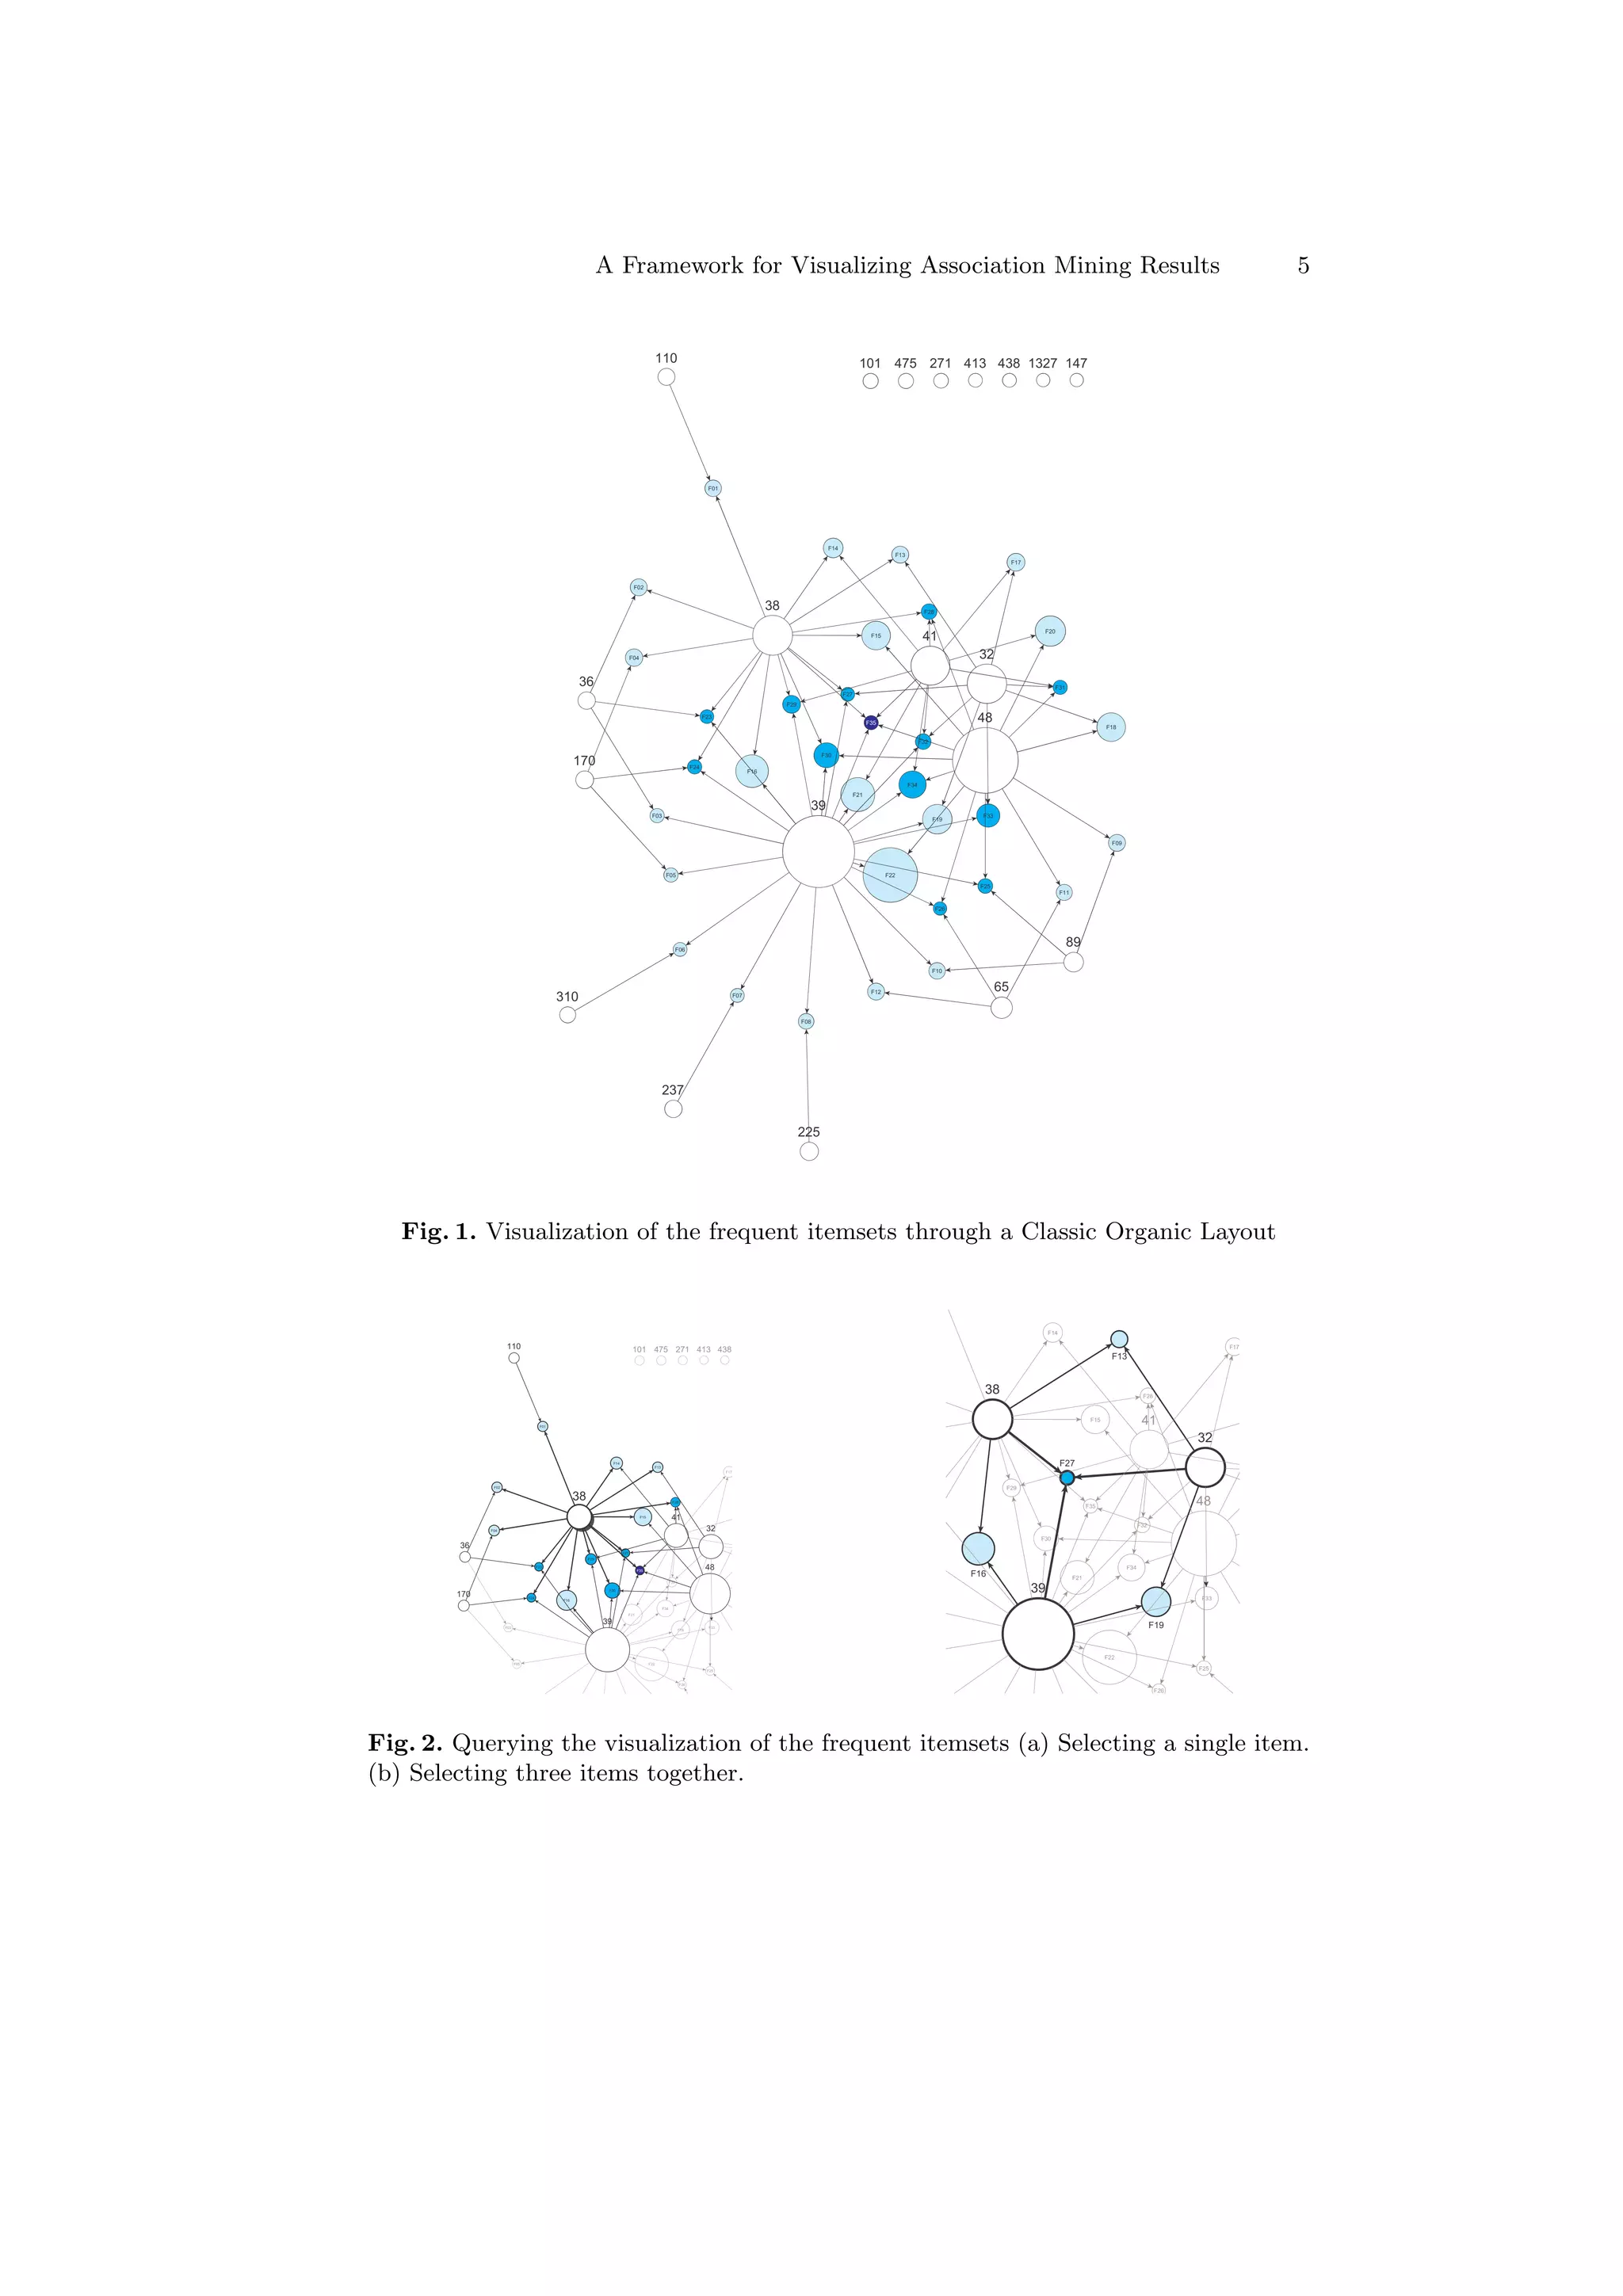
In visualizing frequent itemsets (Figure 1) the nodes that represent the items
are shown with no color, whereas the nodes that represent the itemsets are col-
ored reflecting the cardinality of the itemsets. For example, in our case study the
lightest shade of blue denotes an itemset with two items and the darkest shade
of blue denotes an itemset with four items. The sizes (the areas) of the nodes
show the support levels. The directed edges symbolize which items constitute a
given frequent itemset.
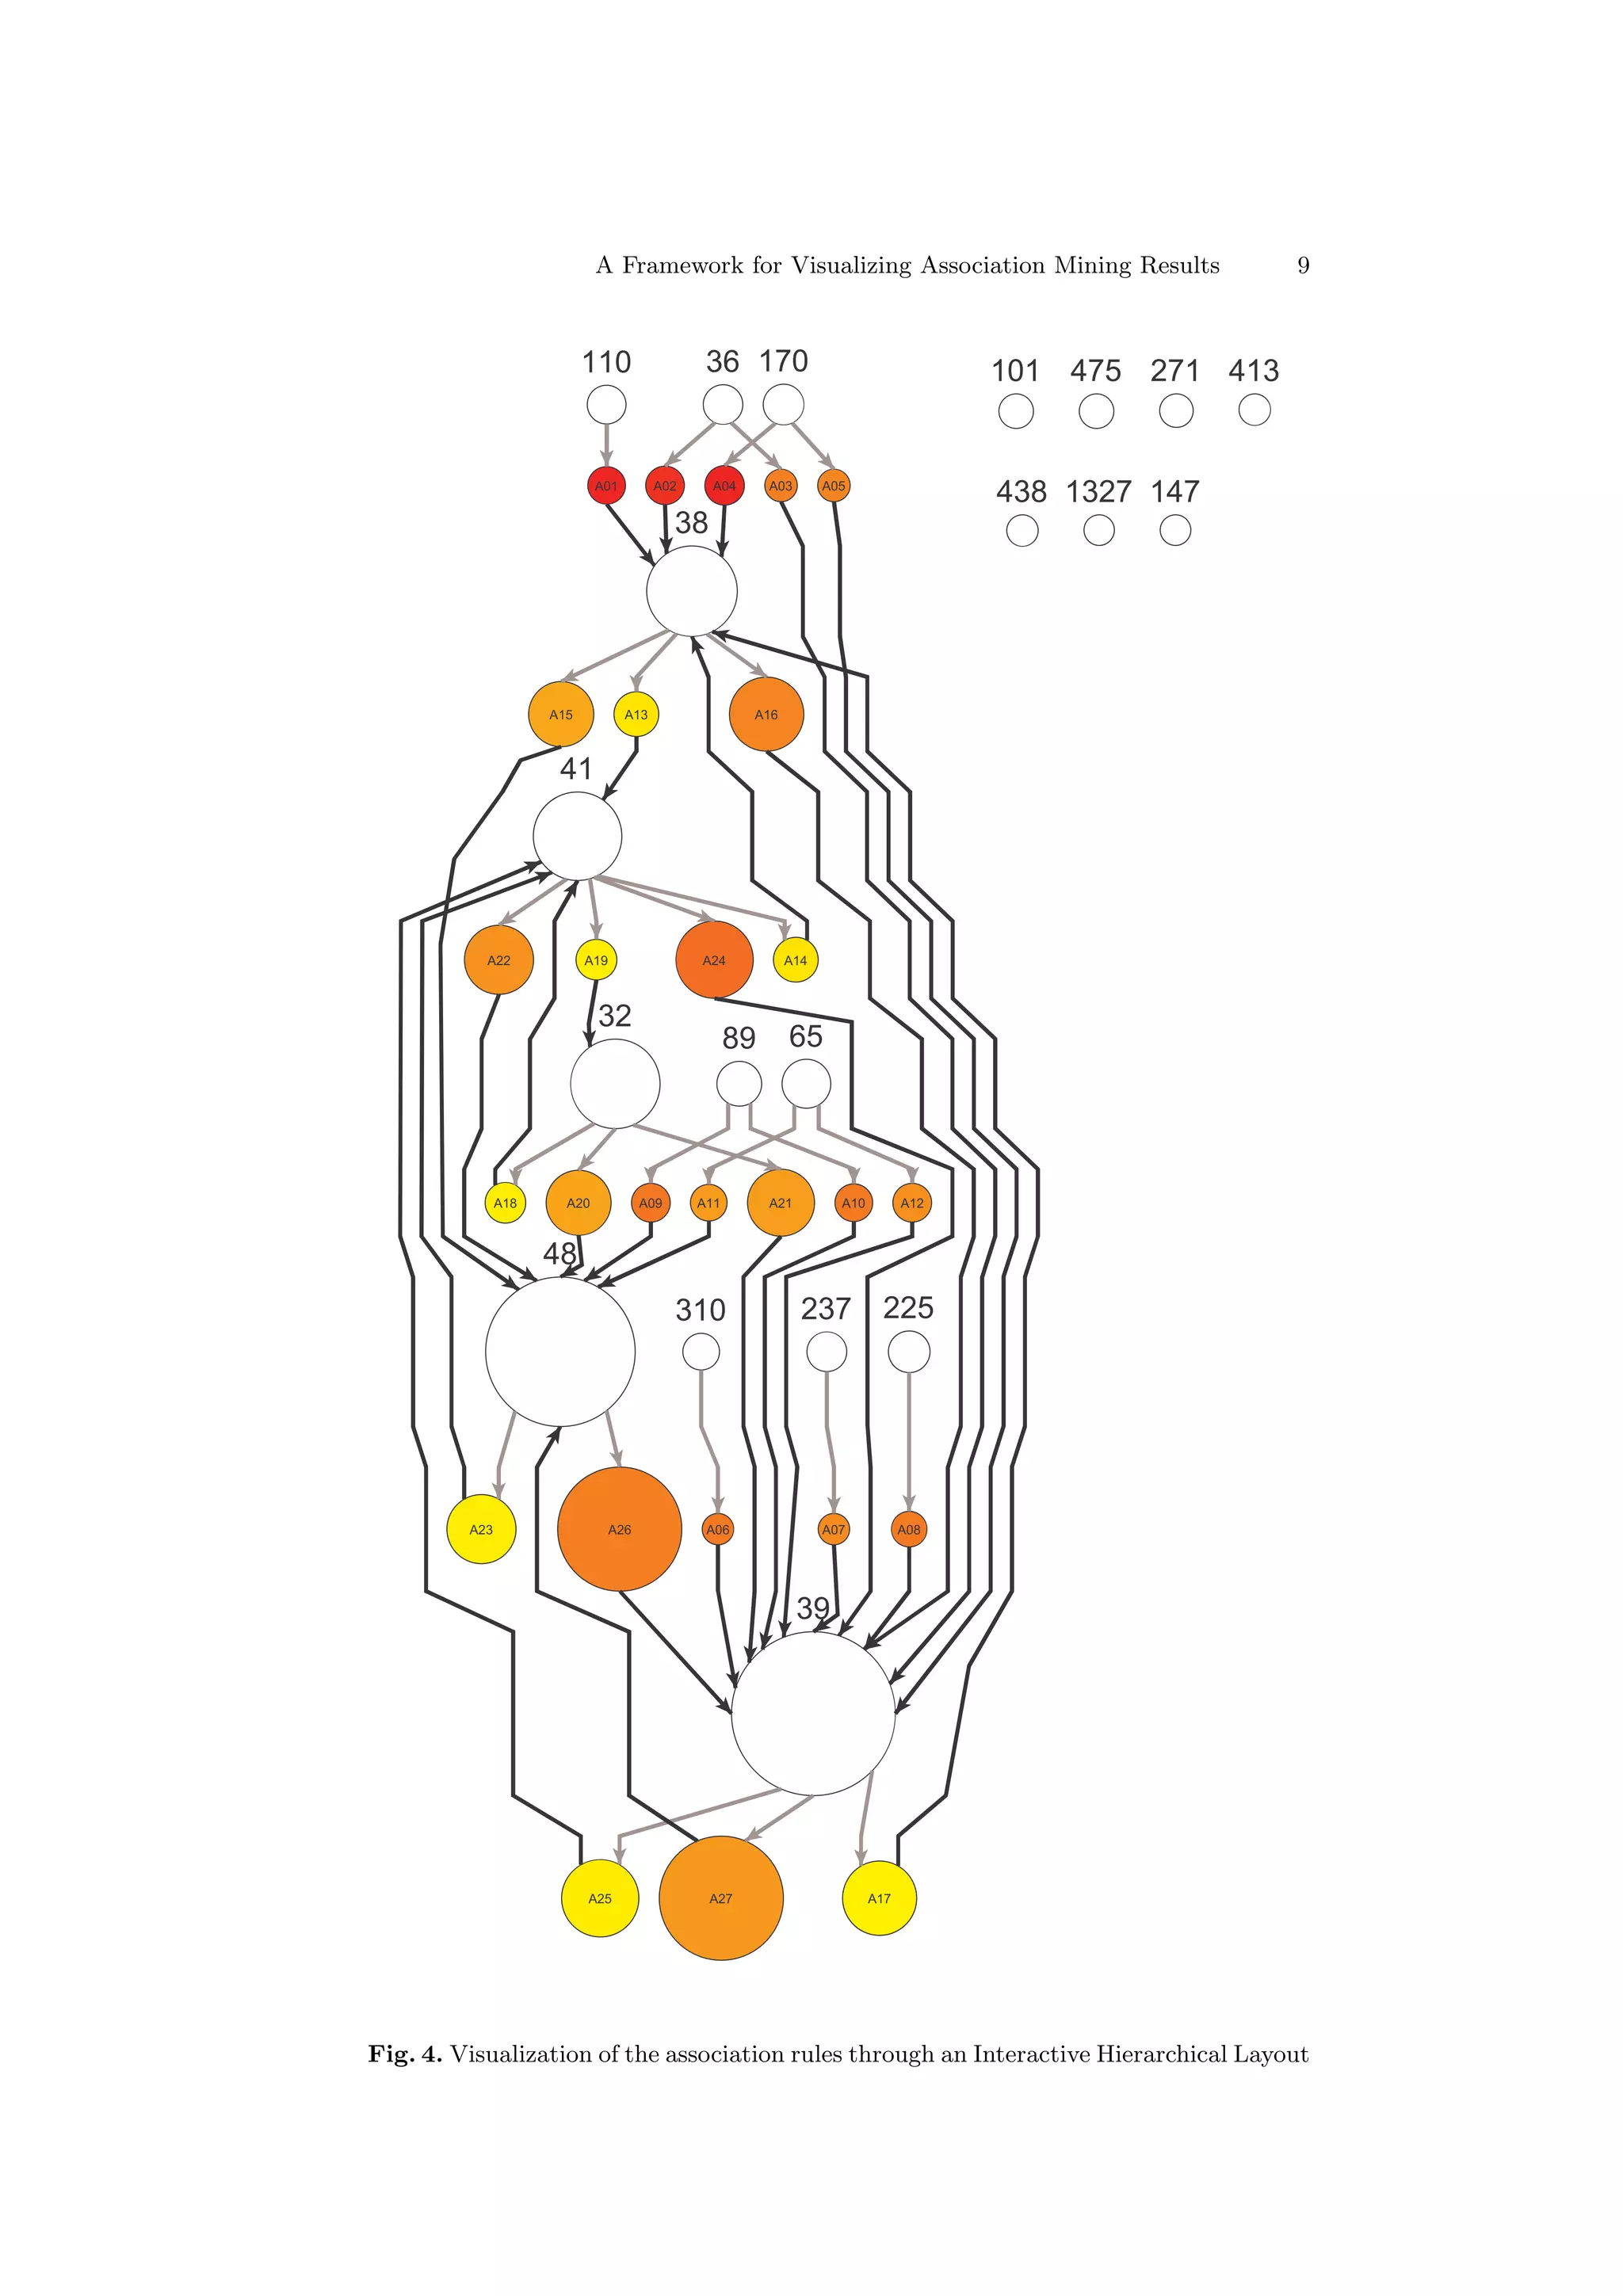
In visualizing association rules (Figure 4), the items are again represented by
nodes without coloring, and the rules are shown by colored nodes. The node sizes
(the areas) again show the support levels, but this time the node colors show the
confidence levels. In our case study, the confidence levels are shown in a linearly
mapped yellow-red color spectrum with the yellow representing the lowest and
the red representing the highest confidence levels. The directed edges are color-
coded depending on whether they are incoming or outgoing edges. Incoming
edges of the rule nodes are shown in grey and outgoing are shown in black. For
example, in Figure 4 the association rule A01 is indeed (Item 110 ⇒ Item 38).
The main idea in our framework is to exploit already existing graph drawing
algorithms [3] and software in the information visualization literature [12] for vi-
sualization of association mining results which are generated by already existing
algorithms and software in the data mining literature [11].
4 Steps in Implementing the Framework
To demonstrate our framework we have carried out a case study using a real
word data set from retail industry which we describe in the next section. In this
section, we briefly outline the steps in implementing our framework.
The first step is to run an efficient implementation of the Apriori algorithm:
We have selected to use the application developed by C. Borgelt which is available
on the internet [4] and is well documented.
To generate both the frequent itemsets and association rules, it is required to
run Borgelt’s application twice because this particular application is capable of
5. 4 G¨ rdal Ertek and Ayhan Demiriz
u
generating either the frequent itemsets or the association rules. One important
issue that we paid attention to was using the right options while computing the
support levels of the association rules. The default computation of the support
level in Borgelt’s application is different from the original definition by Agrawal
and Srikant [2]. The option “-o” is included in command line to adhere to the
original definition which we have defined in the Introduction section.
The second step is to translate the results of the Apriori algorithm into a
graph specification. In our case study, we carried out this step by converting the
support and confidence levels to corresponding node diameters and colors in a
spreadsheet.
We then created the graph objects based on the calculated specifications in
the previous step. There are a multitude of tools available on the internet for
graph visualization [19]. We have selected the yEd Graph Editor [24] for drawing
our initial graph and generating visually interpretable graph layouts. yEd im-
plements several types of graph drawing algorithms including those that create
hierarchical, organic, orthogonal, and circular layouts. For interested readers, the
detailed information on the algorithms and explanations of the various settings
can be found under the program’s Help menu.
The final step is to run the available graph layout algorithms and try to
visually discover interesting and actionable insights. Our case study revealed
that different layout algorithms should be selected depending on whether one is
visualizing frequent itemsets or association rules, and on the underlying purpose
of the analysis e.g. catalog design, shelf layout, and promotional pricing.
5 Case Study: Market Basket Analysis
The benchmark data set used in this study is provided at [10] and initially
analyzed in [5] for assortment planning purposes. The data set is composed
of 88,163 transactions and was collected at a Belgian supermarket. There are
16,470 unique items in it. The data set lists only the composition of transactions;
different visits by the same customer cannot be identified and the monetary value
of the transactions are omitted.
In this section, we present our findings through visual analysis of frequent
itemsets and association rules. Frequent itemset graphs generated by yEd pro-
vided us with guidelines for catalog design and supermarket shelf design. Asso-
ciation rule graph supplied us with inherent relationships between the items and
enabled development of promotional pricing strategies.
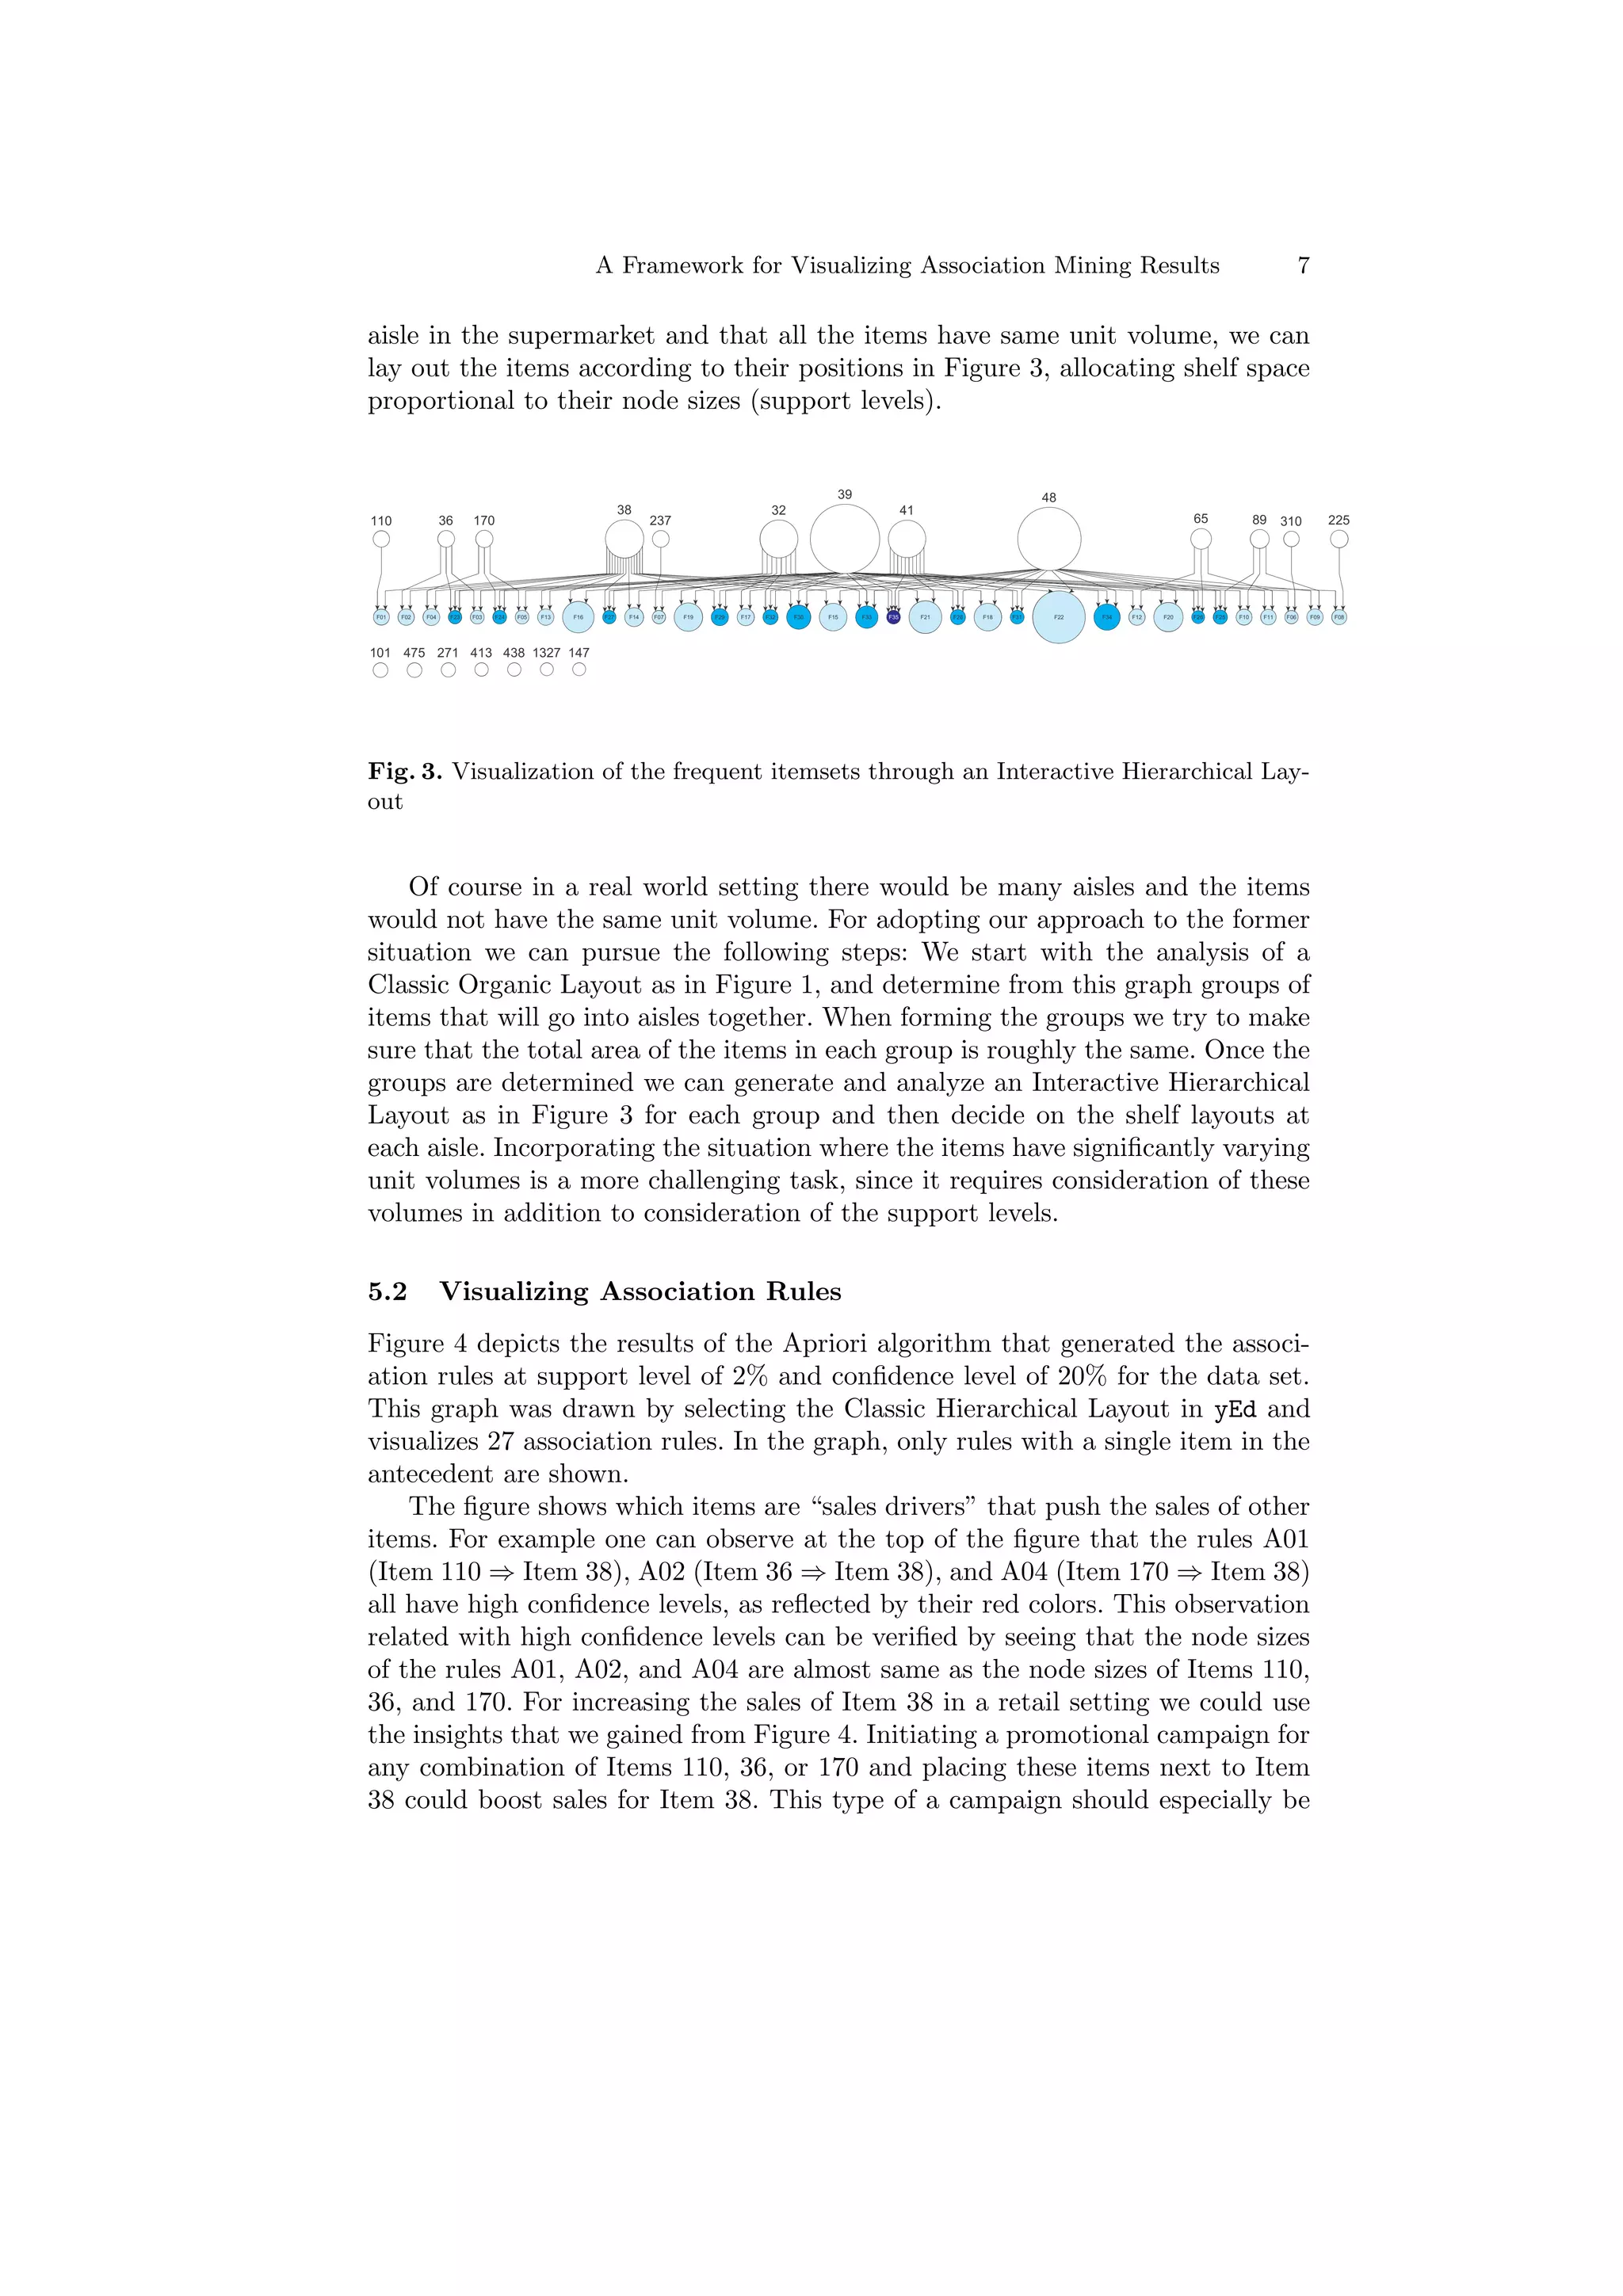
5.1 Visualizing Frequent Itemsets
Figure 1 depicts the results of the Apriori algorithm that generated the frequent
itemsets at support level of 2% for the data set. This graph was drawn by
selecting the Classic Organic Layout in yEd. Items that belong to similar frequent
itemsets and have high support levels are placed in close proximity of each other.
From Figure 1, one can easily notice the Items 39, 48, 32, 41, and 38 have very
6. A Framework for Visualizing Association Mining Results 5
)
)
)
)
)
)
)
)
)
)
)
)
)
)
)
)
)
)
)
)
)
) )
)
)
) )
)
)
)
)
)
)
)
)
Fig. 1. Visualization of the frequent itemsets through a Classic Organic Layout
)
)
)
)
)
)
)
)
)
)
) )
)
)
)
)
)
)
)
)
)
)
)
) )
)
)
)
) )
)
)
)
) )
)
)
) )
)
)
)
)
Fig. 2. Querying the visualization of the frequent itemsets (a) Selecting a single item.
(b) Selecting three items together.
7. 6 G¨ rdal Ertek and Ayhan Demiriz
u
high support levels, and form frequent itemsets (with up to four elements) among
themselves. On the upper corner of the figure, there is a set of items which meet
the minimum support level condition, but have no significant associations with
any other item.
Besides identifying the most significant and interdependent items, one can
also see items that are independent from all but one of the items. For example,
Items 310, 237, and 225 are independent from all items but Item 39. This phe-
nomenon enables us to visually cluster (group) the items into sets that are fairly
independent of each other. In the context of retailing, catalog design requires
selecting sets of items that would be displayed on each page of a catalog. From
Figure 1, one can easily determine that Items 310, 237, and 225 could be on the
same catalog page as Item 39. One might suggest putting Items 39, 48, 32, 41,
and 38 on the same page since these form frequent itemsets with high confidence
levels. However, this would result in a catalog with only one page of popular
items and many pages of much less popular items. We suggest that the popu-
lar items be placed on different pages so that they serve as attractors, drawing
attention to less popular items related to them.
Another type of insight that can be derived from Figure 1 is the identifica-
tion of items which form frequent itemsets with the same item(s) but do not
form any frequent itemsets with each other. For example, Items 65 and 89 each
independently form frequent itemsets with Items 39 and 48, but do not form
frequent itemsets with one another. These items may be substitute items and
their relationship deserves further investigation.
The frequent itemset visualization can be enhanced by incorporating inter-
active visual querying capabilities. One such capability could be that once an
item is selected, the items and the frequent itemsets associated with it are high-
lighted. This concept is illustrated in Figure 2 (a) where Item 38 is assumed
to be selected. It can be seen that Item 38 plays a very influential role since it
forms frequent itemsets with seven of the 13 items. When two or more items are
selected, only the frequent itemsets associated with all of them could be high-
lighted. Thus selecting more than one item could serve as a query with an AND
operator. This concept is illustrated in Figure 2 (b) where Items 39, 32 and 38
are assumed to be selected. One can notice in this figure that even though all
the three items have high support levels each (as reflected by their large sizes)
the frequent itemset F27 (in the middle) that consists of all the three items has
a very low support level. When analyzed in more detail it can be seen that this
is mainly due to the low support level of the frequent itemset F13 which consists
of Items 32 and 38. This suggests that the association between Items 32 and 38
is significantly low, and these items can be placed into separate clusters.
When experimenting with various graph layout algorithms within yEd we
found the Interactive Hierarchical Layout particularly helpful. The obtained vi-
sualization is given in Figure 3, where items are sorted such that the edges have
minimal crossings and related items are positioned in close proximity to each
other. This visualization can be used directly in planning the supermarket shelf
layouts. For example assuming that we would place these items into a single
8. A Framework for Visualizing Association Mining Results 7
aisle in the supermarket and that all the items have same unit volume, we can
lay out the items according to their positions in Figure 3, allocating shelf space
proportional to their node sizes (support levels).
) ) ) ) ) ) ) ) ) ) ) ) ) ) ) ) ) ) ) ) ) ) ) ) ) ) ) ) ) ) ) ) ) ) )
Fig. 3. Visualization of the frequent itemsets through an Interactive Hierarchical Lay-
out
Of course in a real world setting there would be many aisles and the items
would not have the same unit volume. For adopting our approach to the former
situation we can pursue the following steps: We start with the analysis of a
Classic Organic Layout as in Figure 1, and determine from this graph groups of
items that will go into aisles together. When forming the groups we try to make
sure that the total area of the items in each group is roughly the same. Once the
groups are determined we can generate and analyze an Interactive Hierarchical
Layout as in Figure 3 for each group and then decide on the shelf layouts at
each aisle. Incorporating the situation where the items have significantly varying
unit volumes is a more challenging task, since it requires consideration of these
volumes in addition to consideration of the support levels.
5.2 Visualizing Association Rules
Figure 4 depicts the results of the Apriori algorithm that generated the associ-
ation rules at support level of 2% and confidence level of 20% for the data set.
This graph was drawn by selecting the Classic Hierarchical Layout in yEd and
visualizes 27 association rules. In the graph, only rules with a single item in the
antecedent are shown.
The figure shows which items are “sales drivers” that push the sales of other
items. For example one can observe at the top of the figure that the rules A01
(Item 110 ⇒ Item 38), A02 (Item 36 ⇒ Item 38), and A04 (Item 170 ⇒ Item 38)
all have high confidence levels, as reflected by their red colors. This observation
related with high confidence levels can be verified by seeing that the node sizes
of the rules A01, A02, and A04 are almost same as the node sizes of Items 110,
36, and 170. For increasing the sales of Item 38 in a retail setting we could use
the insights that we gained from Figure 4. Initiating a promotional campaign for
any combination of Items 110, 36, or 170 and placing these items next to Item
38 could boost sales for Item 38. This type of a campaign should especially be
9. 8 G¨ rdal Ertek and Ayhan Demiriz
u
considered if the unit profits of the driver items (which reside in the antecedent
of the association rule) are lower than the unit profit of the item whose sale is
to be boosted (which resides in the antecedent of the association rule).
We can also identify Items 32, 89, 65, 310, 237, and 225 as sales drivers since
they have an indegree of zero (except Item 32) and affect sales of “downstream”
items with a high confidence.
6 Conclusions and Future Work
We have introduced a novel framework for knowledge discovery from association
mining results. We demonstrated the applicability of our framework through
a market basket analysis case study where we visualize the frequent itemsets
and binary association rules derived from transactional sales data of a Belgian
supermarket.
Ideally, the steps in our framework should be carried out automatically by a
single integrated program or at least from within a single modelling and analysis
environment that readily communicates with the association mining and graph
visualization software. Such a software does not currently exist.
In the retail industry new products emerge and consumer preferences change
constantly. Thus one would be interested in laying the foundation of an analysis
framework that can fit to the dynamic nature of retailing data. Our framework
can be adapted for analysis of frequent itemsets and association rules over time
by incorporating latest research on evolving graphs [9].
Another avenue of future research is testing other graph visualization algo-
rithms and software [19] and investigating whether new insights can be discov-
ered by their application. For example, Pajek graph visualization software [20]
enables the mapping of attributes to line thickness, which is not possible in yEd.
The visualizations that we presented in this paper were all 2D. It is an inter-
esting research question to determine whether exploring association rules in 3D
can enable new styles of analysis and new types of insights.
As a final word, we conclude by remarking that visualization of association
mining results in particular, and data mining results in general is a promising
area of future research. Educational, research, government and business institu-
tions can benefit significantly from the symbiosis of data mining and information
visualization disciplines.
References
1. http://www.advizorsolutions.com
2. Agrawal, R., Srikant, R.: Fast algorithms for mining association rules. Proceedings
of the 20th VLDB Conference,Santiago, Chile. (1994) 487–499
3. Battista, G. D., Eades, P., Tamassia, R., Tollis, I. G.: Graph Drawing: Algorithms
for the Visualization of Graphs. Prentice Hall PTR.(1998)
4. http://fuzzy.cs.uni-magdeburg.de/∼borgelt/apriori.html
10. A Framework for Visualizing Association Mining Results 9
$ $ $ $ $
$ $ $
$ $ $ $
$ $ $ $ $ $ $
$ $ $ $ $
$ $ $
Fig. 4. Visualization of the association rules through an Interactive Hierarchical Layout
11. 10 G¨rdal Ertek and Ayhan Demiriz
u
5. Brijs, T., Swinnen, G., Vanhoof, K., Wets, G.: The use of association rules for
product assortment decisions: a case study. Proceedings of the Fifth International
Conference on Knowledge Discovery and Data Mining, San Diego (USA), (1999)
254–260.
6. de Oliveira, M. C. F., Levkowitz, H.: From visual data exploration to visual data
mining: a survey. IEEE Transactions on Visualization and Computer Graphics 9,
no.3 (2003) 378–394
7. Demiriz, A.: Enhancing product recommender systems on sparse binary data. Jour-
nal of Data Mining and Knowledge Discovery. 9, no.2 (2004) 378–394
8. Eick, S. G.: Visual discovery and analysis. IEEE Transactions on Visualization and
Computer Graphics 6, no.1 (2000) 44–58
9. Erten, D. A., Harding, P. J., Kobourov, S. G., Wampler, K., Yee, G.: GraphAEL:
Graph animations with evolving layouts. Lecture Notes in Computer Science. 2913,
(2004) 98–110
10. http://fimi.cs.helsinki.fi/data/
11. Han, J., Kamber, M.: Data Mining Concepts and Techniques. Morgan Kaufman
Publishers. (2001)
12. Herman, I., Melan¸on, G., Marshall, M. S.: Graph visualization and navigation
c
in information visualization: A survey. IEEE Transactions on Visualization and
Computer Graphics. 6, no.1 (2000) 24–43
13. Hoffman, P. E., Grinstein, G. G.: A survey of visualizations for high-dimensional
data mining. Chapter 2, Information visualization in data mining and knowledge
discovery, Eds: Fayyad, U., Grinstein, G. G., Wierse, A. (2002) 47–82
14. Hofmann, H., Siebes, A. P. J. M., Wilhelm, A. F. X.: Visualizing association rules
with interactive mosaic plots. Proceedings of the Sixth International Conference on
Knowledge Discovery and Data Mining. (2000) 227–235
15. http://www-306.ibm.com/software/data/iminer/visualization/
16. Keim, D. A.: Information visualization and visual data mining. IEEE Transactions
on Visualization and Computer Graphics. 8, no.1 (2002) 1–8
17. Kopanakis, I., Theodoulidis, B.: Visual data mining modeling techniques for the
visualization of mining outcomes. Journal of Visual Languages and Computing. 14
(2003) 543–589
18. http://www.miner3d.com/
19. http://www.netvis.org/resources.php
20. http://vlado.fmf.uni-lj.si/pub/networks/pajek/
21. http://www.spotfire.com/
22. Tan, P., Kumar, V., Srivastava, J.: Selecting the right interestingness measure for
association patterns. Proceedings of SIGKDD. (2002) 32–41
23. Wong, P. C., Whitney, P., Thomas, J.: Visualizing association rules for text mining.
Proceedings of the 1999 IEEE Symposium on Information Visualization. (1999)
24. http://www.yworks.com/