Downloaded 12 times
![G. Sudhakar Babu, Dr. K. Chandra Sekhara Reddy / International Journal of Engineering
Research and Applications (IJERA) ISSN: 2248-9622 www.ijera.com
Vol. 3, Issue 4, Jul-Aug 2013, pp.870-876
870 | P a g e
Automatic License Plate Recognition System
G. Sudhakar Babu1
, Dr. K. Chandra Sekhara Reddy2
Abstract:
Automatic license plate recognition system
(ALPR) is one of the most important of the
intelligent transportation system (ITS). A number of
techniques have been used for vehicle plate character
recognition. The proposed system uses image
processing and neural network character recognition
and pattern matching of character as two character
recognition techniques. In this approach multilayer
feed forward back propagation algorithm is used.
The performance of the proposed algorithm has been
tested on several vehicle plates and provides very
satisfactory results.
Keywords: Automatic license plate recognition
system (ALPR), intelligent transportation system
(ITS).
I. Introduction:
Vehicle license plate recognition (VLPR) is
an image processing system whereby it is used to
recognize the vehicles by identifying the license plate.
It is basically used for traffic and security purposes.
The cycle will start when the vehicle steps over the
detector. It will activate a signal to the vehicle license
plate system of the presence of the vehicle. The
illumination will be activated and images of the front
picture of the vehicle will be taken. The system will
read the information pixels of the vehicle and run the
recognition process and system will apply error back-
propagation algorithm to analyze the vehicle image.
Besides analyzing, the images will be enhanced,
locating the vehicle plate position and extract the
characters from the vehicle plate. The characters will be
recognized by using neural network. Then system will
try to match the recognized vehicle plate number with
the car plate database. If access granted, the gantry will
open and allowed the vehicle. Previously different
neural models were designed to filter the noisy sign.
So, many researches of car identification have been
approached by car license plate extracting and
recognition, some of the related work is as follows.
Lotufo et. al [2] proposed automatic number-plate
recognition using optical character recognition
techniques. Johnson and Bird [3] proposed Knowledge-
guided boundary following and template matching for
automatic vehicle identification. Fahmy [4] proposed
bidirectional associative memories (BAM) neural
network for number plate reading. It’s appropriate for
small numbers of patterns. Nijhuis et. al [5] proposed
fuzzy logic and neural networks for car LPR. This
method used fuzzy logic for segmentation and discrete-
time cellular neural networks (DTCNN’S) for feature
extraction. Choi [6] and Kim [7] proposed the method
based on vertical edge using Hough transform (HT) for
extracting the license plate. E.R.Lee et. al [8] used
neural network for color extraction and a template
matching to recognize characters. S.K. Kim [9] used a
genetic algorithm based segmentation to extract the
plate region. Tavsanoglu et. al [10] proposed an
approach to form orientation map as recognition feature
using a Gabor filter for recognizing characters.
Yoshimura et. al [11] used Gabor jets projection to
form a feature vector for recognizing low resolution
gray-scale character. Hontani et. al. [12] proposed a
method for extracting characters without prior
knowledge of their position and size in the image. Park
et. al. [13] devised a method to extract Korean license
plate depending on the color of the plate. H.J. Kim et.
al [14] proposed a method of extracting plate region
based on colour image segmentation. In this study, the
proposed approach is based on extraction of plate
region, segmentation of plate characters and
recognition of characters.
II. Previous Work:
The license plate recognition process can be
roughly divided into three steps as shown in Figure1,
Plate Localization, Character Segmentation and
Character Recognition. Each step will be carried out
by an independent module. An input image
submitted to the system is first examined and
processed to obtain the vehicle license plate region,
then the plate region is process to locate each
individual digit and character, these are then
submitted to the final Optical Character Recognition
(OCR) process to determine the identification.
Figure1: Recognition steps
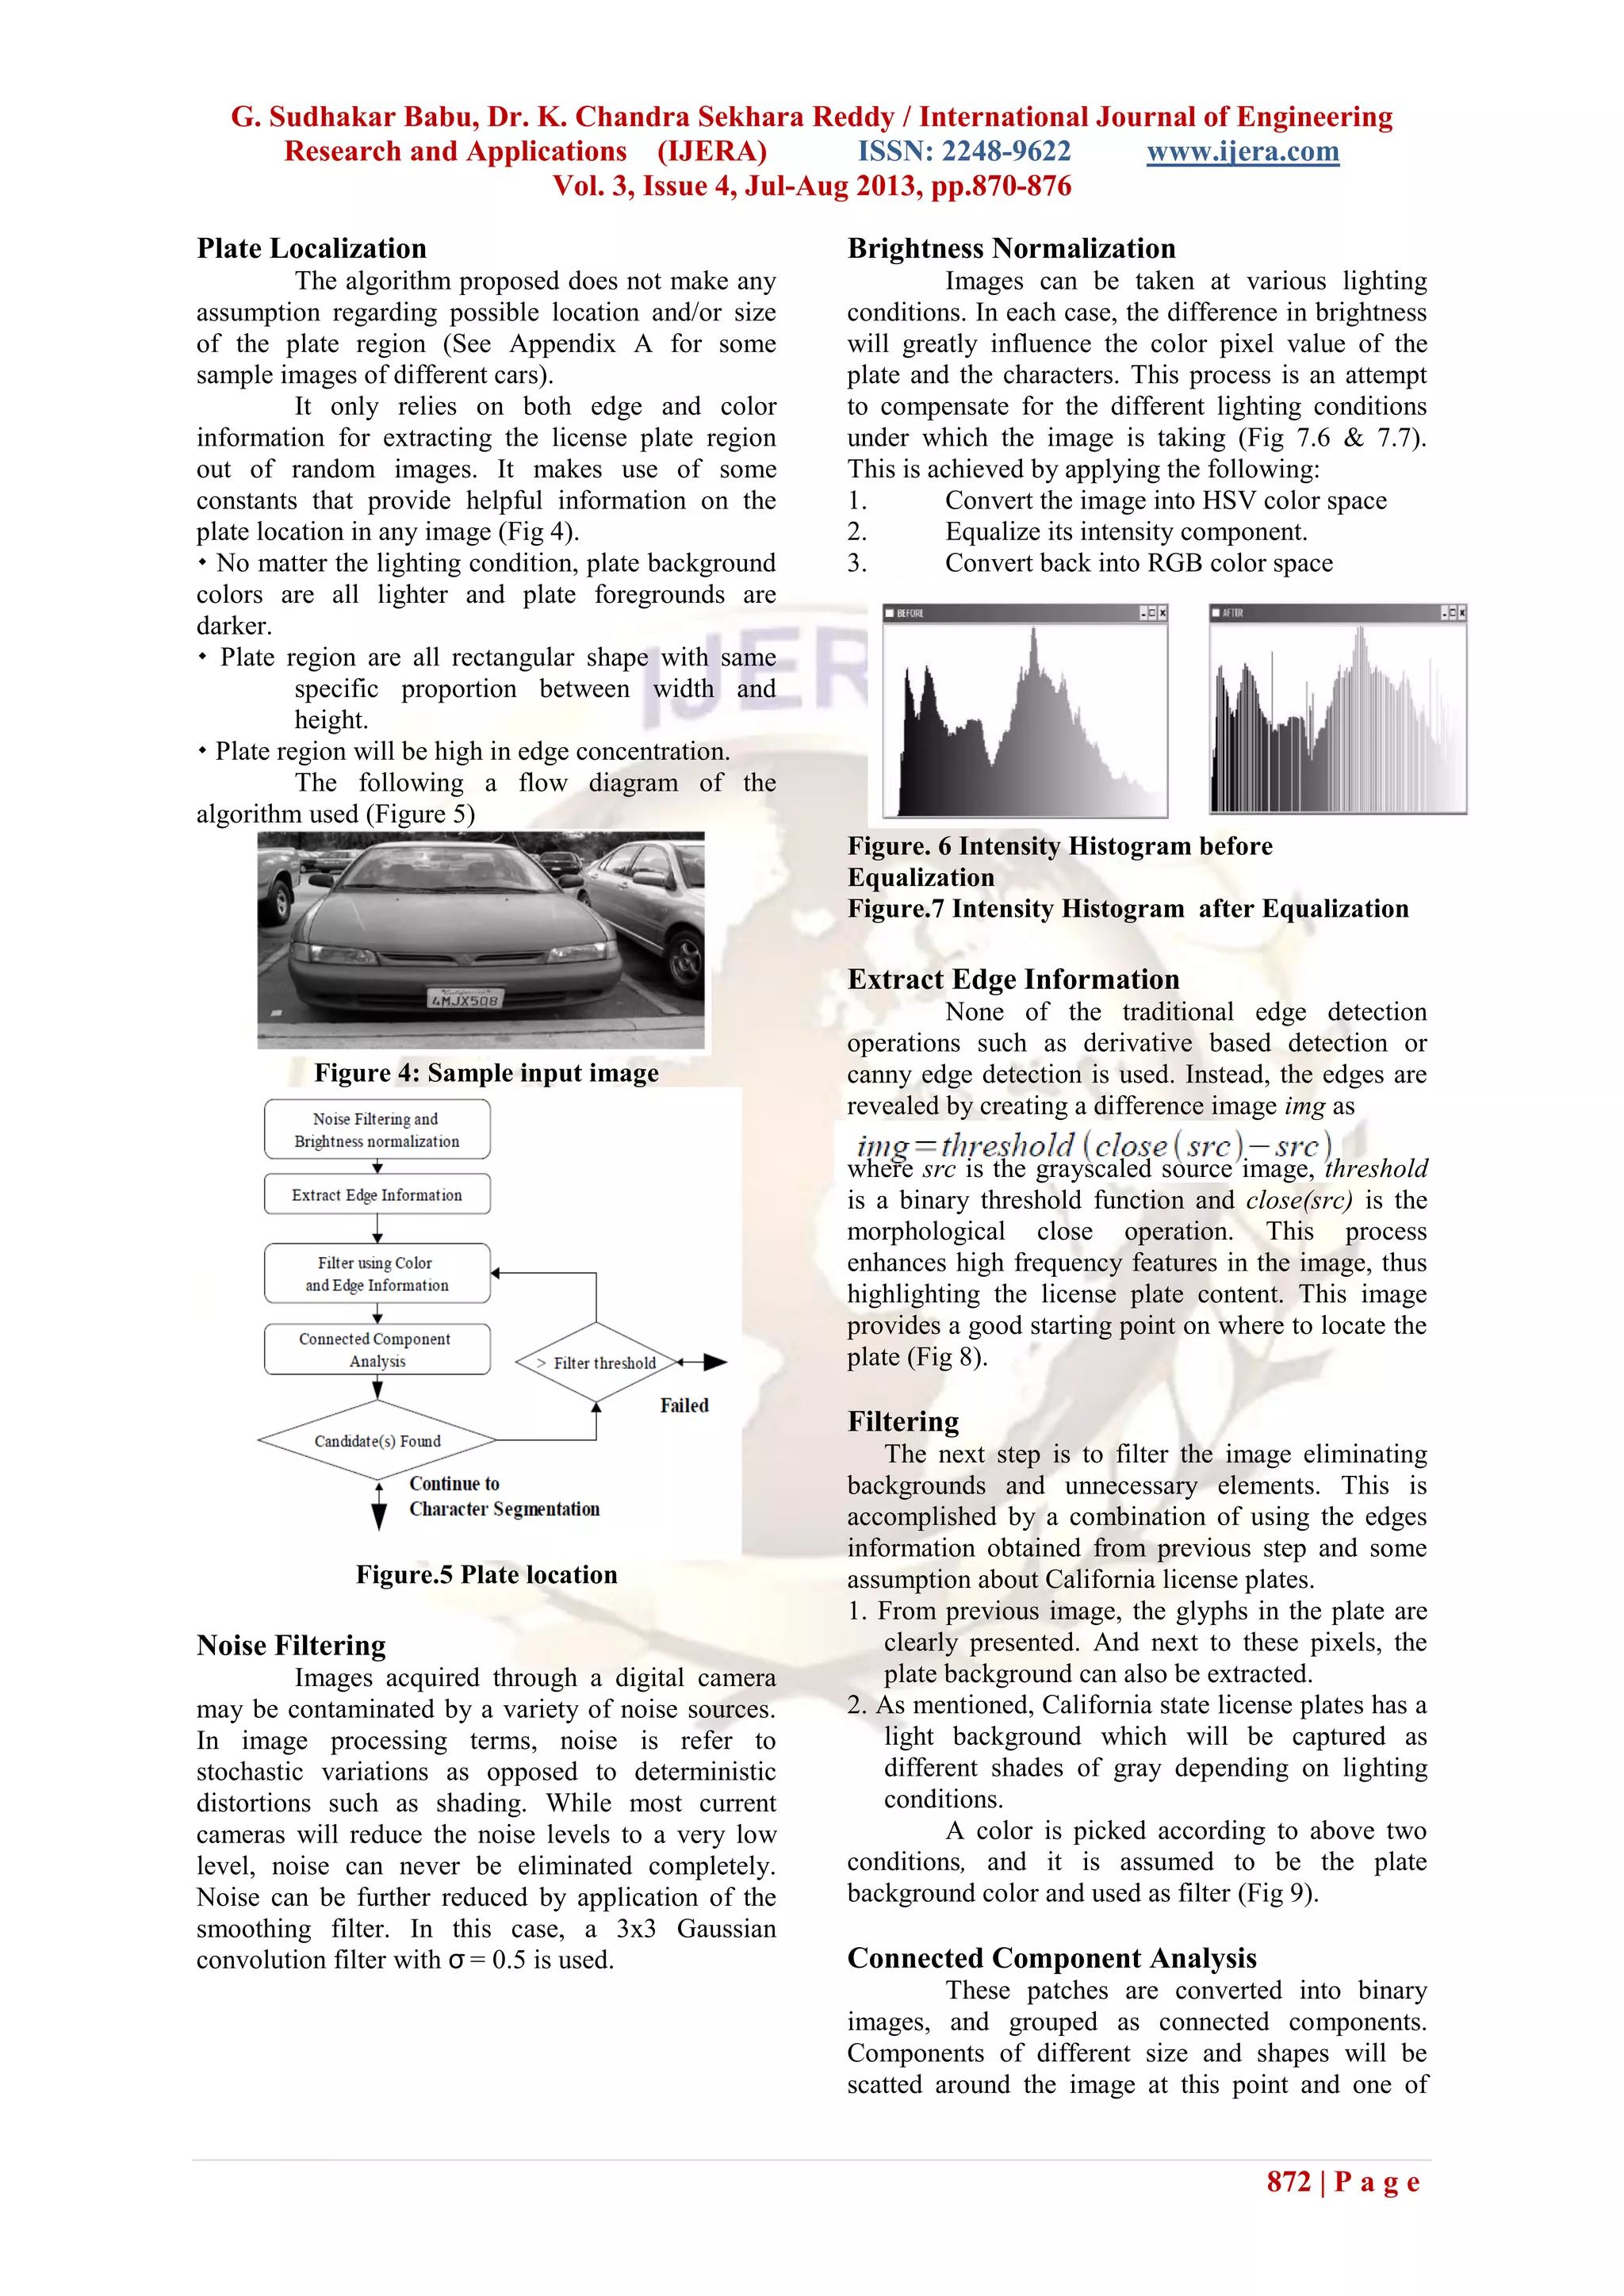
III. Plate Localization
This is the process of extracting the license
plate region out of an image. It involves basic image
processing techniques combined with some decision
making based on deterministic threshold. Without
any prior knowledge on how large the plate is, or
where it is located, the entire image must be
inspected and analyzed in order to extract candidate](https://image.slidesharecdn.com/ep34870876-130706050432-phpapp01/75/Ep34870876-1-2048.jpg)
![G. Sudhakar Babu, Dr. K. Chandra Sekhara Reddy / International Journal of Engineering
Research and Applications (IJERA) ISSN: 2248-9622 www.ijera.com
Vol. 3, Issue 4, Jul-Aug 2013, pp.870-876
871 | P a g e
regions. There are many different approaches on
how to accomplish this, some algorithm assume that
the plate region location of the image should not
varies by much [1], and it should be adjusted by
using sensors [5], thus limiting the search range for
fast results. Some techniques make use of only edge
information for plate location [3][8], and there are
also very complex algorithms such as vector
quantization [6], fuzzy clustering [7] and fuzzy
logic[9].
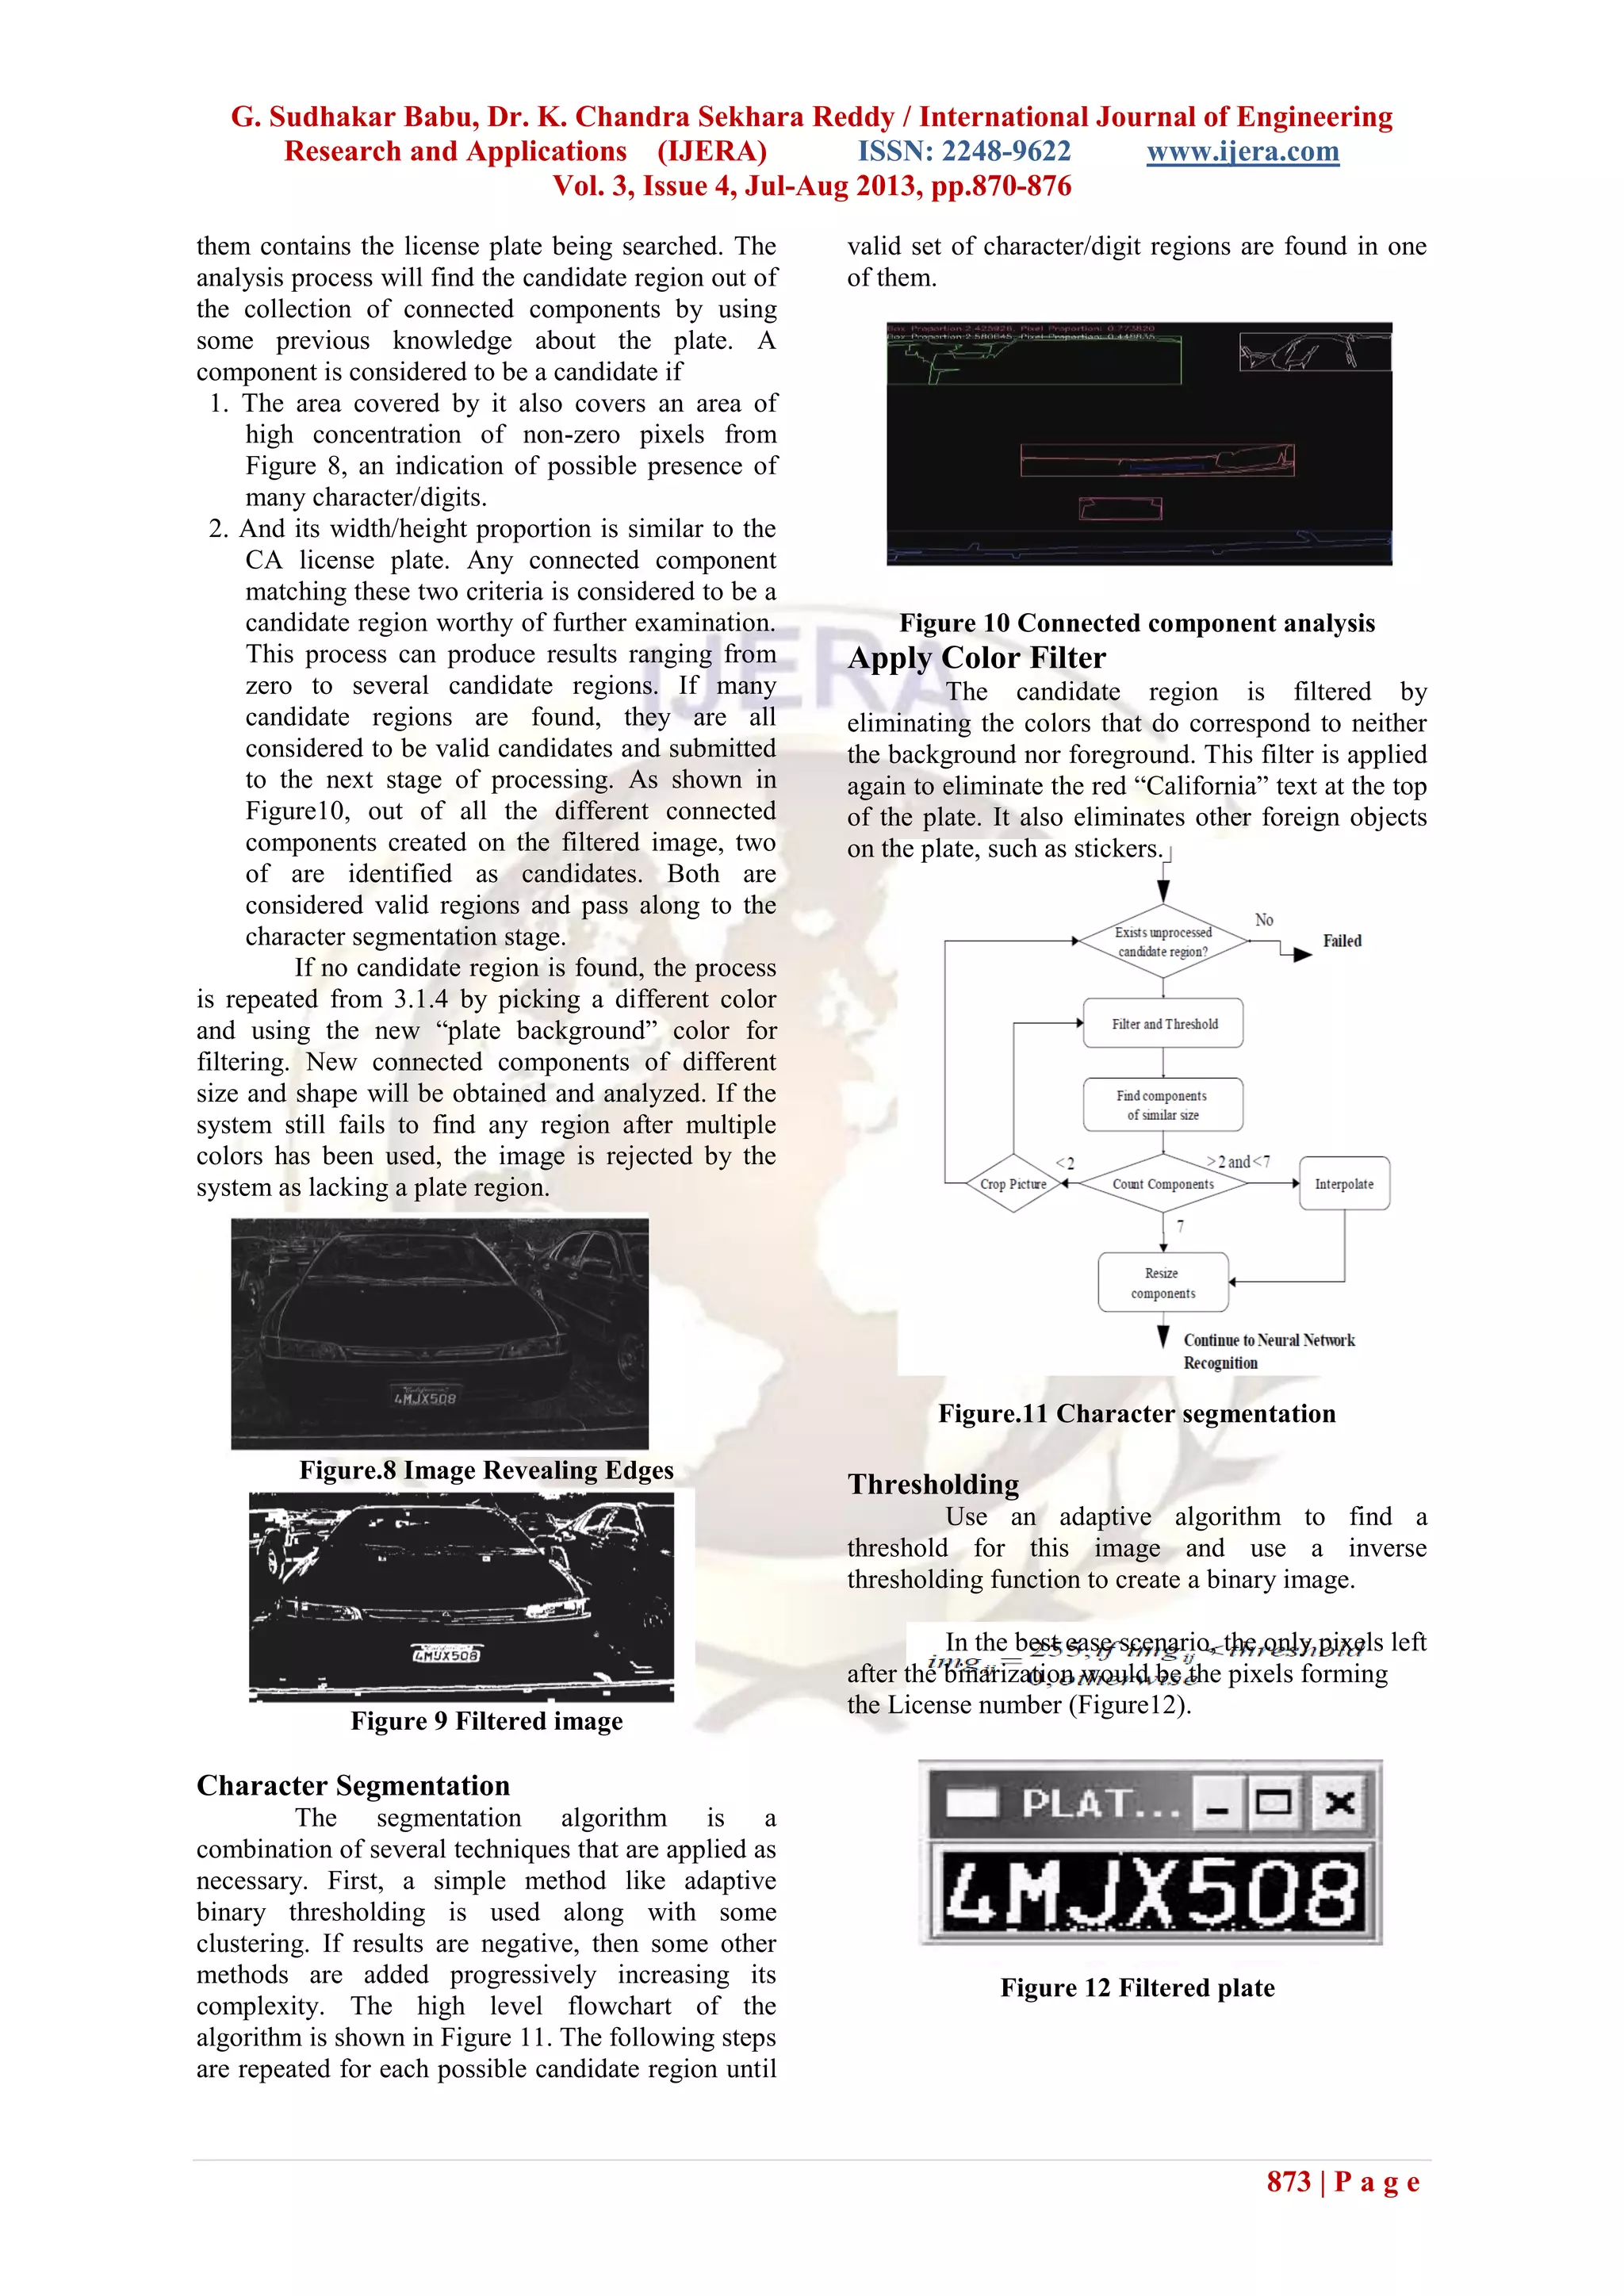
Character Segmentation
Once the candidate region is detected from
the input image, the next stage is to segment the
plate to extract individual digit/character for
recognition. This process is highly dependent on the
format of the plate being processed. Because
different country and regions have different plate
shapes and sizes, the color used as plate background
and foreground are totally different and their content
varies both in length and combination of digit and
characters. For example, the Chinese license plates
analyzed in [8] have dark background with character
in lighter color, the algorithm used cannot be
directed applied to the plates in Alberta, Canada [4],
since those are completely opposite. Some
techniques do exist for specific cases and can be
adapted to other cases, such as combination of
vertical and horizontal projection to determined
glyph location [4], or by using an adaptive clustering
technique by finding white spaces between columns
of higher density of dark pixels [1]. However, these
techniques do not take into account that sometimes
there could be frames that are partially connected to
the plate content. Take as an example Figure 2,
which features a plate that has a frame that is
connected to the lower part of the middle five
glyphs. The use of simple projection or clustering
techniques will not yield adequate results.
Figure 2: Framed plate
Character Recognition
Once each individual digit and/or character
is extracted, it must be identified in some way. This
process is called Optical Character Recognition, and
there are several different solution to this problem.
Two approaches are particularly popular among
many different researches on license plate
recognition. One of the methods is template
matching [5][7]. In this method, a series of slightly
different templates of all glyphs are kept in a
database. Once a image is submitted for recognition,
existing templates are compared to the new image,
and the best fit will determine its identity. This
method requires that the template database be large
enough to cover most glyph variations, and it must
also have an efficient algorithm to process large set
of templates. The other way is by using Artificial
Neural Networks as classifier [1]. The ANN
classifier must be trained before use to recognize all
the different digits, characters and symbols that
require identification. Several other approaches are
also being used, feature analysis is the method used
in [9], which is an analysis of the characters to
distinguish it. And for recognizing a totally different
set of symbols in those plates in Thailand, Hausdorff
Distance technique was the choice [10].
System Architecture:
Each country and region has its own
specifications for their legal vehicle license plates,
and they differ from each other in several aspects.
To begin with, the license plate itself can have
different shape/size, have totally opposite set of
colors for background and foreground [4][8] and it
can be located at different location on the vehicle.
Also, the number of digits or characters will differ,
A region with only a couple of thousands cars only
need to use a plate with 6 or 7 numeric digit, but for
a region with several million cars that configuration
is not nearly enough. This can change the location of
each digit/character on the plate, they can be in a
specific font, on some specific background colors or
not. For a country that does not use Latin characters
as their primary written language, even totally
different set or symbols are needed [10]. These
substantial differences among them make it almost
impossible to create a single algorithm that can be
universally used for all plates. The algorithms
defined in this chapter are designed to recognize
California State license plates as shown in Figure
7.3. The regular California license plate has the
following configuration
The plate background is a single uniform color
with no graphics.
The word “California” appears at the top-center on
the plate in red and italic.
The plate number starts with a digit (0-9), followed
by three English characters (A-Z) and three more
digits (0-9).
All seven digit/characters are sans type font.
The plate background is a light shade of gray while
its characters are of dark bluish color.
Figure 3: California License plate](https://image.slidesharecdn.com/ep34870876-130706050432-phpapp01/75/Ep34870876-2-2048.jpg)
![G. Sudhakar Babu, Dr. K. Chandra Sekhara Reddy / International Journal of Engineering
Research and Applications (IJERA) ISSN: 2248-9622 www.ijera.com
Vol. 3, Issue 4, Jul-Aug 2013, pp.870-876
874 | P a g e
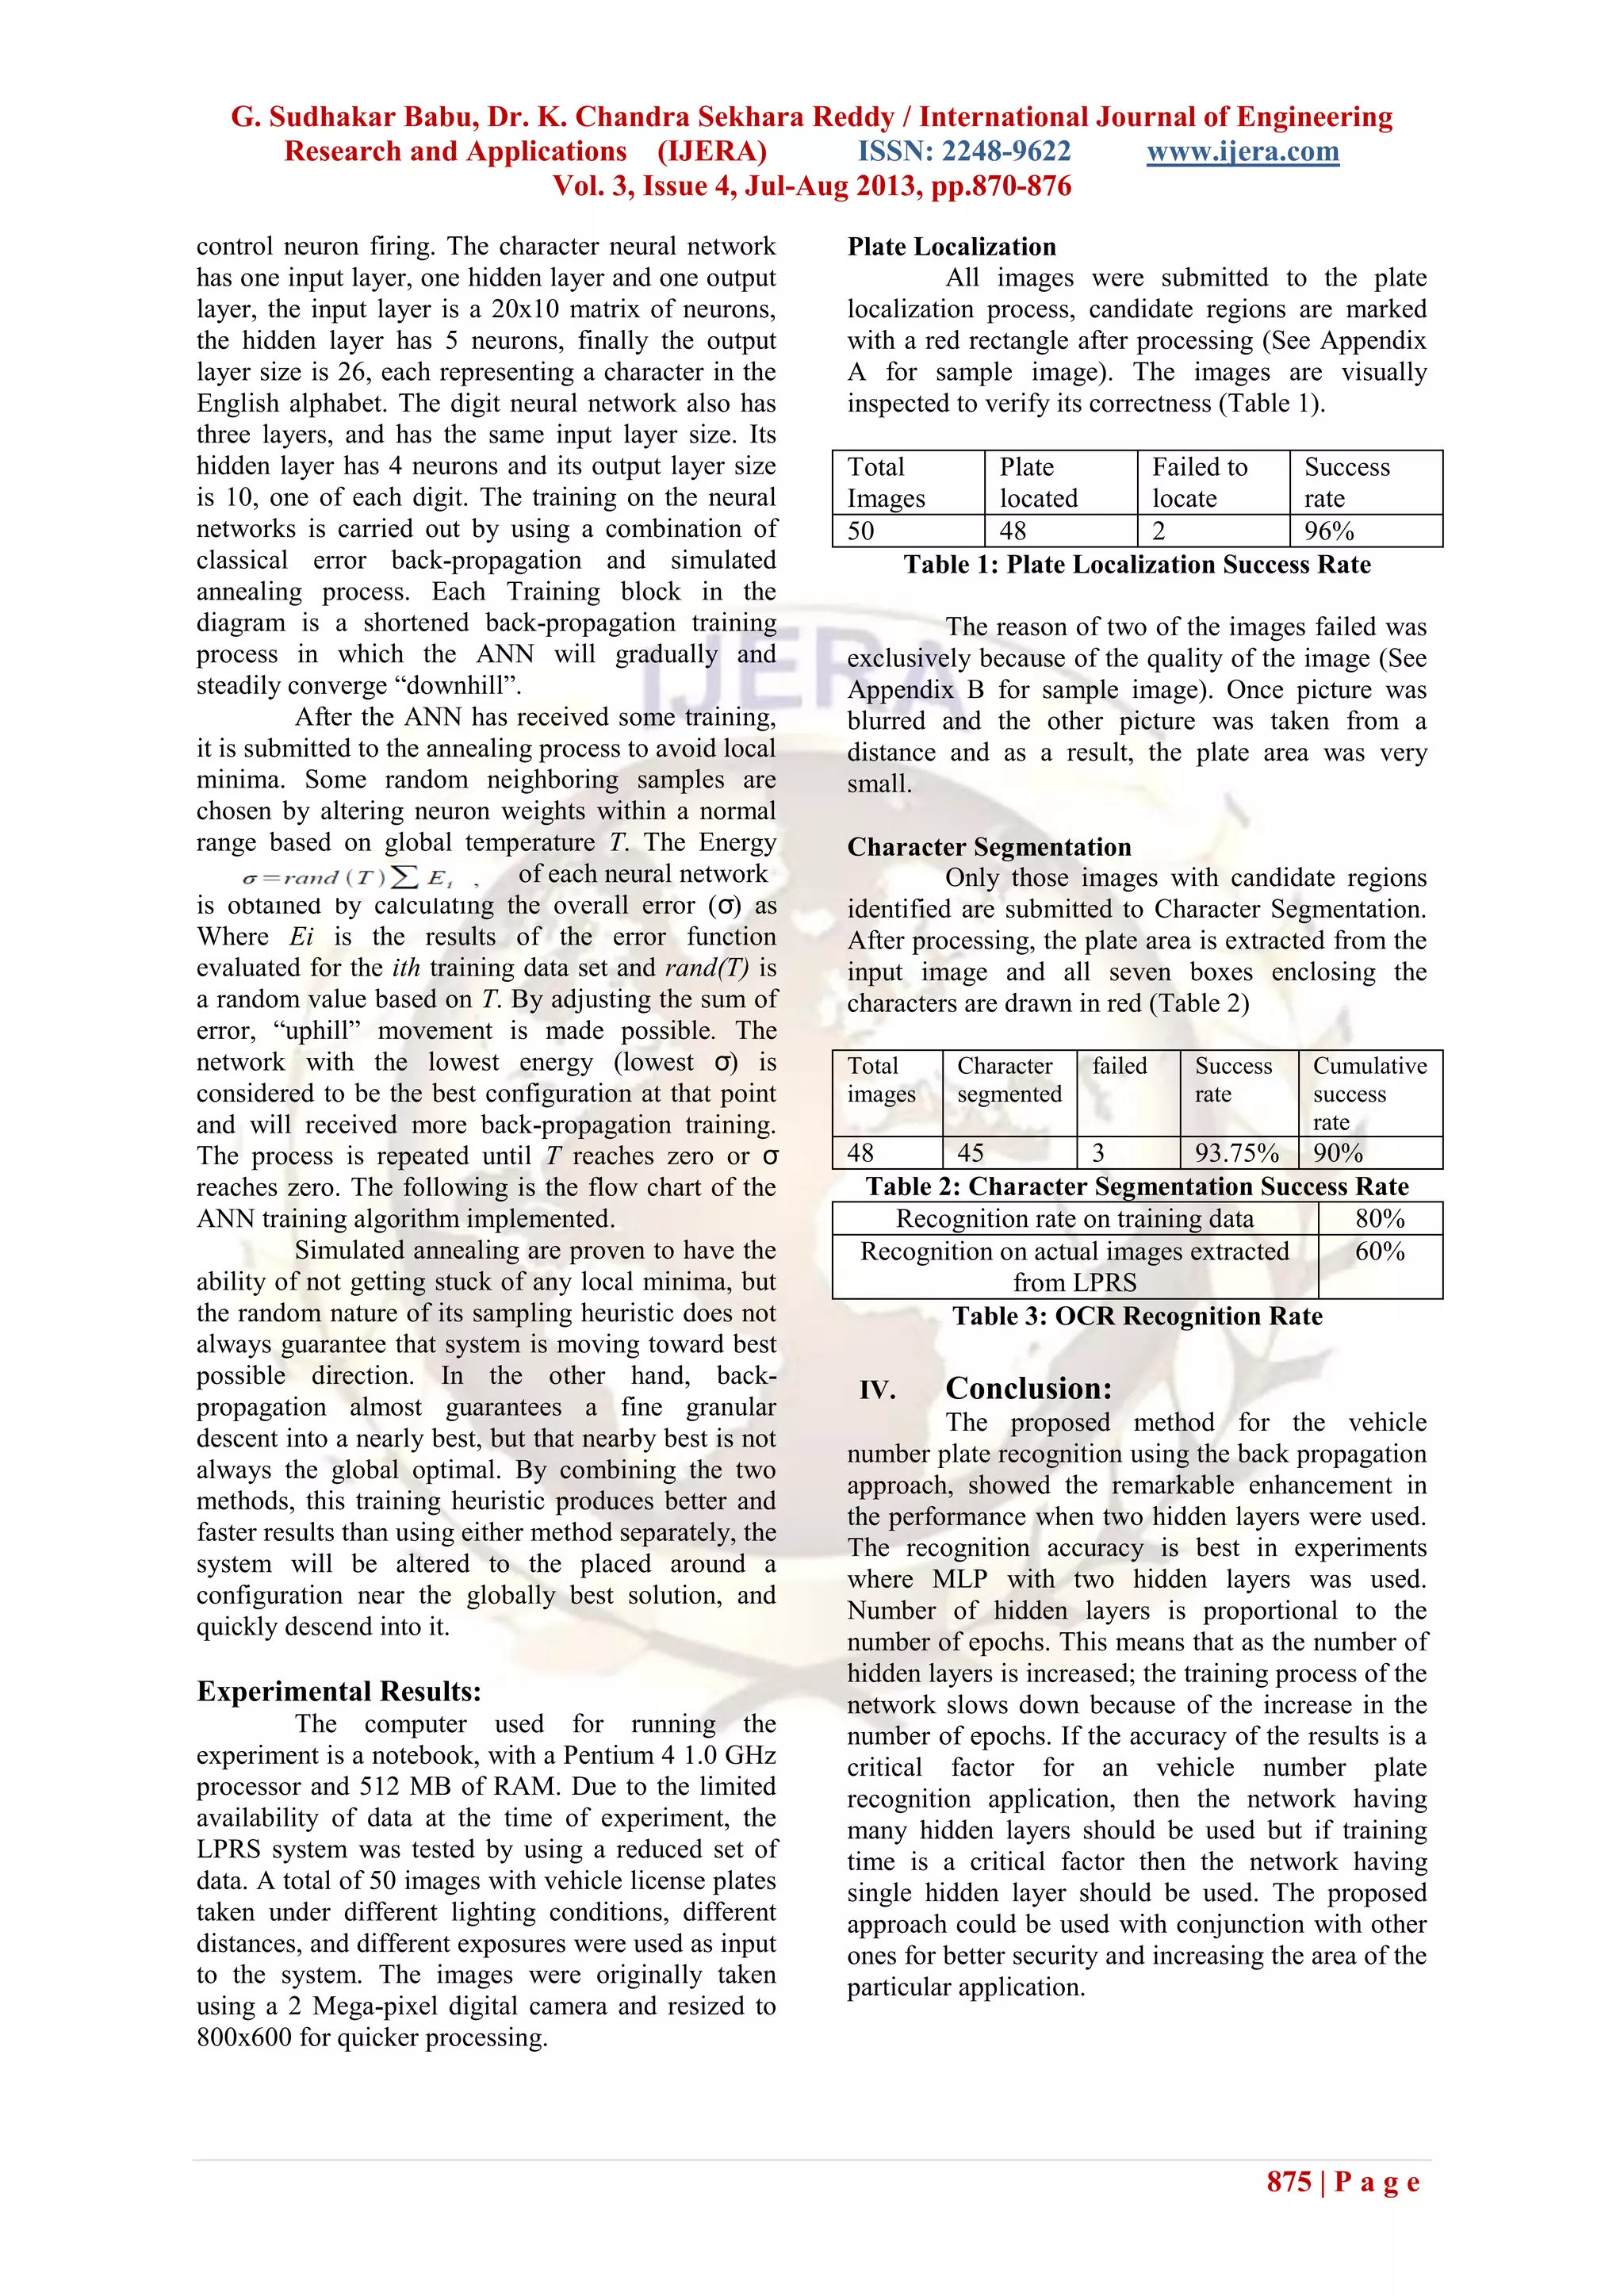
Characters Extraction
Create connected component out of the
filtered image and use boxes to fit the components.
Try to extract the glyphs by finding a series of boxes
with very similar size and shape. For a successful
image, seven boxes should be found (Figure 7.13),
each one will contain a group of pixels forming a
digit or a character. If the number of boxes found is
less than seven, then one of two possible routes is
selected.
1. If more than two boxes have been found, then an
interpolation is performed to reconstruct the
required seven boxes based on existing boxes.
2. If less than two boxes are found within the plate
region and there is a large cluster of pixels, then
this could indicate the presence of a frame
attached to the plate content in some ways. An
attempt for frame removal is performed, and the
image is re-evaluated starting from 3.1.1.
3. If above steps are applied several times without
success, the candidate region is discarded and the
next region from the collection is evaluated.
After individual characters are extracted,
each character is converted into 20x10 matrices of
one's and zeros. This matrix will be submitted to the
final stage of recognition by neural network.
Figure 13 Character extraction
Character Recognition
The Optical Character Recognition method
chosen as part of the LPRS system is an Artificial
Neural Network.
NEURAL NETWORK ARCHITECTURE:
ANN can be divided into categories based
on their different topologies
Single-layer neural network: neuron receives
input and process to produce output.
Multi-layer Network (Figure 14): One input
layer, one output layer with or without hidden
layer(s). This architecture is also called Feed
forward as information flow is strictly one way.
Each neuron receives signal from layer above
and fire signal to layer below.
Self-Organized: Network connections are
dynamically established or broken to produce
the desired outcome.
Figure14 Multi-layer Feed-forward network
Back-Propagation Algorithm
The term is an abbreviation for "backwards
propagation of errors". It is one of the most used
methods of supervised training for ANN. It is most
useful for training multilayer feed-forward neural
networks [14]. The algorithm can be summarized as
follows
1. Introduce input training data to the neural
network.
2. Compare the network's output to the desired
output from that input. Calculate the error in each
output neuron by
3. Calculate the error at each weight and adjust
4. Propagate error values to upper levels
Simulated Annealing Algorithm
Similar to the metallurgical process, each
step of a Simulated Annealing algorithm replaces the
current solution by a random "nearby" solution,
chosen with a probability that depends on a global
parameter T (called the temperature). T is gradually
decreased during each step of the process. Initially,
when T is high, the system will basically change
almost randomly around the entire search space. But
as T decreases, the system will come into an
configuration which is the best of all the
configurations tested. The random wandering saves
the system from becoming stuck at local minima.
Thus the temperature decrease takes long enough,
the system will eventually come down to a globally
optimum solution.
Neural Network Classifier Implementation
Two different neural networks are used in
LPRS for recognizing the glyphs extracted in the
segmentation stage. One is used only to recognize
numbers, and the other is trained to recognize
exclusively characters. The choice of separate neural
networks was made specifically to target California
license plates, which has predetermined placement
for digits and characters. Separated neural network
means that each network have to learn to recognize
less symbols, this expedited the training process and
reduced errors rate. Both neural network are Feed-
forward networks, and use Sigmoid function to](https://image.slidesharecdn.com/ep34870876-130706050432-phpapp01/75/Ep34870876-5-2048.jpg)
![G. Sudhakar Babu, Dr. K. Chandra Sekhara Reddy / International Journal of Engineering
Research and Applications (IJERA) ISSN: 2248-9622 www.ijera.com
Vol. 3, Issue 4, Jul-Aug 2013, pp.870-876
876 | P a g e
References
[1] R. Plamondon and S. N. Srihari, ''On-line
and off-line handwritten character
recognition: A comprehensive survey'',
IEEE. Transactions on Pattern Analysis and
Machine Intelligence, vol.22, no. 1, pp. 63-
84, 2000.
[2] R. A. Lotufo, A. D. Morgan, and A. S.
Johnson, 1990, “Automatic Number-Plate
Recognition,” Proceedings of the IEE
Colloquium on image analysis for Transport
Applications, vol. 1, no. 35,pp.6/1-6/6,
February 16, 1990.
[3] A. S. Johnson, B. M. Bird, 1990, “Number-
plate Matching for Automatic Vehicle
Identification” IEE Colloquium on
Electronic Image and Image Processing in
Security and Forensic, April, 1990.
[4] M. M. M. Fahmy, 1994, “Automatic
Number-plate Recognition: Neural Network
Approach,” Proceedings of VNIS’94 Vehicle
Navigation and Information System
Conference, 3 1 Aug-2 Sept, 1994.
[5] J. A. G. Nijhuis, M. H. Ter Brugge, K. A.
Helmholt, J. P. W. Pluim, L. Spaanenburg,
R. S. Venema, M. A. Westenberg,1995, “Car
License Plate Recognition with Neural
Networks and Fuzzy Logic,” IEEE
International Conference on Neural
Networks, 1995.
[6] H. J. Choi, 1987, “A Study on the Extraction
and Recognition of a Car Number Plate by
Image Processing,” Journal of the Korea
Institute of Telematics and Electronics,
Vo1.24, pp. 309-315,1987.
[7] H. S. Kim, et al., 1991, “Recognition of a
Car Number Plate by a Neural Network,”
Proceedings of the Korea Information
Science Society Fall Conference, Vol. 18,
pp. 259-262, 1991.
[8] E. R. Lee, P. K. Kim, and H. J. Kim, 1994,
“Automatic Recognition of a Car License
Plate Using Color Image Processing,”
Proceedings of the International Conference
on Image Processing.
[9] S. K. Kim, D. W. Kim, and H. J. Kim, 1996,
“A Recognition of Vehicle License Plate
Using a Genetic Algorithm Based
Segmentation,” Proceedings of 3rd IEEE
International Conference on Image
Processing, V01.2., pp. 661-664, 1996.
[10] V. Tavsanoglu, E. Saatci “Feature extraction
for character recognition using Gabor-type
Filters implemented by cellular neural
networks,” Proceedings of the 2000 6th
AUTHORS BIOGRAPHY
G.Sudhakar Babu, Assistant
Professor Dept of Physics, SVIT,
Hampapuram, Anantapur. He has 11 years of
teaching experience He received his M.Phil
from Allagappa University, Tamilnadu, He
published 1 papers in International Journal.
His areas of interest are Embedded systems
and Semiconductors.
Dr. K. Chandra Sekhara Reddy is
working as Associate Professor of Physics in
S.S.B.N.College, Anantapur. He is having 25
years of teaching experience. He received his
Ph.D. from Sri Krishnadevaraya University,
Anantapur in the year 1996. He guided 11
M.Phil students. Five scholars are working
under his guidance for their Ph.D. He
published 9 papers in National and
International Journals. His areas of interest
are Liquid Crystals, Nano materials and
Embedded systems.](https://image.slidesharecdn.com/ep34870876-130706050432-phpapp01/75/Ep34870876-7-2048.jpg)

The document discusses the Automatic License Plate Recognition (ALPR) system, which uses image processing and neural networks to identify vehicle license plates for traffic and security purposes. It outlines the system architecture, processes of plate localization, character segmentation, and recognition, and reviews various previous research works in the field. The proposed methodology employs a multilayer feed-forward back-propagation algorithm to achieve satisfactory results in vehicle plate recognition.


![Vibe Coding vs. Spec-Driven Development [Free Meetup]](https://cdn.slidesharecdn.com/ss_thumbnails/vibecodingvsspecdrivendevelopment-251209105622-43f455e7-thumbnail.jpg?width=640&height=640&fit=bounds)


