This article is the fifth and last in a series of articles inspired by the book ‘Supply
Chain Metrics That Matter’. In her latest book Lora Cecere introduces ‘which are
the metrics that matter’, ‘how to ensure strength, balance and resilience’, what
are the ‘evolutions in different sectors’, …
In this fifth article, we investigate who are the product leader, the customer
intimacy players and the operational excellence leaders, in our technology
benchmark. We derive targets for Gross Profit, EBIT and Inventory Turns, and
show how they differ by chosen strategy. We hope you enjoy the reading.
Topic: Ratio Analysis
Type: Essay
Subject: Accounting and Finance
Academic Level: Undergraduate Style: APA Language: English (U.S)
Number of pages: 3 (double spaced, Times New Roman, Font 12)
Number of sources: 3
Inventory Optimization as an Essential Part of your SiOP Process- our vision ...Solventure
As Solventure we take pride in being experts in designing and implementing Sales, Inventory and Operations Planning.
Companies that have a good SiOP process can’t imagine how to live without it. It is the key instrument for the CEO to navigate the business along the budget towards its strategic targets.
In this white paper we show how to optimize your inventory and why it is essential.
Chapter 1 - Balancing Cash, Cost and Service - The Supply Chain TriangleSolventure
This article fits in a series of articles inspired by the book ‘Supply Chain Metrics That Matter’. In her latest book Lora Cecere introduces ‘which are the metrics that matter’, ‘how to ensure strength, balance and resilience’, what are the ‘evolutions in different sectors’, …
In this first article, Bram tried to find the balance via the Supply Chain Triangle of Service, Cost and Cash.
Next articles will define ‘how to set balanced targets’ and ‘how to make choices in function of a chosen business strategy’.
We hope you enjoy the reading.
English - 1 - Balancing cash cost and service. The supply chain triangle.Bram Desmet
This article fits in a series of articles inspired by the book ‘Supply Chain Metrics
That Matter’. In her latest book Lora Cecere introduces ‘which are the metrics that
matter’, ‘how to ensure strength, balance and resilience’, what are the ‘evolutions
in different sectors’, …
In this first article, Bram tries to find the balance via the Supply Chain Triangle of
Service, Cost and Cash. Next articles will define ‘how to set balanced targets’ and
‘how to make choices in function of a chosen business strategy’. We hope you
enjoy the reading.
Assessing the Reality of Your Company Sales ForecastJerry Vieira
These slides were first presented to the Portland Oregon chapter of the Institute of Management Accountants in September 2011. They provide insights and techniques to use to assess the validity of a sales forecast.
Identification of competitors and then evaluation of their strengths and weakness is the core section addressed well in Competitive Analysis Module PowerPoint presentation slides. Easy to read and interpret competitive matrix in presentation layout helps to figure out your company’s position in the market. Easy handling of data makes life smooth and hassle free with the help of a presentation graphic. The distinct PPT design provides a basic platform for understanding the dynamics of competitive world with bar graphs, charts and other models thus ensuring every aspect is touched and tracked well. The competitive analysis module PPT layout provides a distinct advantage to take knowledgeable decisions so that marketing decisions can fight the threats from the competitors and avail opportunities so provided. Guided decision making is not only a prerequisite but also stands as a benchmarking to identify the gaps in planning and functioning of the entire industry and the PowerPoint slide is of best use in this situation. Competitive profile matrix is a powerful strategic tool to analyze your market position and the same has been covered in our presentation slide. Convince everyone they are capable of achieving with our Competitive Analysis Module PowerPoint Presentation Slides. They are great confidence builders.
Amzn q2 20 learnings and the outlook for its business, retail, and our economythomas paulson
Attached is my latest on why #AMZN will double again over the next few years and what the #Amazon Q2 results suggest about the #retail industry, the #RetailApocalypse, our #economy, and our society.
Create an influential marketing plan with our strategic competitive analysis PowerPoint presentation slides. Make use of this competitive strategy analysis PPT layout to take a competitive edge from your competitors in the market by implying the best industry market practices for your product or service. Thus conduct a result oriented competitive analysis through this strategic presentation template to improve your market position. Take steps to conduct a competitor analysis through this PowerPoint design like identifying your top 5-10 competitors, compare or analyze their marketing content, make an analysis of their SEO framework, monitor their social media integration, and identify the area of your improvement for your business structure. This strategic analysis PPT design further helps in taking more innovative business steps, making improved business strategies and many more. Thus download it now to start initializing over this impeccable PPT slide deck to improve your overall business efficiency and its effectiveness. Feel fully equipped with our Strategic Competitive Analysis PowerPoint Presentation Slides. Acquire the best at your fingertips.
Chapter 3 - Financial Benchmarking for Inventory Turns and Working CapitalSolventure
This article fits in a series of articles inspired by the book ‘Supply Chain Metrics That Matter’.
In her latest book Lora Cecere introduces ‘which are the metrics that matter’, ‘how to ensure strength, balance and resilience’, what are the ‘evolutions in different sectors’, …
In this third article, Bram tries to explore alternatives for measuring the cash side and the service-cost side of the supply chain triangle.
He compares inventory turns and CCC for the cash side. He compares EBIT and EBITDA for the service-cost side. We also derive the best practice curve amongst 3 benchmark companies and derive resulting targets for a combination of EBIT-inventory or EBIT-CCC.
We hope you enjoy the reading.
English - 3 - Financial benchmarking for inventory turns and working capital.Bram Desmet
This article fits in a series of articles inspired by the book ‘Supply Chain Metrics
That Matter’. In her latest book Lora Cecere introduces ‘which are the metrics that
matter’, ‘how to ensure strength, balance and resilience’, what are the ‘evolutions
in different sectors’, …
In this third article, Bram tries to explore alternatives for measuring the cash side
and the service-cost side of the supply chain triangle. He compares inventory
turns and CCC for the cash side. He compares EBIT and EBITDA for the service-cost
side. We also derive the best practice curve amongst 3 benchmark companies and
derive resulting targets for a combination of EBIT-inventory or EBIT-CCC. We hope
you enjoy the reading.
TEMPLATEFinancial Analysis Task 2Summary Report for Competit.docxmattinsonjanel
TEMPLATE
Financial Analysis Task 2
Summary Report for Competition Bikes, Inc.
One of the first things we must address is what constitutes a budget. A budget is an outlined and organized plan that displays how assets (cash, material, & other resources) are obtained, and utilized over a specified amount of time. It is a financial outline that is formulated to help with the projection of additional future income as well as current expenses. It can do things like outline potential outcomes of future acquisition, refine existing projects based on purchased amounts, or show you weekly, monthly, or annual expenses.
In fact, the entire point of having a budget is to allow for a company to accurately estimate its costs so that it can control its financial stability within reason, as well as enhance its fiscal accuracy, and offer a better guide for managerial direction! In fact, that is one of the primary roles of a manager; to apply the budget to ensure a smooth usage of financial or physical resources in operations.
That said, it is important to raise the specter of concern on several notable issue with our companies budgetary planning. For starters, let’s examine our sales budget forecasts. It’s a projection of our sales for Year 9. It states: Units Expected to be Sold as 3,510. If we are to take this as an assumption of units for next year, it is a dangerous one. Year 8 had a 15% reduction in units that were sold compared to Year 7. Presently, there is an economic recession in North America, and this is being forecast for the next several years. Insofar as I am concerned, this recession is not being taken into account in this sales projection. Certainly it is not reflected from our Net Sales, which have shown a noticeable decrease from Year 7 to Year 8.
Another concern is within the Budget Schedule and ProForma. There is not any quarterly breakdown for us to more accurately forecast for a Master Plan. In addition, there isn’t a section for us to take seasonal inventory purchases and material in. It does not address the fact that cycling is almost exclusively an outdoor sporting event, with winter month competitions virtually nonexistent. A possible solution would be to note these seasonal trends by having increased inventory stores ranging through Spring to Autumn with reduction to low levels across the winter months. If we were able to have this information presentable in a 4-Quarter fashion, it would almost certainly allow for Competition Bikes, Inc. to properly and more accurately project reasonable future sales.
Also, another concern is that at present, our company does not presently display how to specify our uncollected or uncollectable receivable goods. In a time of increasing economic uncertainty and downturn, it is very possible that we may have an inordinate number of uncollected bills, in turn, affecting our bottom line. If we incorporated this display into our budgets, we should be able to more quickly and accurat ...
AssignmentInvestment Management, Fin 3720Final examAgreement By s.docxssuser562afc1
AssignmentInvestment Management, Fin 3720Final examAgreement: By submitting the complete final exam to Bb I agree that I have not given any help to another student nor has another person given help to me.Fall 20141. Only open Blackboard and Excel on your computer.2. Please save your file frequently on the computer's desktop.3. Please use the cells to the right of the data to make calculations, or you can add rows in the ss to make calculations.4. Write your comments in the folder "Written comments".5. When done rename the file to your ID number (no names) and post in Bb and email to [email protected]AssignmentWelcome to Alpha Value Investors, LLC. We are pleased you have joined our investment firm, and hope that you appreciate our approach to investing. Almost all of our clients have well-diversified, efficient portfolios. Most have a "reasonably conservative" risk profile, but are also interested in having a non-core part of their portfolios invested in individual securities.Unfortunately, Mike has been called to a meeting, but he would like your help on a recommendation to the investment committee. As a retail industry analyst, he is considering recommending one of two stocks to our clients next week. The firms are the Gap, Inc. (GPS) and Coach, Inc. (COH).In this file are analyst reports and data on the firms. Please analyze these two companies and make a recommendation of one firm to our clients to be purchased as a long-term investment. The non-core, security portion of their portfolios are balanced across sectors but additional weight in the consumer cyclical sector would improve the allocation. The investment committee meeting is in two hours and Mike will meet you out side the meeting room so please complete your analysis in this file and be prepared to share your findings with the committee and Mike.
Written commentsWritten comments:Note: Your are welcome to format this areas as you like to present the most compelling case for investing in one of the firms.
FrameworkBAGrowth70%80%Perf. Ratios70%60%Mkt. Metrics90%70%Cash flow70%65%Value Creation70%95%
B Growth Perf. Ratios Mkt. Metrics Cash flow Value Creation 0.7 0.7 0.9 0.7 0.7 A Growth Perf. Ratios Mkt. Metrics Cash flow Value Creation 0.8 0.6 0.7 0.65 0.95
FormulasFormulasSustainable growth rate gs = ROE * bInternal growth rate gi = ROE * b * (E/A)Free Cash Flow Ebit * (1-t) + depreciation - change in NWC - CapExDividend Discount Model (constant-growth)P0 = (D1 / (ke - gss))Value with non-constant growth modelsP0 = (Div1 / (1+ r)1) + (Div2 / (1+ r)2) + (Div3 / (1+ r)3) +(TV3 / (1+ r)3)Where TV3 = (Div4 / (r - gss))And, where Divn cnd be substituted for FCFnAnd, where ke is also called rAnd, where Terminal Value (TV) also called Horizontal ValueDividend Discount Model (no-growth)P0 = Div1 / keHolding period returnReturn = (D1 + (P1 - P0)) / P0CAPMke = rf + β (rm - rf), last element often referred to as "market premium"WACCWACC = ke (E / (E + D)) + kd (1 - t) (D / (E ...
ASSESSMENT 3 MARKETING PLAN (35 marks) A Marketing Plan provide.docxcargillfilberto
ASSESSMENT 3: MARKETING PLAN (35 marks)
A Marketing Plan provides a vision and strategy proposal to position a business or product or service in the marketplace. The right marketing plan identifies who the target customers are, how to reach them, what strategies to use, and how to retain your customers over time. This assessment involves the preparation of a marketing plan based on the marketing activities of a selected company.
This is a group project (3-4 members per group) and the marketing plan effectively needs to be developed throughout the semester. For the project, your group can choose any one of the local businesses (or a product or service of that business) from the following and identify a marketing opportunity of interest for the company.
· Lebara Australia
The marketing plan should include a minimum of 5 peer-reviewed academic journals and an additional minimum of 7 (seven) relevant references from business magazines, industry whitepapers, company reports, credible and reliable websites, online business news and information sources, and marketing textbooks to confirm the strength and quality of information and analysis. Please avoid unknown and un- reliable online websites as well as commentary and opinion from unknown and non-expert commentators and personal blogs. Although Wikipedia is a great source, students are advised not to refer or cite it because it is a reader-produced encyclopaedia with a probable lack of accuracy or completeness of entries on a lot of cases. When evaluating sources always consider why and how is it relevant to your analysis; why and how does it matter to your analysis; and how it can add value to your analysis.
This is a post-graduate unit. Therefore, demonstration of highly developed analytical skills in expression, presentation and writing is expected. Poorly constructed report with lack of clarity in meaning, referencing, weak arguments, grammar and formatting issues, etc. will lower the overall quality of the report.
Marketing plan template (BH6505)
Lebara Australia
In this report we need to write a marketing plan for Lebara Australia, suggesting a service that they should provide in market. The service is 5G services in the market. (this report should include a marketing plan for lebara Australia not a marketing plan of Lebara Australia)
1. Competitor Analysis
This part should be done according to the pictures given below:
Direct and indirect competitors
Competitors
· Telstra
· Optus
· Vodafone
2. Bibliography (Harvard referencing)
Word limit: 1000 words
YOUR ATTENTION IS DIRECTED
TO THE IMPORTANT
DISCLOSURES IN APPENDIX A.
Communications
February 14, 2013
Vince Valentini, CFA Ahab Abdou, CFA (Associate)
416 944 7012 416 983 4767
[email protected][email protected]
Thomson Reuters Corp.
(TRI-T, TRI-N) C$30.02
Another Transition Year in 2013
Investment Summary
We maintain our HOLD rating on Thomson Reuters (TRI-T) shares,
with our 12-month target .
Analysis Based on the above factual data collected and compliedMargaritoWhitt221
Analysis
Based on the above factual data collected and complied, we now proceed to analysis the financial position of Caterpillar Inc. with respect to its competitors and the industry. The analysis is based on various parameters calculated above and measured based on yardsticks such as Liquidity, Activity, Leverage, Profitability, Market Value and Market-to-book ratio.
Liquidity
The first and foremost parameter to study liquidity is Net working capital. It can be observed that the net working capital has dropped by USD 2.87b when compared to 2014. The operating cash flows have dropped by USD 4.51b. This, prima facie appears to be alarming. However, on a careful evaluation of the other factors and the competitors, the following can be observedFinancial Analysis 11 | P a g e The main competitor as well has witnessed a drop of USD 3.08b in their net working capital numbers. Current ratio is stable and has not fluctuated. (from 1.39 to 1.31) The revenues have dipped by 85% (from USD 55b to USD 47b) It may be noted from the above that the current ratio is stable. It can therefore be concluded that there has not be any inefficiency as far as working capital management is concerned. However, there is an indication that there has been a slump in the industry as a whole in which the company is operating i.e. Manufacture of earth moving and other heavy equipment’s. The revenues have dipped by 15% where the competitor’s revenues have dipped by 20%. One of the broad causes for this can be attributed to an overall fall in the commodity and metal prices worldwide. The competitor has however, maintained very good liquidity position at 2.05 and is one of the best in the industry which is averaging at 1.7. On the whole, the working capital and liquidity levels are not the best in the industry. However, considering the capital intensive nature of business and heavy reliance on metal coupled with a slump in the metal industry, it can be concluded that the company has well managed and maintained its working capital and liquidity position.
Activity
In order to evaluate the Activity and Efficiency of operation, we have computed the Inventory and Receivable number of days. Inventory days have only marginally increased from 112 days to 116 days and receivable days from 123 to 139 days. On a careful analysis of these two parameters, it can be observed that in-spite of the pressure on the revenues, the Inventory days and receivable days have not drastically fluctuated. This is an indicator that the management has been quite sensitive to the developments in the industry and had taken adequate precautions regularly in order to keep the working capital under control. It can also be seen that the competitor could not control the receivable days and have increased by 82 days. With a dip in revenue, there is a high likelihood that the inventories pile up and customer payments get delayed resulting in higher inventory days and receivable days. However, in case of Cater ...
Cost Analysis ModelsUnit 3 Written AssignmentBUS .docxbobbywlane695641
Cost Analysis Models
Unit 3: Written Assignment
BUS 5110
Managerial Accounting
Unit 3
Introduction
Cost management is important for all businesses and is used to plan and control the budget. This is done by analysing business practices, predicting expenditures in advance and reducing the chance of over spending in relation to income. Using the client provided data for a business involved in the catering and events industry we can evaluate how productive and effective her business is.
Provide an accurate solution.
We can see from the data in the attached costing sheet that the company has a break even point of 3158 events. To come to this conclusion, we calculated the revenue per event (Current revenue / number of events) $22,500,000 / 5000 = $4,500. We also require our Contribution margin (Revenue per event - Variable cost per event) $4,500 - $2,600 = $1,900. To calculate the Breakeven point, we simply take the Fixed cost and divide that by the Contribution margin = 6,000,000 / 1,900 = 3157.89
Hypothetically, if the company decided they’d like to improve their revenue and increase their profits from $3,500,000 to $5,000,000 we can use the data to calculate the number of events required to reach that target. Using the Units to Achieve a Target Income formula (Total fixed costs + Target income) / Contribution margin per unit = (6,000,000 + 5,000,000) / 1,900 = 5789.47 = 5789 events (Walther, L. M. & Skousen, C.J., 2009).
Provide a narrative that defines and discusses the purpose of assigning cost categories of fixed and variable costs.
Operating a business incurs a range of costs. These can be defined as either fixed costs which don’t change in relation to activity and variable costs which do. These costing structures will likely differ between businesses and industries. Companies have even been known to use different costing structures between different internal departments. (CFI., n.d.)
Many fixed costs are going to be unavoidable and come from the simple operational side of your business. Costs such as depreciation, taxes and rent will likely remain unchanged however other fixed costs such as advertising budgets are more discretionary. Variable costs are also able to be altered depending on the size and scale of your business. For example, order quantities can be increased to bring unit costs down however before committing to such decisions forecasting your sales based on this should also be carried out to ensure you don’t end up grossly overstocked (Walther, L. M. & Skousen, C.J., 2009).
In order to maximise profits companies are required to minimise or eradicate unnecessary costs any way they can, ideally with no impact on the quality of the final product. A manager must understand both of these categories and the importance they play in the overall running of the business if they’re ever going to effectively improve the business model, reduce costs and remain profitable.
Provide a narrative that defines and discusses.
Grey matter university introduction to e commerce financials - the basicsNed Barrett
In this lesson, we discuss how to construct and evaluate basic e-commerce profit and loss statements. This is especially helpful for companies or individuals who are trying to start a new e-commerce business or who are trying to add sophistication and financial diagnostics to an existing business.
Conquering the Supply Chain Effective Frontier - 27 NOV 2017 - ReportLora Cecere
Executive Overview
Over the course of the last decade, retailers made more progress on costs and inventory turns than manufacturers. In the rush for technology adoption, we commonly find companies overstating what is possible because they are not clear on the historical trends, and often mistakenly coached to overcommit by industry consultants to justify technology investments.
In studying supply chain metrics, we find that each industry has a definitive pattern. Few are linear. To set reasonable goals, the definitions need to be very industry specific. That is the goal of this report.
In developing supply chain strategy, one of the first objectives is defining what is possible. This involves delineating the metrics, establishing reasonable targets, and rates of improvement. In the review of strategy documents for clients, we find that most companies are not clear on any of these critical sets of assumptions. This report is designed to help. We start with the definition of metrics and then share industry progress for the period of 2006-2016. This report ends with recommendations and conclusions.
• Report Details: This report is based on the analysis of orbit chart charts showing year-over-year supply chain performance at the intersection of operating margin and inventory turns for twenty industries for the period of 2006-2016. The goal is to help supply chain leaders to understand what is possible.
• Objective: As supply chain leaders attempt to define supply chain excellence, they need guidance on industry supply chain performance and overall trends for benchmarking. The goal is to help supply chain leaders make better decisions.
• Hypothesis: Each industry is unique and a good supply chain has different characteristics based upon the specific industry it is in, the product it creates and the customers it serves. Our aim is to help supply chain leaders understand relative industry performance. As shown in this report, each individual industry is charting a unique path on supply chain performance.
FEEDBACK FOR REVISINGI want you to imagine you are writing .docxmydrynan
FEEDBACK FOR REVISING:
I want you to imagine you are writing for a C-level person. Don;t think it is me. This is someone who has never read anything else you have written. With that in mind, what would that person need to read in order to better understand the market and the competitors? Also, does that person need more details in the SWOT to better understand the situation they are facing? Tell me more about the competition in your own words. I can read a balance sheet, but tell me who these other competitors are and why they are getting the better of Kohl's.
Read the paper again and work on the flow. Does it flow or does it feel choppy? (again, this is a general comment and may not be specific to your paper).
Is the main problem a drop in sales? Or, is it that Kohl's isn't able to innovate and deliver what customers want? Sales are a symptom of another problem. Focus on the problem. You can add the symptoms, but focus on the problem.
When you are addressing each problem in your solutions section, make sure you address each problem as you listed them in the previous section. For instance, if you say:
Kohl's problems are:
1) lack of innovation
2) poor marketing
3) strong competition
Then, in the solutions section you would write about each problem in that order. Don't make the reader think. Especially in a business setting. Most likely, the reader will only read the Executive Summary. But, I will be reading the entire paper.
I will be really looking at your problem descriptions, your solutions, your implementation plans, and success metrics. These are relatively new section (with the exception of the problem descriptions). Regardless if I agree or disagree with the solutions, I want to hear you make the case for why your proposed solution is THE solution. Does that make sense?
Surname 1
Term Paper Title
Name
BA 301 Final Term Paper
Section Number (e.g., Section 002)
Date
Table of Contents
3Executive Summary
Situation Analysis
4
Problem Analysis & Description
9
Solution
s, Evaluation & Recommendation12
Implementation Plan15
Success Metrics17
1Bibliography
8
Executive Summary
Kohl Corporation is a reputed player in the lifestyle industry. The company has weathered a fair share of storms, with the global economic crisis in 2008 hitting it the hardest. However, the company has maintained strong performance in the aftermath of the crisis, setting good records on growth. In the last three years, however, revenues have grown at a slower pace than expected, mainly due to ineffective marketing strategies.
The paper examines the situation for Kohl, citing the need for solutions towards a very profitable future. First, the Y generation, commonly called the millennials, is tech-savvy, preferring to do shopping online as opposed to stores. That raises the need for Kohl to construct solutions on this level to take advantage of the economic growth, increase consumption and trendy lifestyles of the millennials. In so doing, the compa ...
Similar to English - 5 - Strategic benchmarking in the supply chain triangle. (20)
Interview with FD Magazine with Carl Peeters CFO and Johan Heyman VP Global Operations of Barco, on how Barco is using the supply chain triangle to better manage inventories and drive more value via improved supply chain management
Supply chain strategy and financial metrics 20180314Bram Desmet
presentation for the productie werkgroep process industrie PGWP, what is supply chain management, the link with strategy, the link with finance, the link between supply chain strategy and finance
Supply chain strategy and financial metrics 20180118Bram Desmet
Presentation on my book supply chain strategy and financial metrics, the supply chain triangle of service, cost and cash for master in management at antwerp management school. Makes connection between strategy, finance and supply chain
Supply chain strategy and financial metrics 20171213Bram Desmet
Presentation for Supply Chain Finance course at Vlerick Business School. Linking supply chain triangle to finance via the return on capital employed. Using the strategy model of Treacy & Wiersema to show the impact on EBIT versus Capital Employed.
Sc mba in 3 days - ICT & Logistiek Utrecht - supply chain triangle 20171129Bram Desmet
presentation on the supply chain triangle as given at the ICT & logistiek fair in Utrecht on 29/11/2017, discusses the need to balance service cost and cash, the need for benchmarking in multiple dimensions, and how strategy affects key financial and supply chain KPIs
Supply chain management as THE source of value within and accross companies 2...Bram Desmet
Key note presentation from Windesheim - BLMC conference 19/06/2017 in Zwolle on "implementing supply chain management". Using the Supply Chain Triangle to explain what is supply chain management, how supply chain and finance is about optimizing the return on capital employed. Discussing how S&OP is THE key supply chain process to create alignment in the triangle
The impact of business strategy on forecasting and forecast performance 20170319Bram Desmet
Bram is working on a book called 'Supply Chain Strategy and Financial Metrics'. With the 'Supply Chain Triangle' he captures the supply chain struggle of many companies in balancing service, cost and cash. Improved forecasting is a cornerstone in improving that balance. He shows how different business strategies (e.g. cost, versus product leadership), lead to different trade-offs in the triangle, and to different forecasting challenges. Using cases from high-tech and retail he illustrates how different strategies come with different levels of complexity. When benchmarking forecast accuracy (and supply chain KPIs in general), accounting for that strategy is crucial, not to compare apples to pears.
How to define a supply chain strategy 20170319Bram Desmet
Presentation from Value Chain Supply Chain Innovations 2017. Explaining the link between strategy, supply chain and financial KPIs. With cases from Food Retail and High-Tech. Material for a book on 'Supply chain Strategy and financial metrics', based on the supply chain triangle.
IN DUTCH - Using our holistic metrics framework to map your supply chain stra...Bram Desmet
Article from Value Chain Magazine. In a series of articles inspired by the book Supply Chain Metrics that Matter from Lora Cecere. In this eight and last article, we use our holistic metrics framework, built around the supply chain triangle, to develop a business case for a supply chain improvement project. We also illustrate how different strategies impact the trade-off between the metrics and how different strategies lead to different priorities in the metrics framework.
IN DUTCH - A holistic metrics framework for your supply chain strategyBram Desmet
Article from Value Chain Magazine. In a series of articles inspired by the book Supply Chain Metrics that Matter from Lora Cecere. In this seventh article, we provide an answer on how to ‘plug the holes’ in the SCOR metrics framework by looking at what is driving value from customers and is needed to separate Operational Excellence players from Customer Intimacy or Product Leadership players. We illustrate the metrics framework in showing how it can be used to build a business case for the implementation of an SiOP solution in a manufacturing company.
ISC europe 2016 - how much inventory do you really need? Inventory Target Set...Bram Desmet
Presentation given at the Integrated Supply Chain Conference in Brussels in januari 2016. Using the Supply Chain Triangle to define which metrics we need to balance, how to link them to the business strategy. Analysis in detail of gross profit, R&D costs, SG&A costs to differentiate between product leaders, customer intimacy players and operational excellence players.
SCELP Nyenrode - Strategic target setting using the supply chain triangleBram Desmet
Presentation for SCELP, the Supply Chain Executive Leadership Platform at Nyenrode Business University. Using the Supply Chain Triangle to define which metrics we need to balance, how to link them to the business strategy, using the triangle to show the SCOR model is missing the dimensions of product complexity and product portfolio complexity. Proposing a new holisitic KPI framework that shows strategic trade-offs and their impact on the supply chain.
5 Questions for Lora Cecere on the Metrics That Matter - Supply Chain Innovat...Bram Desmet
Interactive keynote discussion with Lora Cecere on the metrics that matter at Supply Chain Innovation 2016 from Value chain. Presentation is built around 5 questions which the audience had to vote agree yes/no. Includes a word cloud on what to do to improve balance in the supply chain.
Supply chain innovations 2016 - strategic target setting in the supply chain...Bram Desmet
Presentation for the Supply Chain Innovations conference of Value Chain in 2016. Talking about how to use the supply chain triangle to define which sets of metrics to benchmark, and how strategy influences the target setting.
IN DUTCH - Driehoeksdillema voorraden duurzaam verminderen. dillema in the ...Bram Desmet
Driehoeksdillema - voorraden duurzaam verminderen. Dillema in the Supply Chain Triangle - sustainable reduction of inventories. Magazine voor Financieel Directeurs. Magazine for Financial Directors. Testimonial by Carl Peeter, CFO Barco, and Johan Heyman, VP Global Operations Barco; #supplychain #triangle #workingcapital #inventory
IN DUTCH - strategic benchmarking in the supply chain triangle 201601Bram Desmet
Article from Value Chain Magazine. In a series of articles inspired by the book Supply Chain Metrics that Matter from Lora Cecere. In this fifth and last article, we derive a strategic benchmark for our example technology companies. What is the target gross profit / EBIT / Inventory turns, for a product leader / customer intimacy leader / operational excellence leader. How does the strategy come into play when setting balanced targets for an integrated set of metrics?
Dutch - Linking the supply chain triangle to strategy.Bram Desmet
Article from Value Chain Magazine. In a series of articles inspired by the book Supply Chain Metrics that Matter from Lora Cecere. In this fourth article, we link the supply chain triangle to the strategy model of Treacy & Wiersema. We show the strategy defines the trade-off between EBIT and inventory turns. In a fifth article, we extend that into a benchmark of multiple companies.
My vision for supply chain 2020. Deep integration!Bram Desmet
Blog for the #ImagineSC Global Summit of @SCInsightsLLC. Transcript of a podcast with Lora Cecere. Building on my experience with multi-echelon inventory optimization in manufacturing and retail organizations
Lora cecere - all the metrics must be in balance - supply chain movement - ap...Bram Desmet
The Supply Chain is a complex system where metrics must be managed holistically, as a portfolio, instead of in isolation. @SCMexecutive on #supplychain #metricsthatmatter of @lcecere
Premium MEAN Stack Development Solutions for Modern BusinessesSynapseIndia
Stay ahead of the curve with our premium MEAN Stack Development Solutions. Our expert developers utilize MongoDB, Express.js, AngularJS, and Node.js to create modern and responsive web applications. Trust us for cutting-edge solutions that drive your business growth and success.
Know more: https://www.synapseindia.com/technology/mean-stack-development-company.html
RMD24 | Debunking the non-endemic revenue myth Marvin Vacquier Droop | First ...BBPMedia1
Marvin neemt je in deze presentatie mee in de voordelen van non-endemic advertising op retail media netwerken. Hij brengt ook de uitdagingen in beeld die de markt op dit moment heeft op het gebied van retail media voor niet-leveranciers.
Retail media wordt gezien als het nieuwe advertising-medium en ook mediabureaus richten massaal retail media-afdelingen op. Merken die niet in de betreffende winkel liggen staan ook nog niet in de rij om op de retail media netwerken te adverteren. Marvin belicht de uitdagingen die er zijn om echt aansluiting te vinden op die markt van non-endemic advertising.
Personal Brand Statement:
As an Army veteran dedicated to lifelong learning, I bring a disciplined, strategic mindset to my pursuits. I am constantly expanding my knowledge to innovate and lead effectively. My journey is driven by a commitment to excellence, and to make a meaningful impact in the world.
Falcon stands out as a top-tier P2P Invoice Discounting platform in India, bridging esteemed blue-chip companies and eager investors. Our goal is to transform the investment landscape in India by establishing a comprehensive destination for borrowers and investors with diverse profiles and needs, all while minimizing risk. What sets Falcon apart is the elimination of intermediaries such as commercial banks and depository institutions, allowing investors to enjoy higher yields.
RMD24 | Retail media: hoe zet je dit in als je geen AH of Unilever bent? Heid...BBPMedia1
Grote partijen zijn al een tijdje onderweg met retail media. Ondertussen worden in dit domein ook de kansen zichtbaar voor andere spelers in de markt. Maar met die kansen ontstaan ook vragen: Zelf retail media worden of erop adverteren? In welke fase van de funnel past het en hoe integreer je het in een mediaplan? Wat is nu precies het verschil met marketplaces en Programmatic ads? In dit half uur beslechten we de dilemma's en krijg je antwoorden op wanneer het voor jou tijd is om de volgende stap te zetten.
Enterprise Excellence is Inclusive Excellence.pdfKaiNexus
Enterprise excellence and inclusive excellence are closely linked, and real-world challenges have shown that both are essential to the success of any organization. To achieve enterprise excellence, organizations must focus on improving their operations and processes while creating an inclusive environment that engages everyone. In this interactive session, the facilitator will highlight commonly established business practices and how they limit our ability to engage everyone every day. More importantly, though, participants will likely gain increased awareness of what we can do differently to maximize enterprise excellence through deliberate inclusion.
What is Enterprise Excellence?
Enterprise Excellence is a holistic approach that's aimed at achieving world-class performance across all aspects of the organization.
What might I learn?
A way to engage all in creating Inclusive Excellence. Lessons from the US military and their parallels to the story of Harry Potter. How belt systems and CI teams can destroy inclusive practices. How leadership language invites people to the party. There are three things leaders can do to engage everyone every day: maximizing psychological safety to create environments where folks learn, contribute, and challenge the status quo.
Who might benefit? Anyone and everyone leading folks from the shop floor to top floor.
Dr. William Harvey is a seasoned Operations Leader with extensive experience in chemical processing, manufacturing, and operations management. At Michelman, he currently oversees multiple sites, leading teams in strategic planning and coaching/practicing continuous improvement. William is set to start his eighth year of teaching at the University of Cincinnati where he teaches marketing, finance, and management. William holds various certifications in change management, quality, leadership, operational excellence, team building, and DiSC, among others.
[Note: This is a partial preview. To download this presentation, visit:
https://www.oeconsulting.com.sg/training-presentations]
Sustainability has become an increasingly critical topic as the world recognizes the need to protect our planet and its resources for future generations. Sustainability means meeting our current needs without compromising the ability of future generations to meet theirs. It involves long-term planning and consideration of the consequences of our actions. The goal is to create strategies that ensure the long-term viability of People, Planet, and Profit.
Leading companies such as Nike, Toyota, and Siemens are prioritizing sustainable innovation in their business models, setting an example for others to follow. In this Sustainability training presentation, you will learn key concepts, principles, and practices of sustainability applicable across industries. This training aims to create awareness and educate employees, senior executives, consultants, and other key stakeholders, including investors, policymakers, and supply chain partners, on the importance and implementation of sustainability.
LEARNING OBJECTIVES
1. Develop a comprehensive understanding of the fundamental principles and concepts that form the foundation of sustainability within corporate environments.
2. Explore the sustainability implementation model, focusing on effective measures and reporting strategies to track and communicate sustainability efforts.
3. Identify and define best practices and critical success factors essential for achieving sustainability goals within organizations.
CONTENTS
1. Introduction and Key Concepts of Sustainability
2. Principles and Practices of Sustainability
3. Measures and Reporting in Sustainability
4. Sustainability Implementation & Best Practices
To download the complete presentation, visit: https://www.oeconsulting.com.sg/training-presentations
India Orthopedic Devices Market: Unlocking Growth Secrets, Trends and Develop...Kumar Satyam
According to TechSci Research report, “India Orthopedic Devices Market -Industry Size, Share, Trends, Competition Forecast & Opportunities, 2030”, the India Orthopedic Devices Market stood at USD 1,280.54 Million in 2024 and is anticipated to grow with a CAGR of 7.84% in the forecast period, 2026-2030F. The India Orthopedic Devices Market is being driven by several factors. The most prominent ones include an increase in the elderly population, who are more prone to orthopedic conditions such as osteoporosis and arthritis. Moreover, the rise in sports injuries and road accidents are also contributing to the demand for orthopedic devices. Advances in technology and the introduction of innovative implants and prosthetics have further propelled the market growth. Additionally, government initiatives aimed at improving healthcare infrastructure and the increasing prevalence of lifestyle diseases have led to an upward trend in orthopedic surgeries, thereby fueling the market demand for these devices.
Taurus Zodiac Sign_ Personality Traits and Sign Dates.pptxmy Pandit
Explore the world of the Taurus zodiac sign. Learn about their stability, determination, and appreciation for beauty. Discover how Taureans' grounded nature and hardworking mindset define their unique personality.
As a business owner in Delaware, staying on top of your tax obligations is paramount, especially with the annual deadline for Delaware Franchise Tax looming on March 1. One such obligation is the annual Delaware Franchise Tax, which serves as a crucial requirement for maintaining your company’s legal standing within the state. While the prospect of handling tax matters may seem daunting, rest assured that the process can be straightforward with the right guidance. In this comprehensive guide, we’ll walk you through the steps of filing your Delaware Franchise Tax and provide insights to help you navigate the process effectively.
Unveiling the Secrets How Does Generative AI Work.pdfSam H
At its core, generative artificial intelligence relies on the concept of generative models, which serve as engines that churn out entirely new data resembling their training data. It is like a sculptor who has studied so many forms found in nature and then uses this knowledge to create sculptures from his imagination that have never been seen before anywhere else. If taken to cyberspace, gans work almost the same way.
Accpac to QuickBooks Conversion Navigating the Transition with Online Account...PaulBryant58
This article provides a comprehensive guide on how to
effectively manage the convert Accpac to QuickBooks , with a particular focus on utilizing online accounting services to streamline the process.
Skye Residences | Extended Stay Residences Near Toronto Airportmarketingjdass
Experience unparalleled EXTENDED STAY and comfort at Skye Residences located just minutes from Toronto Airport. Discover sophisticated accommodations tailored for discerning travelers.
Website Link :
https://skyeresidences.com/
https://skyeresidences.com/about-us/
https://skyeresidences.com/gallery/
https://skyeresidences.com/rooms/
https://skyeresidences.com/near-by-attractions/
https://skyeresidences.com/commute/
https://skyeresidences.com/contact/
https://skyeresidences.com/queen-suite-with-sofa-bed/
https://skyeresidences.com/queen-suite-with-sofa-bed-and-balcony/
https://skyeresidences.com/queen-suite-with-sofa-bed-accessible/
https://skyeresidences.com/2-bedroom-deluxe-queen-suite-with-sofa-bed/
https://skyeresidences.com/2-bedroom-deluxe-king-queen-suite-with-sofa-bed/
https://skyeresidences.com/2-bedroom-deluxe-queen-suite-with-sofa-bed-accessible/
#Skye Residences Etobicoke, #Skye Residences Near Toronto Airport, #Skye Residences Toronto, #Skye Hotel Toronto, #Skye Hotel Near Toronto Airport, #Hotel Near Toronto Airport, #Near Toronto Airport Accommodation, #Suites Near Toronto Airport, #Etobicoke Suites Near Airport, #Hotel Near Toronto Pearson International Airport, #Toronto Airport Suite Rentals, #Pearson Airport Hotel Suites
Cracking the Workplace Discipline Code Main.pptxWorkforce Group
Cultivating and maintaining discipline within teams is a critical differentiator for successful organisations.
Forward-thinking leaders and business managers understand the impact that discipline has on organisational success. A disciplined workforce operates with clarity, focus, and a shared understanding of expectations, ultimately driving better results, optimising productivity, and facilitating seamless collaboration.
Although discipline is not a one-size-fits-all approach, it can help create a work environment that encourages personal growth and accountability rather than solely relying on punitive measures.
In this deck, you will learn the significance of workplace discipline for organisational success. You’ll also learn
• Four (4) workplace discipline methods you should consider
• The best and most practical approach to implementing workplace discipline.
• Three (3) key tips to maintain a disciplined workplace.
Pitch Deck Teardown: RAW Dating App's $3M Angel deck
English - 5 - Strategic benchmarking in the supply chain triangle.
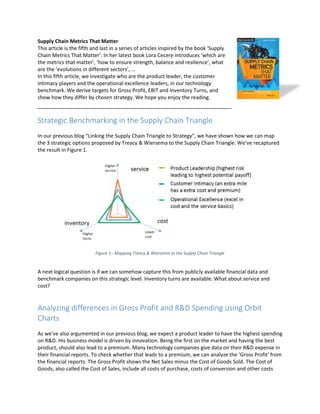
1. Supply Chain Metrics That Matter
This article is the fifth and last in a series of articles inspired by the book ‘Supply
Chain Metrics That Matter’. In her latest book Lora Cecere introduces ‘which are
the metrics that matter’, ‘how to ensure strength, balance and resilience’, what
are the ‘evolutions in different sectors’, …
In this fifth article, we investigate who are the product leader, the customer
intimacy players and the operational excellence leaders, in our technology
benchmark. We derive targets for Gross Profit, EBIT and Inventory Turns, and
show how they differ by chosen strategy. We hope you enjoy the reading.
Strategic Benchmarking in the Supply Chain Triangle
In our previous blog “Linking the Supply Chain Triangle to Strategy”, we have shown how we can map
the 3 strategic options proposed by Treacy & Wiersema to the Supply Chain Triangle. We’ve recaptured
the result in Figure 1.
Figure 1 - Mapping Treacy & Wiersema to the Supply Chain Triangle
A next logical question is if we can somehow capture this from publicly available financial data and
benchmark companies on this strategic level. Inventory turns are available. What about service and
cost?
Analyzing differences in Gross Profit and R&D Spending using Orbit
Charts
As we’ve also argumented in our previous blog, we expect a product leader to have the highest spending
on R&D. His business model is driven by innovation. Being the first on the market and having the best
product, should also lead to a premium. Many technology companies give data on their R&D expense in
their financial reports. To check whether that leads to a premium, we can analyze the ‘Gross Profit’ from
the financial reports. The Gross Profit shows the Net Sales minus the Cost of Goods Sold. The Cost of
Goods, also called the Cost of Sales, include all costs of purchase, costs of conversion and other costs
2. incurred in bringing the inventories to their present location and condition. If the product leader drives a
higher premium from his customer, he should have a higher gross margin compared to his customer
intimacy or opex colleagues.
Figure 2 analyzes the R&D spending versus the gross profit for our 3 technology companies. We notice
there is a big difference in R&D spending. Company 1 ranges from 7 to 11%. Company 2 from 5 to 8%.
Company 3 from 3 to 5%. If Company 1 were to be a product leader, that higher R&D spending should
translate into a higher gross margin. From Figure 2 we see that has been the case in the pre-crisis period
2004 – 2007. As gross profit has come down during the crisis and did not fully recover, we see that
Company 1 has been cutting its R&D spending. However, the R&D spending remains high compared to
the spending of Company 3, which has comparable gross profit levels. Company 3 has been increasing
R&D spending. Company 2 went up and down, doesn’t show a consistent pattern.
Figure 2 - R&D expense vs Gross Profit, both as % of sales
Analyzing differences in Gross Profit and SG&A Spending using Orbit
Charts
As we’ve mentioned in our previous blog, we expect a product leader to have a higher spending on Sales
and Marketing as well. You can have the best product in the world, if potential clients are unaware it will
be left unsold. Again, the premium derived from the product (the higher gross profit), should allow for
the higher spending on Sales & Marketing.
In financial statements, sales costs and marketing costs are typically not mentioned separately but
under a more general umbrella calles ‘Sales, General and Administrative’ or ‘SG&A’. When
benchmarking SG&A it is crucial to verify whether that includes or excludes the R&D costs. If the R&D
costs are not mentioned as a separate line, they are typically included in the SG&A in the consolidated
Profit & Loss. You will most probably find the R&D costs mentioned separately somewhere in the
3. financial report. By substracting them from the SG&A you can come to the SG&A excluding the R&D
costs.
Figure 3 shows the SG&A excluding R&D versus gross profit for our 3 technology companies. Though the
3 companies seem more in line, notice the big range of the spending, from 15% to 23% which is an 8%
difference! As gross profits for Company 1 have declined, during the crisis period, we see the company
has been reducing the SG&A spending. Company 3 has been increasing the SG&A spending. Company 2
has remained relatively stable.
Figure 3 - SG&A expense (excl. R&D) vs Gross Profit, both as % of sales
Analyzing differences in R&D and SG&A Spending using Orbit Charts
In our discussion so far we’ve assumed that a product leader would have both high R&D and SG&A
costs. Figure 4 shows the combined graph of R&D expense and SG&A expense (excl. R&D).
Figure 4 shows company 3 driving up spending on both Sales and R&D, for the same gross profit, so at
the expense of EBIT. That could be an attempt to reach that product leadership position. If it goes to the
expense of EBIT, it’ll be important that investors support this strategy.
It shows Company 2 is relatively flat on sales but oscillates on R&D spending.
Company 1 is oscillating most on R&D spending. Sales spending has come down. From Figure 2 and
Figure 3 we have seen that Company 1 has problems to sustain the above normal gross profit position
which is typical to a product leader. In response it has reduced spending.
4. Figure 4 - R&D expense vs. SG&A expense (excl. R&D), both as % of sales
Extending the analysis to extra benchmark companies
To get a good view on the industry, we typically want to expand this analysis to extra companies. Figure
5 and Figure 6 again show the same figures but for an extended set of benchmark companies. Company
4 is a noticeable exception in that it manages to increase gross profits in the 40% direction. As of 2005, it
uses that increased margin to increase R&D spending (cfr. Figure 5) and to increase sales spending (cfr.
Figure 6). Company 5 has more or less stable gross profit (though it is the lowest in the benchmark). You
can see that over the 10 year period it has decreased R&D expense in favour of SG&A. Company 6 sees a
decreasing gross profit and cuts in both R&D and SG&A expense.
Figure 5 - R&D expense vs Gross Profit, both as % of sales, for benchmark companies 4, 5 and 6
5. Figure 6 - SG&A expense (excl. R&D) vs Gross Profit, both as % of sales, for benchmark companies 4, 5 and 6
Figure 7 -R&D versus SG&A expense (excl. R&D), both as % of sales, for benchmark companies 4, 5 and 6
To be able to complete our benchmark, we will also need data on the inventory turns. For that reason
we have also added the EBIT versus Inventory Turns for our 6 benchmark companies in Figure 8.
6. Figure 8 - Orbit Chart EBIT% vs Inventory Turns with Benchmark Lines and extra competitors 4, 5 and 6
Deriving a strategic benchmark for Product Leadership, Operational
Excellence and Customer Intimacy in the Supply Chain Triangle.
From the benchmark data gathered in the previous sections and the previous blogs, we can distil the
benchmark for Product Leadership, Operational Excellence and Customer Intimacy, shown in Figure 9.
The benchmark is specific for the segment of the high-tech sector we have been studying. However, the
approach can be used for other sectors as well.
As a general approach, we will use the gross margin as a financial measure for the service dimension. As
discussed above, we expect a product leader can drive superior gross margin through superior service
and emotion. A higher gross margin allows for higher Sales and Marketing and R&D costs. These are the
costs we will show on the ‘cost dimension’. On the inventory axis we will show inventory turns.
7. Figure 9 - Benchmarking product leaders, opex leaders and customer intimacy players in the Supply Chain Triangle
We start with defining the benchmark for a product leader. From Figure 5 we see a premium gross profit
for Company 1 in the period 2004-2007. Gross profit around 40%, with combined SG&A and R&D
spending around 30%, leading to an EBIT of around 10%. The 10% EBIT corresponding with an average
inventory turn of 3, as shown in Figure 8.
From that same Figure 5 we see that company 4 is moving in the direction of the 40% gross margin. As it
has been moving in the direction of the 40% gross margin, it has been increasing SG&A and R&D
spending in the 30% direction. From Figure 8 we see the inventory has been moving in the direction of 3
turns. That confirms the chosen position of the product leader in Figure 9.
From Figure 5 we also see the gross profit of Company 1 has come down to around 32%. In general we
see some consistency around the 30-32% for Company 1 (post-crisis), for Company 2, for Company 3
and for Company 4 pre-crisis. Company 6 has a lower level of gross profit. Company 5 goes in the
direction of 20% gross profit. 20% gross profit means razor thin margins, leaving little room for SG&A
and R&D spending. We take that as the gross profit position for the Opex Leader. We’ll take the 30%
gross profit as the position for the customer intimacy leader.
When defining target levels for the turns, we turn back to Figure 8. Company 1 and 2 are around turns of
3. Company 4 starts around 6 and is coming down, cfr. our comment above, it is moving in the product
leadership direction. Company 5 and 6 range between 6 and 8 turns. Company 2 even goes to 9 and 10
turns. Given 9 turns is possible in the industry, it is proven by Company 2, we will take that as the target
for the Opex Leader. We will position the turns of 6 as the target level for a customer intimacy player.
If we have fixed the ‘gross profit’ and the ‘inventory turns’ position, we can calculate the corresponding
‘cost’ position starting from the assumption that each of the strategies should give a comparable EBIT
per inventory $. We will not show the math here but the result is that the EBIT% for a Customer
Intimacy player should be 5.83%, for an Opex player it should be 4.44%.
If the target EBIT% for the customer intimacy leader is 5.83%, let’s say 6%, for a gross margin of 30%,
this means he can spend 24% on SG&A and R&D. If the target EBIT% for the Opex leader is 4.44%, let’s
8. say 4%, for a gross margin of 20%, this means he can spend 16% on SG&A and R&D. Hence the 24% and
the 16% as rounded figures on the cost axis of Figure 9.
Using the Strategic Benchmark to Compare the Strategic Positioning of
our 6 Benchmark Companies.
For each of the companies 1 to 6 we can now plot their position ‘at the beginning of the 10 year period’
and ‘at the end of the 10 year period’. To smoothen the effects of individual years, we have taken the
average of the first 3 years and the average of the last 3 years.
Figure 10 - Benchmarking companies 1 to 6 on the Supply Chain Triangle using competitive benchmarks for a Product Leader, a
Customer Intimacy and an Opex Leader
9. The following can be learned from Figure 10 for each of the 6 companies:
• Company 1: compared to its original position as a product leader, it is overspending (especially
on R&D) and carries to much inventory to reflect its new gross profit situation
• Company 2: is overspending on SG&A and R&D, seems too aggressive in its inventory turns,
keeping some more inventory can probably help it to get costs down
• Company 3: was underspending in the first three years, is slightly overspending today,
inventories are not in line with its gross profit position
• Company 4: is gaining ground as a product leader, gross margins have improved, they are
slightly overspending, inventories have increased in line with the expectations of a product
leader
• Company 5: gross profit is too low for the current spending and inventory levels, to gain a
decent EBIT per inventory $ both should be reduced
• Company 6: the original position was quite balanced, the position over the last 3 years shows
signs of overspending or below standard EBIT per inventory $
This competitive benchmark now allows connecting inventory targets to targets for gross profit and for
SG&A and R&D spending. It also allows connecting the targets to the competitive strategy.
If we continue taking Company 1 as an example, we could say that either it tries to regain its position as
a product leader. To do so it might need to divest some of the lower margin business and push
innovation to drive gross margin. Or either the company leaves the position as a product leader and
plays in the middle ground. To be competitive there, it will need to reduce costs, especially in R&D, and
reduce inventories. To reduce inventories, it will need to shed some complexity of its past as a product
leader. This might include divesting some of the innovation intensive and more complex businesses.
Treacy & Wiersema advocate we need to make explicit choices and stay true to them. If not, we will
send mixed signals and may get caught in the middle. The strategic benchmarking helps in making the
choices clear.
In conclusion, we can use public financial data to do strategic benchmarking. Deriving the strategic
benchmark requires the analysis of a larger set of companies. Once the strategic benchmark has been
derived, it clarifies the choices for each of the benchmark companies. It touches on the inventory, but
goes much further to include targets for gross profit, R&D and SG&A spending. This concludes our series
of ‘Inventory Benchmarking’ blogs. Any thoughts or comments are most welcome on …
Dr. Bram Desmet is adjunct professor in Operations and Supply Chain at the Vlerick
Business School. He obtained his Phd at Gent University on the topic of “Safety stock
optimization in multi-echelon production-distribution networks”. He is working on a book
on “Supply chain strategy” and “Managing Working Capital”. As the Managing Director of
Solventure and a Partner at MÖBIUS Consulting he helps global production and retail
organizations in the domains of Strategy, Supply Chain and Operations. He welcomes
your feedback at bram_desmet@solventure.eu