SSIF Performance Update for Investment Committee - FY2015
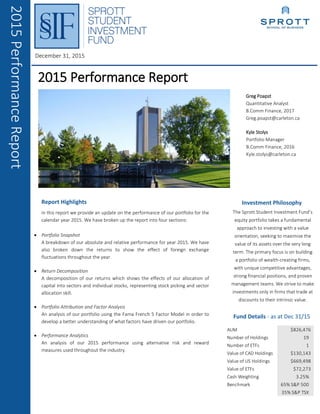
1. Greg Poapst
Quantitative Analyst
B.Comm Finance, 2017
Greg.poapst@carleton.ca
2015 Performance Report
Investment Philosophy
The Sprott Student Investment Fund’s
equity portfolio takes a fundamental
approach to investing with a value
orientation, seeking to maximize the
value of its assets over the very long
term. The primary focus is on building
a portfolio of wealth-creating firms,
with unique competitive advantages,
strong financial positions, and proven
management teams. We strive to make
investments only in firms that trade at
discounts to their intrinsic value.
Fund Details - as at Dec 31/15
Kyle Stolys
Portfolio Manager
B.Comm Finance, 2016
Kyle.stolys@carleton.ca
AUM $826,476
Number of Holdings 19
Number of ETFs 1
Value of CAD Holdings $130,143
Value of US Holdings $669,498
Value of ETFs $72,273
Cash Weighting 3.25%
Benchmark 65% S&P 500
35% S&P TSX
December 31, 2015
Report Highlights
In this report we provide an update on the performance of our portfolio for the
calendar year 2015. We have broken up the report into four sections:
Portfolio Snapshot
A breakdown of our absolute and relative performance for year 2015. We have
also broken down the returns to show the effect of foreign exchange
fluctuations throughout the year.
Return Decomposition
A decomposition of our returns which shows the effects of our allocation of
capital into sectors and individual stocks, representing stock picking and sector
allocation skill.
Portfolio Attribution and Factor Analysis
An analysis of our portfolio using the Fama French 5 Factor Model in order to
develop a better understanding of what factors have driven our portfolio.
Performance Analytics
An analysis of our 2015 performance using alternative risk and reward
measures used throughout the industry.
2015PerformanceReport
2. SPROTT STUDENT INVESTMENT FUND
1
PERFORMANCE REPORT
Portfolio Snapshot
During the calendar year 2015, our portfolio returned 6.35%, underperforming the
benchmark’s return of 10.18%. Excluding currency effects, our 2015 return drops to -7.81%,
and the benchmark’s return drops to -3.31%. A snapshot of the portfolio as of Dec 31/15 is
displayed below.
Consumer Discretionary 14.0%
Consumer Staples 10.4%
Energy 11.5%
Financials 16.6%
Healthcare 12.3%
Industrials 8.8%
Technology 17.1%
Materials 3.0%
Telecom 0.0%
Utilities 3.1%
Cash 3.2%
SECTOR ALLOCATION (% of Portfolio)
The Fund S&P 500 S&P TSX Benchmark
Q1 '15 11.52% 10.08% 2.58% 7.46%
Q2 '15 -3.14% -1.33% -1.61% -1.43%
Q3 '15 -2.83% 0.10% -4.58% -1.54%
Q4 '15 6.18% 13.00% 0.39% 8.58%
2015 6.35% 20.03% -8.11% 10.18%
Breakdown of 2015 Total Return
The Fund S&P 500 S&P TSX Benchmark
Q1 '15 3.16% 0.44% 2.58% 1.19%
Q2 '15 -1.66% -0.23% -1.61% -0.71%
Q3 '15 -6.88% -5.32% -4.58% -5.06%
Q4 '15 -1.38% 5.21% 0.39% 3.52%
2015 -7.81% -0.73% -8.11% -3.31%
Excluding Currency Effects
Taiwanese Semiconductor 9.6%
Pharmaceuticals ETF 8.7%
Apple Inc. 7.6%
Wells Fargo 6.4%
Home Depot 6.3%
Union Pacific 5.6%
The North West Company 5.6%
Scotiabank 5.3%
Great West Lifeco Inc. 4.8%
CVS Health 4.8%
Total SA 4.8%
Gentex 4.6%
Schlumberger 4.0%
Lannett Co. 3.6%
Cash 3.2%
Jacobs Engineering 3.2%
Michael Kors 3.2%
Public Service Enterprise Group 3.1%
Monsanto 3.0%
Kinder Morgan 2.7%
EQUITY ALLOCATION (% of Portfolio)
3. SPROTT STUDENT INVESTMENT FUND
2
PERFORMANCE REPORT
Return Decomposition
In this section, we break down the relative returns between our portfolio and the
benchmark by sector contribution. Taking each sector’s contribution to returns, we further
decompose the relative return into two components: Allocation and Selection Effects.
Figure 1 on the left summarizes the results for end of year 2015 performance. Throughout
2015 we have seen manager stock selection skill account for a major proportion of the
underperformance in our portfolio. In contrast, Allocation effects were positive but neglible.
Analyzing the effects on a cumulative basis in figure 2, we can see that the selection effect is
inherently more volatile than the allocation effect and drives the largest proportion of
relative performance for our portfolio. This volatility is due to the concentration of our
portfolio, which consisted of 20 securities at year end.
On a sector basis, the financials, industrials, technology, energy and healthcare
sectors contributed the most to our underperformance primarily due to poor stock selection
strategies (Figure 3). On the other hand, our holdings in the basic materials, consumer
discretionary, consumer staples and utilities sectors gained relative to the benchmark as a
result of our strong picks. It is interesting to point out that Cash itself has a large selection
effect primarily due to the favorable USD/CAD exchange rates and realized dividends during
our holding period. Conversely, the negative allocation effect can be considered as the
opportunity cost of holding cash rather than risky assets since it is implicitly assumed that
our benchmark holds no cash.
Figure 2 – Cumulative Allocation and Selection Effects over Time Figure 3 – Sector Return Decomposition by Allocation and Selection Effect
Figure 1 – Summary Decomposition
Portfolio Return 6.35%
Benchmark Return 10.18%
Allocation Effect 0.38%
Selection Effect -4.21%
Total Effect -3.83%
4. SPROTT STUDENT INVESTMENT FUND
3
PERFORMANCE REPORT
Portfolio Attribution and Factor Analysis
As established late last year, we have expanded our knowledge of Fama French 5
factor model with momentum. We believe that the results of our factor analysis can add
value to our portfolio management decisions, and give us insight into how we compare to
our benchmark.
Using a Fama French 5 Factor model we can see that our ability to generate Alpha is
not statistically significant. That is to say that our Alpha coefficient (Model Intercept) is so
close to zero that we cannot say with any distinct confidence whether we have excess
returns or not.
The results of our 5 Factor model show some very interesting insights into our
portfolio exposure. With a raw R-Squared of .66, we can say that 66% of the portfolio’s daily
returns can be explained by the 5 factor plus momentum model. The Market Return (Mkt-
RF) factor shows by far the highest coefficient and also the most statistically significant P
value, which makes sense given the nature of this factor. We can interpret this as the
market Beta of our portfolio which at about .69 is a very modest Beta for a long term
portfolio.
The second coefficient concerns company size as determined by market cap. The
SmB (small minus big) coefficient is close to zero indicating that we are a very large cap-
oriented portfolio, also in line with expectations.
Figure 5 – Coefficient Coefficients of Five Factor Model plus Momentum
Figure 6 - Beta Coefficients
Intercept/Alpha 0.003
Mkt-RF **0.692
SMB 0.020
HML -0.171
RMW 0.011
CMA -0.246
MoM 0.078
*95% Significance level
**99% Significance Level
Betas and Significance
5. SPROTT STUDENT INVESTMENT FUND
4
PERFORMANCE REPORT
The third coefficient concerns value vs. growth. This is where the results of our factor
analysis deviate from our expectations. An HmL (high minus low) coefficient above 0.3
indicates a value fund as a rule of thumb. With a coefficient that is actually slightly negative,
we have evidence that contradicts our investment philosophy. This coefficient indicates that
our portfolio has behaved more similarly to a growth fund rather than a value fund during
2015.
The fourth coefficient, RmW (robust minus weak) is used as a proxy for operating
profitability. With a coefficient close to zero, we show signs of our holdings having weak
operating profitability.
The fifth coefficient, CmA (conservative minus aggressive) is meant to explain whether
the managers of the companies we own exhibit aggressive or conservative capital allocation
behaviour. The negative coefficient indicates that our holdings typically invest more
aggressively, however so does the benchmark portfolio. We believe that this may be
skewed due to the time period of study. In recent years, economies have expanded and we
have seen firms invest more aggressively due to low borrowing costs.
With the addition of the Momentum coefficient, we can identify whether we are more
momentum based or contrarian based investors. This may be useful when we look at
optimal rebalancing procedures. Our current level of momentum is a very modest positive
coefficient and shows no particular trend to either momentum or contrarian based
investment approaches.
6. SPROTT STUDENT INVESTMENT FUND
5
PERFORMANCE REPORT
Annualized Alpha -0.004
Beta 0.965
Correlation 0.928
Information Ratio -0.159
Comparative Statistics
Performance Analytics
Portfolio Overview
While we performed fairly well over the course of 2015, the final statistics show that
we still have a long way to go. As seen in the chart above, and the table to the left, we
underperformed our benchmark both in returns and standard deviation – ultimately leading
to a lower Sharpe ratio (risk-adjusted return metric). While these numbers are important,
we want to break down the returns further and completely understand how and why we
performed in this way.
Comparative Performance
Using Comparative statistics to compare against a benchmark can be extremely
helpful when trying to determine overall performance. Using a simple CAPM approach, we
can answer several important questions.
As shown in Figure 8, we finished 2015 with slightly negative alpha and a beta of .965
showing that when adjusting for market risk, we underperformed the benchmark. While we
had less risk compared to our benchmark on a beta scale, we underperformed in terms of
performance even more.
Figure 8 – Comparative Statistics
Figure 6 – SSIF Returns and Drawdowns
Figure 7 – Portfolio Overview
SSIF Benchmark
Annualized Return 6.33% 10.18%
Annualized Std Dev 0.140 0.134
Annualized Sharpe 0.453 0.757
Sortino ratio 0.047 0.075
Value at Risk 9.58% 9.31%
Portfolio Overview
7. SPROTT STUDENT INVESTMENT FUND
6
PERFORMANCE REPORT
The other very interesting and widely used ratio is the information ratio. The
information ratio is a measure of excess return, but also attempts to capture the
consistency of the fund. If we consistently beat the benchmark, we should have a high
positive information ratio. Unfortunately the information ratio shows that over 2015 we
have not generated excess returns, and is therefore not a good measure of consistency.
To continue our analysis of comparative performance, we developed two charts to
provide some key insights. The first chart (Figure 9) is a 12 day rolling correlation of SSIF and
our Benchmark. As you can see, we were highly correlated with our benchmark with two
distinct exceptions. Through most of February and about halfway through December our
benchmark correlation fell somewhat. During the February period we outperformed the
benchmark, however during the December period we fell with the benchmark but never
quite came back with it.
Figure 10 looks further into the effects of these deviations from the benchmark, and
shows evidence that the negative December deviation outweighed the positive effects of
the February deviation. In other words, we captured more negative movements of our
benchmark as opposed to positive movements throughout the calendar year 2015.
Figure 9 – Rolling Correlation Analysis Figure 10 – Upside and Downside movements
8. SPROTT STUDENT INVESTMENT FUND
7
PERFORMANCE REPORT
Concluding Thoughts
While the metrics and attribution methods discussed above are informative, they
must be used with some degree of discretion. Our holding period for these metrics is only
one year long, and we made significant changes in the composition of our portfolio
throughout the year.
The quantitative analysis presented above was developed with the goal of analyzing
our performance. However, we believe there is value that can be added to our future
decision making and consequently our portfolio returns going forward. By understanding
where we generate excess returns and where we lose them, we can avoid making similar
mistakes in the future while capitalizing more on what we already do well.
We are constantly learning and expanding on our knowledge in the area of portfolio
analytics. A key portion of this area revolves around risk. While the two go hand in hand, we
do believe it is important to look more closely at alternative and progressive risk analysis
techniques. It is for this reason that we plan on developing and authoring a risk
management report during the next few months. From a portfolio perspective, there may
be extraordinary value in this type of analysis.
9. SPROTT STUDENT INVESTMENT FUND
8
PERFORMANCE REPORT
References
Bloomberg Terminal. 2015.
CRAN Portfolio Analytics Online Manual. 2014.
Jacques Pezier, Anthony White. 2006. The Relative Merits of Investable Hedge Fund Indices
and of Funds of Hedge Funds in Optimal Passive Portfolios. Discussion Paper,
University of Reading.