SlideShare a Scribd company logo
Supply Chain Metrics That Matter
This article fits in a series of articles inspired by the book ‘Supply Chain Metrics
That Matter’. In her latest book Lora Cecere introduces ‘which are the metrics that
matter’, ‘how to ensure strength, balance and resilience’, what are the ‘evolutions
in different sectors’, …
In this third article, Bram tries to explore alternatives for measuring the cash side
and the service-cost side of the supply chain triangle. He compares inventory
turns and CCC for the cash side. He compares EBIT and EBITDA for the service-cost
side. We also derive the best practice curve amongst 3 benchmark companies and
derive resulting targets for a combination of EBIT-inventory or EBIT-CCC. We hope
you enjoy the reading.
Financial Benchmarking for Inventory Turns and Working Capital
This blog is a follow-up on 2 earlier blogs ‘Balancing Cash Cost and Service. The Supply Chain Triangle.’
and ‘Benchmarking and the Best Practice Frontier in the Supply Chain Triangle.’ In those blogs we have
shown there is a lack of alignment when setting targets for the Cash, Cost and Service in companies.
Using so called orbit charts, we have benchmarked companies on EBIT% versus Inventory Turns. That
benchmark helped to reveal the so-called ‘best practice frontier’, which in turn helped in setting
aggressive but aligned targets for EBIT% versus Inventory Turns.
As recaptured in Figure 1, the inventory turns are a measure on the ‘cash’ side of the triangle. The EBIT%
is combining the service and the cost dimension. Analyzing how the 2 move together is crucial in coming
to aligned targets.
Figure 1 - Aligning EBIT% and Inventory Turns to align the Supply Chain Triangle
Next to EBIT, a commonly used measure is EBITDA. The EBITDA excludes any depreciation or
amortization, which are not ‘cash outs’, so the EBITDA is a closer measure for the ‘cash generated by the
operations’. Let’s explore EBITDA% as an alternative for EBIT% in the orbit charts.
Inventory is a part of working capital, together with the Accounts Payable and the Accounts Receivable.
Lowering working capital generates cash. Working capital can be measured by the so-called ‘Cash
Conversion Cycle’. Let’s explore the Cash Conversion Cycle as an alternative for the Inventory Turns in
the orbit charts.
Where EBIT or EBITDA per inventory $ or per working capital $ helps in getting meaningful benchmarks
and aligned targets, they are not common financial metrics. We will close this blog by discussing the
Return On Capital Employed or ROCE which is close to the EBIT% vs CCC, and which is a more common
financial metric.
Benchmarking EBITDA% versus Inventory Turns
Figure 2 recaps the EBIT versus Inventory Turns for our 3 technology companies presented in the blog
‘Benchmarking and the Best Practice Frontier in the Supply Chain Triangle.’ In that blog we also
discussed how Company 2 showed strength in inventory turns but was unbalanced with EBIT%. Both
Company 1 and Company 3 get hit by the financial crisis but Company 1 shows a full rebound to pre-
crisis profitability at better turns. It proves to be more resilient.
Figure 2 - Orbit chart on 'EBIT%' versus 'Inventory Turns' for 3 competing technology companies
Figure 3 compares EBITDA% versus inventory turns for the same 3 companies. EBITDA% is higher than
the EBIT% as it does not account for the depreciations and the amortizations. There is a noticeable
difference in the comparison of Company 1 and Company 3 for the 2 graphs. When comparing EBIT%
Company 3 is clearly superior in the period 2004-2007. When comparing EBITDA% they seem to be
closer.
Figure 3 - Orbit chart on 'EBITDA%' versus 'Inventory Turns' for 3 competing technology companies
The difference is not a performance but an accounting difference. There are 2 basic options to account
for investments in R&D:
- Either, we account for the R&D cost of the year, in the year itself. The R&D costs can be covered
in the Selling, General and Adminstrative costs, or mentioned as a separate item, but in any case
they are included ‘above’ the EBITDA line, so accounted for in the EBITDA.
- Either, we ‘capitalize’ the R&D expense, and depreciate it over the lifetime of the corresponding
products. In this case, the R&D costs are ‘below’ the EBITDA line, so not accounted for in the
EBITDA, but mentioned as a depreciation cost below the EBITDA line.
Figure 4 compares the EBIT% and the EBITDA% for our 3 companies. For company 1, the EBITDA is
consistently higher than the EBIT. This has to do with the depreciation of the R&D costs. This company is
using the second approach. It is because they follow the first accounting approach.
Figure 4 - Comparing EBITDA% and EBIT%
As a result the comparison in Figure 3 is not a fair comparison. 2 companies have accounted for the R&D
costs in their EBITDA, company 1 has not. When benchmarking we need to be careful to compare apples
to apples. Figure 2 is comparing apples to apples, all companies have accounted for R&D expenses.
Figure 3 is comparing apples with pears, company 2 and 3 have accounted for R&D expenses where
company 1 has not.
Benchmarking EBIT% versus Cash Conversion Cycle
Figure 5 shows an orbit chart for the EBIT% versus the Cash Conversion Cycle (CCC) for our 3 technology
companies. The Cash Conversion Cycle is calculated as the Days Inventory On Hand (DIOH) + the Days of
Sales Outstanding (DSO) – the Days of Payables Outstanding (DPO).
Figure 5 - EBIT% versus Cash Conversion Cycle for 3 technology companies
Where in Figure 2 we want to be on the ‘top right’ corner, high EBIT% and high inventory turns, in Figure
5 we want to be on the top left corner, high EBIT% and a low CCC corresponding with a low working
capital.
From Figure 5 we see that Company 3 has a low CCC but for a low profitability. It is comparable to our
conclusion for Figure 2. It is strong in working capital management but unbalanced with a substandard
profitability.
From that same Figure 5 we see that Company 1 has done a good job in reducing it’s working capital
while keeping the EBIT% at decent levels. 2014 was a bad year as the CCC increased and the EBIT% went
down. The direction of 2010 – 2012 was a better one, decreasing CCC while increasing EBIT%. The
company should look to regain that momentum.
Company 3 looks struggling from Figure 5, EBIT% has come down, and CCC has increased. Going back to
Figure 2 gives a comparable message. For 2012 Company 1 and Company 3 have a comparable EBIT%
but Company 1 has a higher inventory turns.
In general we expect the ‘Inventory Turns’ and the ‘CCC’ indeed to point in the same direction. When
companies work on inventories, they are likely to do it for cash reasons so they also work on Payables
and Receivables.
Reveal the “Best Practice Frontier” for EBIT% versus CCC
As we did in the previous blog ‘Benchmarking and the Best Practice Frontier in the Supply Chain
Triangle.’ for EBIT% versus Inventory Turns, Figure 6 shows the Minimum, the Median and the Maximum
“EBIT per working capital $” curves. It is OK to have more working capital, as long as the EBIT per
working capital $ is higher. For Figure 6 we have taken the years with a Minimum, Median and
Maximum EBIT per working capital $ for company 1. For each of these years we have shown the
combination of EBIT% and CCC that would have led to the same EBIT per working capital $.
Figure 6 - Minimum, Median, Maximum EBIT per invested dollar curves for Company 1
Figure 7 shows the same for Companies 2 and 3. The graph on the bottom right compares the median
performance of the 3 companies.
Figure 7 - Min/Med/Max EBIT% vs CCC for Companies 1, 2 and 3
As we did in the previous blog ‘Benchmarking and the Best Practice Frontier in the Supply Chain
Triangle’, the Median and the Maximum of Company 3 can again be used as a benchmark and for target
setting.
As shown in Figure 8, when going for the Median curve, the Company 1 should
- Either return to a CCC of around 100 days for an EBIT% of around 6%
- Either has to boost EBIT% back to 8% if it’s CCC stays around 130 days
Figure 8 - Target Setting for Company 1 based on EBIT% vs CCC benchmarking analysis
If we take it a couple of steps further, and go for the Maximum curve, Figure 9 shows that a stretched
target for Company 1 would be to
- Either further boost its performance to land ad a CCC of around 70 days for an EBIT of around
10%
- Or either further boost its EBIT to around 20% for the current CCC of around 130 days
Again, these targets seem overly aggressive but Company 3 has been close to that performance for 3
consecutive years. A detailed analysis of how they did should reveal opportunities for Company 1 to
shift in that same direction.
The 2 options also seem to go in quite opposite directions. As we will introduce in a next blog, we
believe the choice of direction is one of the choice of strategy.
Figure 9 - Stretched Target Setting for Company 1 based on EBIT% vs CCC benchmarking analysis
The ROCE as a common financial metric spanning the Supply Chain
Triangle.
So far we have used the EBIT per inventory $ or per working capital $ as a metric spanning the supply
chain triangle. Where these help to define a good benchmarking strategy for the Inventory Turns or the
Cash Conversion Cycle, they are not common financial metrics. A more commonly used financial metric
spanning the full Supply Chain Triangle is the Return On Capital Employed or the ROCE.
The ROCE is defined as follows:
EmployedCapital
EBIT
ROCE =
With Capital Employed = Fixed Assets + Working Capital. The main difference with what we did so far is
the Fixed Assets. The Fixed Assets can be told to be part of the ‘Cash’ part of the triangle. So this metric
is clearly going beyond the Supply Chain Triangle.
Figure 10 shows the ROCE evolution for our three benchmark companies. We come to comparable
conclusions. Competitor 1 has below standard ROCE and seems to be in a prolonged period of trouble.
Competitor 2 is doing well before and during the crisis but had difficulties to sustain that after the crisis
period. Company 1 has improved its ROCE performance. From the previous analyses we know that the
EBIT% has come down but so has the working capital, leading to an overall improvement in the
profitability of the company.
Figure 10 - ROCE evolution for 3 competing technology companies
In conclusion, we need to take care to compare apples with apples when performing a benchmark.
Benchmarking with inventory turns or with working capital gives comparable results, which is not too
surprising. Benchmarking EBIT per inventory $ or per working capital $ allows balanced target setting.
Though they are not common financial metrics, they point in the same direction as the ROCE, which is a
more common financial metric.
Dr. Bram Desmet is adjunct professor in Operations and Supply Chain at the Vlerick
Business School. He obtained his Phd at Gent University on the topic of “Safety stock
optimization in multi-echelon production-distribution networks”. He is working on a book
on “Supply chain strategy” and “Managing Working Capital. As the Managing Director of
Solventure and a Partner at MÖBIUS Consulting he helps global production and retail
organizations in the domains of Strategy, Supply Chain and Operations. He welcomes
your feedback at bram_desmet@solventure.eu

More Related Content

Viewers also liked

2015 VLA CM Program presentation version
2015 VLA CM Program presentation version2015 VLA CM Program presentation version
2015 VLA CM Program presentation versionAnn Theis
 
Idmes16 2 juni
Idmes16 2 juniIdmes16 2 juni
Idmes16 2 juni
Karin Winters
 
Creionul invizibil
Creionul invizibilCreionul invizibil
dean's-list-2014.15
dean's-list-2014.15dean's-list-2014.15
dean's-list-2014.15Aditya Khera
 
Building a Robotics Hub in San Diego
Building a Robotics Hub in San DiegoBuilding a Robotics Hub in San Diego
Building a Robotics Hub in San Diego
MecklerMedia
 
Plaintiffs' Original Petition - Gautreaux v. Toyota
Plaintiffs' Original Petition - Gautreaux v. ToyotaPlaintiffs' Original Petition - Gautreaux v. Toyota
Plaintiffs' Original Petition - Gautreaux v. Toyota
Shawn Tuma
 
Métodos anticonceptivos (2)
Métodos anticonceptivos (2)Métodos anticonceptivos (2)
Métodos anticonceptivos (2)
airam dueñas
 
Chapter 1 - Balancing Cash, Cost and Service - The Supply Chain Triangle
Chapter 1 - Balancing Cash, Cost and Service - The Supply Chain TriangleChapter 1 - Balancing Cash, Cost and Service - The Supply Chain Triangle
Chapter 1 - Balancing Cash, Cost and Service - The Supply Chain Triangle
Solventure
 
Võ dân tộc
Võ dân tộcVõ dân tộc
Võ dân tộc
Hư Vô
 
SCELP Nyenrode - Strategic target setting using the supply chain triangle
SCELP Nyenrode - Strategic target setting using the supply chain triangleSCELP Nyenrode - Strategic target setting using the supply chain triangle
SCELP Nyenrode - Strategic target setting using the supply chain triangle
Bram Desmet
 
Chapter 3 - Financial Benchmarking for Inventory Turns and Working Capital
Chapter 3 - Financial Benchmarking for Inventory Turns and Working CapitalChapter 3 - Financial Benchmarking for Inventory Turns and Working Capital
Chapter 3 - Financial Benchmarking for Inventory Turns and Working Capital
Solventure
 
Chapter 2 - Benchmarking and the Best Practice Frontier in the Supply Chain T...
Chapter 2 - Benchmarking and the Best Practice Frontier in the Supply Chain T...Chapter 2 - Benchmarking and the Best Practice Frontier in the Supply Chain T...
Chapter 2 - Benchmarking and the Best Practice Frontier in the Supply Chain T...
Solventure
 
Supply Chain Metrics That Matter
Supply Chain Metrics That MatterSupply Chain Metrics That Matter
Supply Chain Metrics That Matter
Solventure
 
Chapter 5 - Strategic Benchmarking in the Supply Chain Triangle
Chapter 5 - Strategic Benchmarking in the Supply Chain TriangleChapter 5 - Strategic Benchmarking in the Supply Chain Triangle
Chapter 5 - Strategic Benchmarking in the Supply Chain Triangle
Solventure
 
Why Is S&OP So Hard? 28 MAY 2015
Why Is S&OP So Hard? 28 MAY 2015 Why Is S&OP So Hard? 28 MAY 2015
Why Is S&OP So Hard? 28 MAY 2015 Lora Cecere
 
Supply chain innovations 2016 - strategic target setting in the supply chain...
Supply chain innovations 2016 -  strategic target setting in the supply chain...Supply chain innovations 2016 -  strategic target setting in the supply chain...
Supply chain innovations 2016 - strategic target setting in the supply chain...
Bram Desmet
 

Viewers also liked (17)

2015 VLA CM Program presentation version
2015 VLA CM Program presentation version2015 VLA CM Program presentation version
2015 VLA CM Program presentation version
 
Idmes16 2 juni
Idmes16 2 juniIdmes16 2 juni
Idmes16 2 juni
 
Creionul invizibil
Creionul invizibilCreionul invizibil
Creionul invizibil
 
dean's-list-2014.15
dean's-list-2014.15dean's-list-2014.15
dean's-list-2014.15
 
Building a Robotics Hub in San Diego
Building a Robotics Hub in San DiegoBuilding a Robotics Hub in San Diego
Building a Robotics Hub in San Diego
 
basharat CV W F S
basharat CV W F Sbasharat CV W F S
basharat CV W F S
 
Plaintiffs' Original Petition - Gautreaux v. Toyota
Plaintiffs' Original Petition - Gautreaux v. ToyotaPlaintiffs' Original Petition - Gautreaux v. Toyota
Plaintiffs' Original Petition - Gautreaux v. Toyota
 
Métodos anticonceptivos (2)
Métodos anticonceptivos (2)Métodos anticonceptivos (2)
Métodos anticonceptivos (2)
 
Chapter 1 - Balancing Cash, Cost and Service - The Supply Chain Triangle
Chapter 1 - Balancing Cash, Cost and Service - The Supply Chain TriangleChapter 1 - Balancing Cash, Cost and Service - The Supply Chain Triangle
Chapter 1 - Balancing Cash, Cost and Service - The Supply Chain Triangle
 
Võ dân tộc
Võ dân tộcVõ dân tộc
Võ dân tộc
 
SCELP Nyenrode - Strategic target setting using the supply chain triangle
SCELP Nyenrode - Strategic target setting using the supply chain triangleSCELP Nyenrode - Strategic target setting using the supply chain triangle
SCELP Nyenrode - Strategic target setting using the supply chain triangle
 
Chapter 3 - Financial Benchmarking for Inventory Turns and Working Capital
Chapter 3 - Financial Benchmarking for Inventory Turns and Working CapitalChapter 3 - Financial Benchmarking for Inventory Turns and Working Capital
Chapter 3 - Financial Benchmarking for Inventory Turns and Working Capital
 
Chapter 2 - Benchmarking and the Best Practice Frontier in the Supply Chain T...
Chapter 2 - Benchmarking and the Best Practice Frontier in the Supply Chain T...Chapter 2 - Benchmarking and the Best Practice Frontier in the Supply Chain T...
Chapter 2 - Benchmarking and the Best Practice Frontier in the Supply Chain T...
 
Supply Chain Metrics That Matter
Supply Chain Metrics That MatterSupply Chain Metrics That Matter
Supply Chain Metrics That Matter
 
Chapter 5 - Strategic Benchmarking in the Supply Chain Triangle
Chapter 5 - Strategic Benchmarking in the Supply Chain TriangleChapter 5 - Strategic Benchmarking in the Supply Chain Triangle
Chapter 5 - Strategic Benchmarking in the Supply Chain Triangle
 
Why Is S&OP So Hard? 28 MAY 2015
Why Is S&OP So Hard? 28 MAY 2015 Why Is S&OP So Hard? 28 MAY 2015
Why Is S&OP So Hard? 28 MAY 2015
 
Supply chain innovations 2016 - strategic target setting in the supply chain...
Supply chain innovations 2016 -  strategic target setting in the supply chain...Supply chain innovations 2016 -  strategic target setting in the supply chain...
Supply chain innovations 2016 - strategic target setting in the supply chain...
 

Similar to English - 3 - Financial benchmarking for inventory turns and working capital.

English - 5 - Strategic benchmarking in the supply chain triangle.
English - 5 - Strategic benchmarking in the supply chain triangle.English - 5 - Strategic benchmarking in the supply chain triangle.
English - 5 - Strategic benchmarking in the supply chain triangle.
Bram Desmet
 
All accounting instructionsWeek 2SEC 10K Assignment
The Bal.docx
All accounting instructionsWeek 2SEC 10K Assignment
The Bal.docxAll accounting instructionsWeek 2SEC 10K Assignment
The Bal.docx
All accounting instructionsWeek 2SEC 10K Assignment
The Bal.docx
nettletondevon
 
Financial interpretations with models & formats (unit 2)
Financial interpretations with models & formats (unit 2)Financial interpretations with models & formats (unit 2)
Financial interpretations with models & formats (unit 2)
Sas_Bala
 
Financial ratios
Financial ratiosFinancial ratios
Financial ratios
Preeti Malik
 
Financial interpretations with models & formats (unit 2)
Financial interpretations with models & formats (unit 2)Financial interpretations with models & formats (unit 2)
Financial interpretations with models & formats (unit 2)
finance1rkh
 
English - 1 - Balancing cash cost and service. The supply chain triangle.
English - 1 - Balancing cash cost and service. The supply chain triangle.English - 1 - Balancing cash cost and service. The supply chain triangle.
English - 1 - Balancing cash cost and service. The supply chain triangle.
Bram Desmet
 
Intercontinental Exchange -- Investment Analysis Report
Intercontinental Exchange -- Investment Analysis ReportIntercontinental Exchange -- Investment Analysis Report
Intercontinental Exchange -- Investment Analysis ReportNoah Deitch
 
Intercontinental Exchange -- Investment Analysis Report
Intercontinental Exchange -- Investment Analysis ReportIntercontinental Exchange -- Investment Analysis Report
Intercontinental Exchange -- Investment Analysis ReportNicolas Guerrieri
 
TEMPLATEFinancial Analysis Task 2Summary Report for Competit.docx
TEMPLATEFinancial Analysis Task 2Summary Report for Competit.docxTEMPLATEFinancial Analysis Task 2Summary Report for Competit.docx
TEMPLATEFinancial Analysis Task 2Summary Report for Competit.docx
mattinsonjanel
 
Financial Ratios
Financial RatiosFinancial Ratios
Financial Ratios
Crystal Torres
 
Part 1-Financial Analysis.pptx.pdf
Part 1-Financial Analysis.pptx.pdfPart 1-Financial Analysis.pptx.pdf
Part 1-Financial Analysis.pptx.pdf
DMBonoan1
 
1. Our book mentions, An analyst could easily get lost in examini.docx
1. Our book mentions, An analyst could easily get lost in examini.docx1. Our book mentions, An analyst could easily get lost in examini.docx
1. Our book mentions, An analyst could easily get lost in examini.docx
jackiewalcutt
 
2 The Balance SheetLearning ObjectivesAfter reading th.docx
2 The Balance SheetLearning ObjectivesAfter reading th.docx2 The Balance SheetLearning ObjectivesAfter reading th.docx
2 The Balance SheetLearning ObjectivesAfter reading th.docx
jesusamckone
 
Analysis and interpretation of ratios
Analysis and interpretation of ratiosAnalysis and interpretation of ratios
Analysis and interpretation of ratios
Babasab Patil
 
Analysis Based on the above factual data collected and complied
 Analysis Based on the above factual data collected and complied Analysis Based on the above factual data collected and complied
Analysis Based on the above factual data collected and complied
MargaritoWhitt221
 
Analysis staments @ bec doms chapter17[1]
Analysis staments @ bec doms chapter17[1]Analysis staments @ bec doms chapter17[1]
Analysis staments @ bec doms chapter17[1]
Babasab Patil
 
StarbucksLiquidity RatiosCurrent ratio2015Ratio2014RatioCurrent As.docx
StarbucksLiquidity RatiosCurrent ratio2015Ratio2014RatioCurrent As.docxStarbucksLiquidity RatiosCurrent ratio2015Ratio2014RatioCurrent As.docx
StarbucksLiquidity RatiosCurrent ratio2015Ratio2014RatioCurrent As.docx
whitneyleman54422
 
Operating Ratios asPerformanceMeasure s 11C H A P T E RTHE.docx
Operating Ratios asPerformanceMeasure s 11C H A P T E RTHE.docxOperating Ratios asPerformanceMeasure s 11C H A P T E RTHE.docx
Operating Ratios asPerformanceMeasure s 11C H A P T E RTHE.docx
hopeaustin33688
 
Chap001
Chap001Chap001
Chap001
Hang Dang
 

Similar to English - 3 - Financial benchmarking for inventory turns and working capital. (20)

English - 5 - Strategic benchmarking in the supply chain triangle.
English - 5 - Strategic benchmarking in the supply chain triangle.English - 5 - Strategic benchmarking in the supply chain triangle.
English - 5 - Strategic benchmarking in the supply chain triangle.
 
All accounting instructionsWeek 2SEC 10K Assignment
The Bal.docx
All accounting instructionsWeek 2SEC 10K Assignment
The Bal.docxAll accounting instructionsWeek 2SEC 10K Assignment
The Bal.docx
All accounting instructionsWeek 2SEC 10K Assignment
The Bal.docx
 
Chap002
Chap002Chap002
Chap002
 
Financial interpretations with models & formats (unit 2)
Financial interpretations with models & formats (unit 2)Financial interpretations with models & formats (unit 2)
Financial interpretations with models & formats (unit 2)
 
Financial ratios
Financial ratiosFinancial ratios
Financial ratios
 
Financial interpretations with models & formats (unit 2)
Financial interpretations with models & formats (unit 2)Financial interpretations with models & formats (unit 2)
Financial interpretations with models & formats (unit 2)
 
English - 1 - Balancing cash cost and service. The supply chain triangle.
English - 1 - Balancing cash cost and service. The supply chain triangle.English - 1 - Balancing cash cost and service. The supply chain triangle.
English - 1 - Balancing cash cost and service. The supply chain triangle.
 
Intercontinental Exchange -- Investment Analysis Report
Intercontinental Exchange -- Investment Analysis ReportIntercontinental Exchange -- Investment Analysis Report
Intercontinental Exchange -- Investment Analysis Report
 
Intercontinental Exchange -- Investment Analysis Report
Intercontinental Exchange -- Investment Analysis ReportIntercontinental Exchange -- Investment Analysis Report
Intercontinental Exchange -- Investment Analysis Report
 
TEMPLATEFinancial Analysis Task 2Summary Report for Competit.docx
TEMPLATEFinancial Analysis Task 2Summary Report for Competit.docxTEMPLATEFinancial Analysis Task 2Summary Report for Competit.docx
TEMPLATEFinancial Analysis Task 2Summary Report for Competit.docx
 
Financial Ratios
Financial RatiosFinancial Ratios
Financial Ratios
 
Part 1-Financial Analysis.pptx.pdf
Part 1-Financial Analysis.pptx.pdfPart 1-Financial Analysis.pptx.pdf
Part 1-Financial Analysis.pptx.pdf
 
1. Our book mentions, An analyst could easily get lost in examini.docx
1. Our book mentions, An analyst could easily get lost in examini.docx1. Our book mentions, An analyst could easily get lost in examini.docx
1. Our book mentions, An analyst could easily get lost in examini.docx
 
2 The Balance SheetLearning ObjectivesAfter reading th.docx
2 The Balance SheetLearning ObjectivesAfter reading th.docx2 The Balance SheetLearning ObjectivesAfter reading th.docx
2 The Balance SheetLearning ObjectivesAfter reading th.docx
 
Analysis and interpretation of ratios
Analysis and interpretation of ratiosAnalysis and interpretation of ratios
Analysis and interpretation of ratios
 
Analysis Based on the above factual data collected and complied
 Analysis Based on the above factual data collected and complied Analysis Based on the above factual data collected and complied
Analysis Based on the above factual data collected and complied
 
Analysis staments @ bec doms chapter17[1]
Analysis staments @ bec doms chapter17[1]Analysis staments @ bec doms chapter17[1]
Analysis staments @ bec doms chapter17[1]
 
StarbucksLiquidity RatiosCurrent ratio2015Ratio2014RatioCurrent As.docx
StarbucksLiquidity RatiosCurrent ratio2015Ratio2014RatioCurrent As.docxStarbucksLiquidity RatiosCurrent ratio2015Ratio2014RatioCurrent As.docx
StarbucksLiquidity RatiosCurrent ratio2015Ratio2014RatioCurrent As.docx
 
Operating Ratios asPerformanceMeasure s 11C H A P T E RTHE.docx
Operating Ratios asPerformanceMeasure s 11C H A P T E RTHE.docxOperating Ratios asPerformanceMeasure s 11C H A P T E RTHE.docx
Operating Ratios asPerformanceMeasure s 11C H A P T E RTHE.docx
 
Chap001
Chap001Chap001
Chap001
 

More from Bram Desmet

Driehoeks dillema voorraden duurzaam verminderen
Driehoeks dillema voorraden duurzaam verminderenDriehoeks dillema voorraden duurzaam verminderen
Driehoeks dillema voorraden duurzaam verminderen
Bram Desmet
 
Supply chain strategy and financial metrics 20180314
Supply chain strategy and financial metrics 20180314Supply chain strategy and financial metrics 20180314
Supply chain strategy and financial metrics 20180314
Bram Desmet
 
Supply chain strategy and financial metrics 20180118
Supply chain strategy and financial metrics 20180118Supply chain strategy and financial metrics 20180118
Supply chain strategy and financial metrics 20180118
Bram Desmet
 
Supply chain strategy and financial metrics 20171213
Supply chain strategy and financial metrics 20171213Supply chain strategy and financial metrics 20171213
Supply chain strategy and financial metrics 20171213
Bram Desmet
 
Sc mba in 3 days - ICT & Logistiek Utrecht - supply chain triangle 20171129
Sc mba in 3 days - ICT & Logistiek Utrecht - supply chain triangle 20171129Sc mba in 3 days - ICT & Logistiek Utrecht - supply chain triangle 20171129
Sc mba in 3 days - ICT & Logistiek Utrecht - supply chain triangle 20171129
Bram Desmet
 
Supply chain management as THE source of value within and accross companies 2...
Supply chain management as THE source of value within and accross companies 2...Supply chain management as THE source of value within and accross companies 2...
Supply chain management as THE source of value within and accross companies 2...
Bram Desmet
 
The impact of business strategy on forecasting and forecast performance 20170319
The impact of business strategy on forecasting and forecast performance 20170319The impact of business strategy on forecasting and forecast performance 20170319
The impact of business strategy on forecasting and forecast performance 20170319
Bram Desmet
 
How to define a supply chain strategy 20170319
How to define a supply chain strategy 20170319How to define a supply chain strategy 20170319
How to define a supply chain strategy 20170319
Bram Desmet
 
IN DUTCH - Using our holistic metrics framework to map your supply chain stra...
IN DUTCH - Using our holistic metrics framework to map your supply chain stra...IN DUTCH - Using our holistic metrics framework to map your supply chain stra...
IN DUTCH - Using our holistic metrics framework to map your supply chain stra...
Bram Desmet
 
IN DUTCH - A holistic metrics framework for your supply chain strategy
IN DUTCH - A holistic metrics framework for your supply chain strategyIN DUTCH - A holistic metrics framework for your supply chain strategy
IN DUTCH - A holistic metrics framework for your supply chain strategy
Bram Desmet
 
ISC europe 2016 - how much inventory do you really need? Inventory Target Set...
ISC europe 2016 - how much inventory do you really need? Inventory Target Set...ISC europe 2016 - how much inventory do you really need? Inventory Target Set...
ISC europe 2016 - how much inventory do you really need? Inventory Target Set...
Bram Desmet
 
5 Questions for Lora Cecere on the Metrics That Matter - Supply Chain Innovat...
5 Questions for Lora Cecere on the Metrics That Matter - Supply Chain Innovat...5 Questions for Lora Cecere on the Metrics That Matter - Supply Chain Innovat...
5 Questions for Lora Cecere on the Metrics That Matter - Supply Chain Innovat...
Bram Desmet
 
IN DUTCH - Driehoeksdillema voorraden duurzaam verminderen. dillema in the ...
IN DUTCH - Driehoeksdillema   voorraden duurzaam verminderen. dillema in the ...IN DUTCH - Driehoeksdillema   voorraden duurzaam verminderen. dillema in the ...
IN DUTCH - Driehoeksdillema voorraden duurzaam verminderen. dillema in the ...
Bram Desmet
 
IN DUTCH - strategic benchmarking in the supply chain triangle 201601
IN DUTCH - strategic benchmarking in the supply chain triangle 201601IN DUTCH - strategic benchmarking in the supply chain triangle 201601
IN DUTCH - strategic benchmarking in the supply chain triangle 201601
Bram Desmet
 
Dutch - Linking the supply chain triangle to strategy.
Dutch - Linking the supply chain triangle to strategy.Dutch - Linking the supply chain triangle to strategy.
Dutch - Linking the supply chain triangle to strategy.
Bram Desmet
 
DUTCH - balancing service, cost and cash
DUTCH - balancing service, cost and cashDUTCH - balancing service, cost and cash
DUTCH - balancing service, cost and cash
Bram Desmet
 
My vision for supply chain 2020. Deep integration!
My vision for supply chain 2020. Deep integration!My vision for supply chain 2020. Deep integration!
My vision for supply chain 2020. Deep integration!
Bram Desmet
 
Lora cecere - all the metrics must be in balance - supply chain movement - ap...
Lora cecere - all the metrics must be in balance - supply chain movement - ap...Lora cecere - all the metrics must be in balance - supply chain movement - ap...
Lora cecere - all the metrics must be in balance - supply chain movement - ap...
Bram Desmet
 
@vlerick webinar #supplychain #metricsthatmatter @bram_desmet and @lcecere
@vlerick webinar #supplychain #metricsthatmatter @bram_desmet and @lcecere@vlerick webinar #supplychain #metricsthatmatter @bram_desmet and @lcecere
@vlerick webinar #supplychain #metricsthatmatter @bram_desmet and @lcecere
Bram Desmet
 

More from Bram Desmet (19)

Driehoeks dillema voorraden duurzaam verminderen
Driehoeks dillema voorraden duurzaam verminderenDriehoeks dillema voorraden duurzaam verminderen
Driehoeks dillema voorraden duurzaam verminderen
 
Supply chain strategy and financial metrics 20180314
Supply chain strategy and financial metrics 20180314Supply chain strategy and financial metrics 20180314
Supply chain strategy and financial metrics 20180314
 
Supply chain strategy and financial metrics 20180118
Supply chain strategy and financial metrics 20180118Supply chain strategy and financial metrics 20180118
Supply chain strategy and financial metrics 20180118
 
Supply chain strategy and financial metrics 20171213
Supply chain strategy and financial metrics 20171213Supply chain strategy and financial metrics 20171213
Supply chain strategy and financial metrics 20171213
 
Sc mba in 3 days - ICT & Logistiek Utrecht - supply chain triangle 20171129
Sc mba in 3 days - ICT & Logistiek Utrecht - supply chain triangle 20171129Sc mba in 3 days - ICT & Logistiek Utrecht - supply chain triangle 20171129
Sc mba in 3 days - ICT & Logistiek Utrecht - supply chain triangle 20171129
 
Supply chain management as THE source of value within and accross companies 2...
Supply chain management as THE source of value within and accross companies 2...Supply chain management as THE source of value within and accross companies 2...
Supply chain management as THE source of value within and accross companies 2...
 
The impact of business strategy on forecasting and forecast performance 20170319
The impact of business strategy on forecasting and forecast performance 20170319The impact of business strategy on forecasting and forecast performance 20170319
The impact of business strategy on forecasting and forecast performance 20170319
 
How to define a supply chain strategy 20170319
How to define a supply chain strategy 20170319How to define a supply chain strategy 20170319
How to define a supply chain strategy 20170319
 
IN DUTCH - Using our holistic metrics framework to map your supply chain stra...
IN DUTCH - Using our holistic metrics framework to map your supply chain stra...IN DUTCH - Using our holistic metrics framework to map your supply chain stra...
IN DUTCH - Using our holistic metrics framework to map your supply chain stra...
 
IN DUTCH - A holistic metrics framework for your supply chain strategy
IN DUTCH - A holistic metrics framework for your supply chain strategyIN DUTCH - A holistic metrics framework for your supply chain strategy
IN DUTCH - A holistic metrics framework for your supply chain strategy
 
ISC europe 2016 - how much inventory do you really need? Inventory Target Set...
ISC europe 2016 - how much inventory do you really need? Inventory Target Set...ISC europe 2016 - how much inventory do you really need? Inventory Target Set...
ISC europe 2016 - how much inventory do you really need? Inventory Target Set...
 
5 Questions for Lora Cecere on the Metrics That Matter - Supply Chain Innovat...
5 Questions for Lora Cecere on the Metrics That Matter - Supply Chain Innovat...5 Questions for Lora Cecere on the Metrics That Matter - Supply Chain Innovat...
5 Questions for Lora Cecere on the Metrics That Matter - Supply Chain Innovat...
 
IN DUTCH - Driehoeksdillema voorraden duurzaam verminderen. dillema in the ...
IN DUTCH - Driehoeksdillema   voorraden duurzaam verminderen. dillema in the ...IN DUTCH - Driehoeksdillema   voorraden duurzaam verminderen. dillema in the ...
IN DUTCH - Driehoeksdillema voorraden duurzaam verminderen. dillema in the ...
 
IN DUTCH - strategic benchmarking in the supply chain triangle 201601
IN DUTCH - strategic benchmarking in the supply chain triangle 201601IN DUTCH - strategic benchmarking in the supply chain triangle 201601
IN DUTCH - strategic benchmarking in the supply chain triangle 201601
 
Dutch - Linking the supply chain triangle to strategy.
Dutch - Linking the supply chain triangle to strategy.Dutch - Linking the supply chain triangle to strategy.
Dutch - Linking the supply chain triangle to strategy.
 
DUTCH - balancing service, cost and cash
DUTCH - balancing service, cost and cashDUTCH - balancing service, cost and cash
DUTCH - balancing service, cost and cash
 
My vision for supply chain 2020. Deep integration!
My vision for supply chain 2020. Deep integration!My vision for supply chain 2020. Deep integration!
My vision for supply chain 2020. Deep integration!
 
Lora cecere - all the metrics must be in balance - supply chain movement - ap...
Lora cecere - all the metrics must be in balance - supply chain movement - ap...Lora cecere - all the metrics must be in balance - supply chain movement - ap...
Lora cecere - all the metrics must be in balance - supply chain movement - ap...
 
@vlerick webinar #supplychain #metricsthatmatter @bram_desmet and @lcecere
@vlerick webinar #supplychain #metricsthatmatter @bram_desmet and @lcecere@vlerick webinar #supplychain #metricsthatmatter @bram_desmet and @lcecere
@vlerick webinar #supplychain #metricsthatmatter @bram_desmet and @lcecere
 

Recently uploaded

Filing Your Delaware Franchise Tax A Detailed Guide
Filing Your Delaware Franchise Tax A Detailed GuideFiling Your Delaware Franchise Tax A Detailed Guide
Filing Your Delaware Franchise Tax A Detailed Guide
YourLegal Accounting
 
April 2024 Nostalgia Products Newsletter
April 2024 Nostalgia Products NewsletterApril 2024 Nostalgia Products Newsletter
April 2024 Nostalgia Products Newsletter
NathanBaughman3
 
RMD24 | Retail media: hoe zet je dit in als je geen AH of Unilever bent? Heid...
RMD24 | Retail media: hoe zet je dit in als je geen AH of Unilever bent? Heid...RMD24 | Retail media: hoe zet je dit in als je geen AH of Unilever bent? Heid...
RMD24 | Retail media: hoe zet je dit in als je geen AH of Unilever bent? Heid...
BBPMedia1
 
Cracking the Workplace Discipline Code Main.pptx
Cracking the Workplace Discipline Code Main.pptxCracking the Workplace Discipline Code Main.pptx
Cracking the Workplace Discipline Code Main.pptx
Workforce Group
 
India Orthopedic Devices Market: Unlocking Growth Secrets, Trends and Develop...
India Orthopedic Devices Market: Unlocking Growth Secrets, Trends and Develop...India Orthopedic Devices Market: Unlocking Growth Secrets, Trends and Develop...
India Orthopedic Devices Market: Unlocking Growth Secrets, Trends and Develop...
Kumar Satyam
 
Premium MEAN Stack Development Solutions for Modern Businesses
Premium MEAN Stack Development Solutions for Modern BusinessesPremium MEAN Stack Development Solutions for Modern Businesses
Premium MEAN Stack Development Solutions for Modern Businesses
SynapseIndia
 
Putting the SPARK into Virtual Training.pptx
Putting the SPARK into Virtual Training.pptxPutting the SPARK into Virtual Training.pptx
Putting the SPARK into Virtual Training.pptx
Cynthia Clay
 
RMD24 | Debunking the non-endemic revenue myth Marvin Vacquier Droop | First ...
RMD24 | Debunking the non-endemic revenue myth Marvin Vacquier Droop | First ...RMD24 | Debunking the non-endemic revenue myth Marvin Vacquier Droop | First ...
RMD24 | Debunking the non-endemic revenue myth Marvin Vacquier Droop | First ...
BBPMedia1
 
Meas_Dylan_DMBS_PB1_2024-05XX_Revised.pdf
Meas_Dylan_DMBS_PB1_2024-05XX_Revised.pdfMeas_Dylan_DMBS_PB1_2024-05XX_Revised.pdf
Meas_Dylan_DMBS_PB1_2024-05XX_Revised.pdf
dylandmeas
 
Introduction to Amazon company 111111111111
Introduction to Amazon company 111111111111Introduction to Amazon company 111111111111
Introduction to Amazon company 111111111111
zoyaansari11365
 
Taurus Zodiac Sign_ Personality Traits and Sign Dates.pptx
Taurus Zodiac Sign_ Personality Traits and Sign Dates.pptxTaurus Zodiac Sign_ Personality Traits and Sign Dates.pptx
Taurus Zodiac Sign_ Personality Traits and Sign Dates.pptx
my Pandit
 
Affordable Stationery Printing Services in Jaipur | Navpack n Print
Affordable Stationery Printing Services in Jaipur | Navpack n PrintAffordable Stationery Printing Services in Jaipur | Navpack n Print
Affordable Stationery Printing Services in Jaipur | Navpack n Print
Navpack & Print
 
Digital Transformation in PLM - WHAT and HOW - for distribution.pdf
Digital Transformation in PLM - WHAT and HOW - for distribution.pdfDigital Transformation in PLM - WHAT and HOW - for distribution.pdf
Digital Transformation in PLM - WHAT and HOW - for distribution.pdf
Jos Voskuil
 
The-McKinsey-7S-Framework. strategic management
The-McKinsey-7S-Framework. strategic managementThe-McKinsey-7S-Framework. strategic management
The-McKinsey-7S-Framework. strategic management
Bojamma2
 
Maksym Vyshnivetskyi: PMO Quality Management (UA)
Maksym Vyshnivetskyi: PMO Quality Management (UA)Maksym Vyshnivetskyi: PMO Quality Management (UA)
Maksym Vyshnivetskyi: PMO Quality Management (UA)
Lviv Startup Club
 
Role of Remote Sensing and Monitoring in Mining
Role of Remote Sensing and Monitoring in MiningRole of Remote Sensing and Monitoring in Mining
Role of Remote Sensing and Monitoring in Mining
Naaraayani Minerals Pvt.Ltd
 
Buy Verified PayPal Account | Buy Google 5 Star Reviews
Buy Verified PayPal Account | Buy Google 5 Star ReviewsBuy Verified PayPal Account | Buy Google 5 Star Reviews
Buy Verified PayPal Account | Buy Google 5 Star Reviews
usawebmarket
 
anas about venice for grade 6f about venice
anas about venice for grade 6f about veniceanas about venice for grade 6f about venice
anas about venice for grade 6f about venice
anasabutalha2013
 
FINAL PRESENTATION.pptx12143241324134134
FINAL PRESENTATION.pptx12143241324134134FINAL PRESENTATION.pptx12143241324134134
FINAL PRESENTATION.pptx12143241324134134
LR1709MUSIC
 
Global Interconnection Group Joint Venture[960] (1).pdf
Global Interconnection Group Joint Venture[960] (1).pdfGlobal Interconnection Group Joint Venture[960] (1).pdf
Global Interconnection Group Joint Venture[960] (1).pdf
Henry Tapper
 

Recently uploaded (20)

Filing Your Delaware Franchise Tax A Detailed Guide
Filing Your Delaware Franchise Tax A Detailed GuideFiling Your Delaware Franchise Tax A Detailed Guide
Filing Your Delaware Franchise Tax A Detailed Guide
 
April 2024 Nostalgia Products Newsletter
April 2024 Nostalgia Products NewsletterApril 2024 Nostalgia Products Newsletter
April 2024 Nostalgia Products Newsletter
 
RMD24 | Retail media: hoe zet je dit in als je geen AH of Unilever bent? Heid...
RMD24 | Retail media: hoe zet je dit in als je geen AH of Unilever bent? Heid...RMD24 | Retail media: hoe zet je dit in als je geen AH of Unilever bent? Heid...
RMD24 | Retail media: hoe zet je dit in als je geen AH of Unilever bent? Heid...
 
Cracking the Workplace Discipline Code Main.pptx
Cracking the Workplace Discipline Code Main.pptxCracking the Workplace Discipline Code Main.pptx
Cracking the Workplace Discipline Code Main.pptx
 
India Orthopedic Devices Market: Unlocking Growth Secrets, Trends and Develop...
India Orthopedic Devices Market: Unlocking Growth Secrets, Trends and Develop...India Orthopedic Devices Market: Unlocking Growth Secrets, Trends and Develop...
India Orthopedic Devices Market: Unlocking Growth Secrets, Trends and Develop...
 
Premium MEAN Stack Development Solutions for Modern Businesses
Premium MEAN Stack Development Solutions for Modern BusinessesPremium MEAN Stack Development Solutions for Modern Businesses
Premium MEAN Stack Development Solutions for Modern Businesses
 
Putting the SPARK into Virtual Training.pptx
Putting the SPARK into Virtual Training.pptxPutting the SPARK into Virtual Training.pptx
Putting the SPARK into Virtual Training.pptx
 
RMD24 | Debunking the non-endemic revenue myth Marvin Vacquier Droop | First ...
RMD24 | Debunking the non-endemic revenue myth Marvin Vacquier Droop | First ...RMD24 | Debunking the non-endemic revenue myth Marvin Vacquier Droop | First ...
RMD24 | Debunking the non-endemic revenue myth Marvin Vacquier Droop | First ...
 
Meas_Dylan_DMBS_PB1_2024-05XX_Revised.pdf
Meas_Dylan_DMBS_PB1_2024-05XX_Revised.pdfMeas_Dylan_DMBS_PB1_2024-05XX_Revised.pdf
Meas_Dylan_DMBS_PB1_2024-05XX_Revised.pdf
 
Introduction to Amazon company 111111111111
Introduction to Amazon company 111111111111Introduction to Amazon company 111111111111
Introduction to Amazon company 111111111111
 
Taurus Zodiac Sign_ Personality Traits and Sign Dates.pptx
Taurus Zodiac Sign_ Personality Traits and Sign Dates.pptxTaurus Zodiac Sign_ Personality Traits and Sign Dates.pptx
Taurus Zodiac Sign_ Personality Traits and Sign Dates.pptx
 
Affordable Stationery Printing Services in Jaipur | Navpack n Print
Affordable Stationery Printing Services in Jaipur | Navpack n PrintAffordable Stationery Printing Services in Jaipur | Navpack n Print
Affordable Stationery Printing Services in Jaipur | Navpack n Print
 
Digital Transformation in PLM - WHAT and HOW - for distribution.pdf
Digital Transformation in PLM - WHAT and HOW - for distribution.pdfDigital Transformation in PLM - WHAT and HOW - for distribution.pdf
Digital Transformation in PLM - WHAT and HOW - for distribution.pdf
 
The-McKinsey-7S-Framework. strategic management
The-McKinsey-7S-Framework. strategic managementThe-McKinsey-7S-Framework. strategic management
The-McKinsey-7S-Framework. strategic management
 
Maksym Vyshnivetskyi: PMO Quality Management (UA)
Maksym Vyshnivetskyi: PMO Quality Management (UA)Maksym Vyshnivetskyi: PMO Quality Management (UA)
Maksym Vyshnivetskyi: PMO Quality Management (UA)
 
Role of Remote Sensing and Monitoring in Mining
Role of Remote Sensing and Monitoring in MiningRole of Remote Sensing and Monitoring in Mining
Role of Remote Sensing and Monitoring in Mining
 
Buy Verified PayPal Account | Buy Google 5 Star Reviews
Buy Verified PayPal Account | Buy Google 5 Star ReviewsBuy Verified PayPal Account | Buy Google 5 Star Reviews
Buy Verified PayPal Account | Buy Google 5 Star Reviews
 
anas about venice for grade 6f about venice
anas about venice for grade 6f about veniceanas about venice for grade 6f about venice
anas about venice for grade 6f about venice
 
FINAL PRESENTATION.pptx12143241324134134
FINAL PRESENTATION.pptx12143241324134134FINAL PRESENTATION.pptx12143241324134134
FINAL PRESENTATION.pptx12143241324134134
 
Global Interconnection Group Joint Venture[960] (1).pdf
Global Interconnection Group Joint Venture[960] (1).pdfGlobal Interconnection Group Joint Venture[960] (1).pdf
Global Interconnection Group Joint Venture[960] (1).pdf
 

English - 3 - Financial benchmarking for inventory turns and working capital.

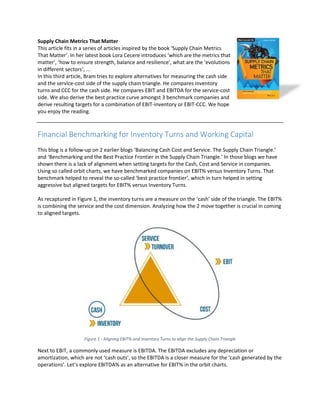
  • 1. Supply Chain Metrics That Matter This article fits in a series of articles inspired by the book ‘Supply Chain Metrics That Matter’. In her latest book Lora Cecere introduces ‘which are the metrics that matter’, ‘how to ensure strength, balance and resilience’, what are the ‘evolutions in different sectors’, … In this third article, Bram tries to explore alternatives for measuring the cash side and the service-cost side of the supply chain triangle. He compares inventory turns and CCC for the cash side. He compares EBIT and EBITDA for the service-cost side. We also derive the best practice curve amongst 3 benchmark companies and derive resulting targets for a combination of EBIT-inventory or EBIT-CCC. We hope you enjoy the reading. Financial Benchmarking for Inventory Turns and Working Capital This blog is a follow-up on 2 earlier blogs ‘Balancing Cash Cost and Service. The Supply Chain Triangle.’ and ‘Benchmarking and the Best Practice Frontier in the Supply Chain Triangle.’ In those blogs we have shown there is a lack of alignment when setting targets for the Cash, Cost and Service in companies. Using so called orbit charts, we have benchmarked companies on EBIT% versus Inventory Turns. That benchmark helped to reveal the so-called ‘best practice frontier’, which in turn helped in setting aggressive but aligned targets for EBIT% versus Inventory Turns. As recaptured in Figure 1, the inventory turns are a measure on the ‘cash’ side of the triangle. The EBIT% is combining the service and the cost dimension. Analyzing how the 2 move together is crucial in coming to aligned targets. Figure 1 - Aligning EBIT% and Inventory Turns to align the Supply Chain Triangle Next to EBIT, a commonly used measure is EBITDA. The EBITDA excludes any depreciation or amortization, which are not ‘cash outs’, so the EBITDA is a closer measure for the ‘cash generated by the operations’. Let’s explore EBITDA% as an alternative for EBIT% in the orbit charts.
  • 2. Inventory is a part of working capital, together with the Accounts Payable and the Accounts Receivable. Lowering working capital generates cash. Working capital can be measured by the so-called ‘Cash Conversion Cycle’. Let’s explore the Cash Conversion Cycle as an alternative for the Inventory Turns in the orbit charts. Where EBIT or EBITDA per inventory $ or per working capital $ helps in getting meaningful benchmarks and aligned targets, they are not common financial metrics. We will close this blog by discussing the Return On Capital Employed or ROCE which is close to the EBIT% vs CCC, and which is a more common financial metric. Benchmarking EBITDA% versus Inventory Turns Figure 2 recaps the EBIT versus Inventory Turns for our 3 technology companies presented in the blog ‘Benchmarking and the Best Practice Frontier in the Supply Chain Triangle.’ In that blog we also discussed how Company 2 showed strength in inventory turns but was unbalanced with EBIT%. Both Company 1 and Company 3 get hit by the financial crisis but Company 1 shows a full rebound to pre- crisis profitability at better turns. It proves to be more resilient. Figure 2 - Orbit chart on 'EBIT%' versus 'Inventory Turns' for 3 competing technology companies Figure 3 compares EBITDA% versus inventory turns for the same 3 companies. EBITDA% is higher than the EBIT% as it does not account for the depreciations and the amortizations. There is a noticeable difference in the comparison of Company 1 and Company 3 for the 2 graphs. When comparing EBIT% Company 3 is clearly superior in the period 2004-2007. When comparing EBITDA% they seem to be closer.
  • 3. Figure 3 - Orbit chart on 'EBITDA%' versus 'Inventory Turns' for 3 competing technology companies The difference is not a performance but an accounting difference. There are 2 basic options to account for investments in R&D: - Either, we account for the R&D cost of the year, in the year itself. The R&D costs can be covered in the Selling, General and Adminstrative costs, or mentioned as a separate item, but in any case they are included ‘above’ the EBITDA line, so accounted for in the EBITDA. - Either, we ‘capitalize’ the R&D expense, and depreciate it over the lifetime of the corresponding products. In this case, the R&D costs are ‘below’ the EBITDA line, so not accounted for in the EBITDA, but mentioned as a depreciation cost below the EBITDA line. Figure 4 compares the EBIT% and the EBITDA% for our 3 companies. For company 1, the EBITDA is consistently higher than the EBIT. This has to do with the depreciation of the R&D costs. This company is using the second approach. It is because they follow the first accounting approach.
  • 4. Figure 4 - Comparing EBITDA% and EBIT% As a result the comparison in Figure 3 is not a fair comparison. 2 companies have accounted for the R&D costs in their EBITDA, company 1 has not. When benchmarking we need to be careful to compare apples to apples. Figure 2 is comparing apples to apples, all companies have accounted for R&D expenses. Figure 3 is comparing apples with pears, company 2 and 3 have accounted for R&D expenses where company 1 has not. Benchmarking EBIT% versus Cash Conversion Cycle Figure 5 shows an orbit chart for the EBIT% versus the Cash Conversion Cycle (CCC) for our 3 technology companies. The Cash Conversion Cycle is calculated as the Days Inventory On Hand (DIOH) + the Days of Sales Outstanding (DSO) – the Days of Payables Outstanding (DPO). Figure 5 - EBIT% versus Cash Conversion Cycle for 3 technology companies
  • 5. Where in Figure 2 we want to be on the ‘top right’ corner, high EBIT% and high inventory turns, in Figure 5 we want to be on the top left corner, high EBIT% and a low CCC corresponding with a low working capital. From Figure 5 we see that Company 3 has a low CCC but for a low profitability. It is comparable to our conclusion for Figure 2. It is strong in working capital management but unbalanced with a substandard profitability. From that same Figure 5 we see that Company 1 has done a good job in reducing it’s working capital while keeping the EBIT% at decent levels. 2014 was a bad year as the CCC increased and the EBIT% went down. The direction of 2010 – 2012 was a better one, decreasing CCC while increasing EBIT%. The company should look to regain that momentum. Company 3 looks struggling from Figure 5, EBIT% has come down, and CCC has increased. Going back to Figure 2 gives a comparable message. For 2012 Company 1 and Company 3 have a comparable EBIT% but Company 1 has a higher inventory turns. In general we expect the ‘Inventory Turns’ and the ‘CCC’ indeed to point in the same direction. When companies work on inventories, they are likely to do it for cash reasons so they also work on Payables and Receivables. Reveal the “Best Practice Frontier” for EBIT% versus CCC As we did in the previous blog ‘Benchmarking and the Best Practice Frontier in the Supply Chain Triangle.’ for EBIT% versus Inventory Turns, Figure 6 shows the Minimum, the Median and the Maximum “EBIT per working capital $” curves. It is OK to have more working capital, as long as the EBIT per working capital $ is higher. For Figure 6 we have taken the years with a Minimum, Median and Maximum EBIT per working capital $ for company 1. For each of these years we have shown the combination of EBIT% and CCC that would have led to the same EBIT per working capital $.
  • 6. Figure 6 - Minimum, Median, Maximum EBIT per invested dollar curves for Company 1 Figure 7 shows the same for Companies 2 and 3. The graph on the bottom right compares the median performance of the 3 companies. Figure 7 - Min/Med/Max EBIT% vs CCC for Companies 1, 2 and 3
  • 7. As we did in the previous blog ‘Benchmarking and the Best Practice Frontier in the Supply Chain Triangle’, the Median and the Maximum of Company 3 can again be used as a benchmark and for target setting. As shown in Figure 8, when going for the Median curve, the Company 1 should - Either return to a CCC of around 100 days for an EBIT% of around 6% - Either has to boost EBIT% back to 8% if it’s CCC stays around 130 days Figure 8 - Target Setting for Company 1 based on EBIT% vs CCC benchmarking analysis If we take it a couple of steps further, and go for the Maximum curve, Figure 9 shows that a stretched target for Company 1 would be to - Either further boost its performance to land ad a CCC of around 70 days for an EBIT of around 10% - Or either further boost its EBIT to around 20% for the current CCC of around 130 days Again, these targets seem overly aggressive but Company 3 has been close to that performance for 3 consecutive years. A detailed analysis of how they did should reveal opportunities for Company 1 to shift in that same direction. The 2 options also seem to go in quite opposite directions. As we will introduce in a next blog, we believe the choice of direction is one of the choice of strategy.
  • 8. Figure 9 - Stretched Target Setting for Company 1 based on EBIT% vs CCC benchmarking analysis The ROCE as a common financial metric spanning the Supply Chain Triangle. So far we have used the EBIT per inventory $ or per working capital $ as a metric spanning the supply chain triangle. Where these help to define a good benchmarking strategy for the Inventory Turns or the Cash Conversion Cycle, they are not common financial metrics. A more commonly used financial metric spanning the full Supply Chain Triangle is the Return On Capital Employed or the ROCE. The ROCE is defined as follows: EmployedCapital EBIT ROCE = With Capital Employed = Fixed Assets + Working Capital. The main difference with what we did so far is the Fixed Assets. The Fixed Assets can be told to be part of the ‘Cash’ part of the triangle. So this metric is clearly going beyond the Supply Chain Triangle. Figure 10 shows the ROCE evolution for our three benchmark companies. We come to comparable conclusions. Competitor 1 has below standard ROCE and seems to be in a prolonged period of trouble. Competitor 2 is doing well before and during the crisis but had difficulties to sustain that after the crisis period. Company 1 has improved its ROCE performance. From the previous analyses we know that the EBIT% has come down but so has the working capital, leading to an overall improvement in the profitability of the company.
  • 9. Figure 10 - ROCE evolution for 3 competing technology companies In conclusion, we need to take care to compare apples with apples when performing a benchmark. Benchmarking with inventory turns or with working capital gives comparable results, which is not too surprising. Benchmarking EBIT per inventory $ or per working capital $ allows balanced target setting. Though they are not common financial metrics, they point in the same direction as the ROCE, which is a more common financial metric. Dr. Bram Desmet is adjunct professor in Operations and Supply Chain at the Vlerick Business School. He obtained his Phd at Gent University on the topic of “Safety stock optimization in multi-echelon production-distribution networks”. He is working on a book on “Supply chain strategy” and “Managing Working Capital. As the Managing Director of Solventure and a Partner at MÖBIUS Consulting he helps global production and retail organizations in the domains of Strategy, Supply Chain and Operations. He welcomes your feedback at bram_desmet@solventure.eu