
More Related Content
What's hot
What's hot (20)
Similar to Amzn q2 20 learnings and the outlook for its business, retail, and our economy
Similar to Amzn q2 20 learnings and the outlook for its business, retail, and our economy (20)
More from thomas paulson
More from thomas paulson (20)
Amzn q2 20 learnings and the outlook for its business, retail, and our economy
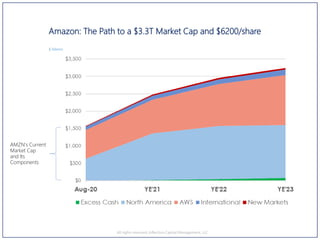
- 1. Amazon: The Path to a $3.3T Market Cap and $6200/share All rights reserved, Inflection Capital Management, LLC AMZN's Current Market Cap and Its Components $ billions
- 2. AM ZN SOTP YE-2023 2024 Valuation EBITDA M ultiple Value Comparable m illions billions North America $75,879 20.0 X $1,518 Costco & M icrosoft International $10,530 15.0 X $158 AWS $59,032 25.0 X $1,476 Salesforce New M arkets (Healthcare & Travel) $50 Subtotal $3,201 Plus Accrued Cash (FCFtill Valuation Date) $83 Less Net Debt incl leases $8 Market Cap / Equity Value $3,276 Shares outstanding at year-period 525 Per Share $6,240 Current Price $3,112 Compounded Return 19% 8.3.2020 Current SOTP YE-2020 2021 Valuation Consensus Estimates EBITDA M ultiple Value Comparable per FactSet m illions billions North America $22,000 28.5 X $627 International $100 AWS $33,000 25.0 X $825 Salesforce New M arkets Optionality $20 Subtotal $1,572 Plus Accrued Cash (FCFtill Valuation Date) $0 Less Net Debt incl leases $8 Market Cap / Equity Value $1,564 Shares outstanding at year-period 503 Per Share $3,109 8.3.2020 Decomposition of Amazon's Current Valuation In the table to the left, we break down AMZN's current $1.6T market cap into its various components via a sum-of-the-parts (SOTP) valuation. We then project these onto our divisional estimates for 2024 and arrive at a year-end-2023 value of $3.3T. The $3.3T projected value also includes all of the accumulated cash during the interim as well as value created (per our estimates) from Amazon's nascent healthcare business and synergies from acquiring Expedia. 1 Additional Comments: 1) In terms of comparables, for North America we use Costco and Microsoft given their subscription and services business models. Both currently trade at ~20X NTM EV/EBITDA. Amazon North America is currently growing faster than both; however, by 2024 its growth will likely to be similar to these comparables. Salesforce and other SAS company's typically trade at 6X sales and 25X EV/EBITDA; while, Salesforce and AWS have similar revenue growth, AWS converts more revenue into free cash flow (FCF). 2) As we have shown earlier work, there is business progress and value in Amazon's International developed market businesses. However, given abysmal disclosure and heavy losses in India, Brazil, and other new market, it's hard to render a high-confidence opinion about the segment's valuation. Our forecast assumes that these issues are ameliorated by 2023 and that profitability shows through as the result of higher Prime and advertising revenue, and that fixed costs leverage in the developing market. 3) We believe that Amazon International will never develop a competitive position similar to what it enjoys in North America; however, given the progress and management's comments we increased the "value of optionality" for the International business and increased the multiple to 15X from 10X. 4) Wall Street places some "optionality value" on AMZN for future new businesses and markets. We questimate $20B currently. However, we expect that option value to significantly increase over the next four years based upon travel and healthcare, and questimate that value will increase to $50B by YE-23. 1 3 4 2 Allrightsreserved,InflectionCapitalManagement,LLC 2
- 3. Key Questions and Take-Aways from AMZN Q2 Results: 1) What are the key learnings from Q2? Improvements in Prime gross additions in the US strongly suggest that it is expanding into new, previously elusive consumer segments. Those are likely moderate-income households and with older Americans. Management also noted more activity and accelerating membership growth overseas as well. NA GMV growth of $30B YoY was 2X Q1's sales volume growth. Guidance suggests around $24B in Q3. For comparison, Amazon's peer set (Walmart-US, Target, Costco, Dicks, Hobby Lobby, etc.) grew volume by $30B in Q1 and $38B in Q2. Walmart-US, Target, and Costco-US combined are expected to grow volume by ~$11B in Q2. Guidance is for robust growth in Q3 of ~29% w/ an implied NA GMV growth rate of +40%. However, watch "what Amazon does, not what is says". Guidance is also for an increase of 50% for FC/shipping capacity by the end of Q3. Said differently, management is planning for up to 50% growth in Q4. Why might that happen? A: another round of fiscal stimulus + continued COVID-restrictions + massive brick & mortar closures. Q2 lease-adjusted-FCF increased $7B YoY to $11B and is 12.6% of revenue (vs. 6.6% in Q2'19) due to getting greater leverage on fixed expenses (improved incremental margins), a significant work-down of inventories, and lower advertising and T&E spend. For example, marketing expense was roughly flat YoY. Moreover, the $7B also included $4B in 1-off Covid-19 costs and substantial other inefficiencies for 1D, at the FCs, etc. 2) Do these results and our outlook of the new Post-C19-World suggest a different free-cash-flow outlook for Amazon? A: Yes. We now think that Amazon will be able to: o Gain more market share in the US and overseas than our previous forecasts and at higher merchandise margins due to fewer brick & mortar competitors and a larger number of loyal Prime members, o Remove some expense from their business such as office space (permanent WFH for some employees), o Turn inventory faster than we previously had forecasted. --> As such we are increasing our FCF estimates and but maintaining the medium-term price objective for the stock as the variability for out-year is wide and 2X upside is adequately interesting for anyone holding the stock. All rights reserved, Inflection Capital Management, LLC 3
- 4. Key Questions and Take-Aways from AMZN Q2 Results: 3) What are the learnings from the results in terms of the overall industry and our economy as a whole? A: Amazon's capture of increased share certainly "sucks more air out of the room" (or to twist this expression into a COVID allusion, "sucks the air out of the ECMO machine") for non-well capitalized, structurally disadvantaged retail dealing with the industry's structural changes and COVID. Moreover, the expansion of Prime households (HHs) indicates increased competition for certain retailers previously loyal consumer base such as the >65-age cohort and the moderate-income consumer. Walmart would certainly be in this set. Clearly Walmart is moving much faster these days in making decision and executing better. This quarter we have seen a quickening of the role-out of healthcare services, solid results from curbside and its 3P marketplace, the rumors of Walmart+, etc.--all of which also sucks-the-air-out from competitors. Thus, the competitive bar is higher for all and the gap between winners and losers has massively widened. All of this means that more SMB merchants are going to drift more towards using Shopify and 3P marketplaces. It means that more brick & mortar locations will fall and more online locations will rise. As such, owner and employee skill sets will need to change and the dislocations and unfairness will be severe. Where does one transition after selling men's suits at JC Penney after 20 years? Or selling furniture at Macy's for 30 years? Yes, perhaps to Target, Walmart, or Kroger but there is likely going to be a large mismatch; the redistribution of labor is going to leave many underemployed or never- employed again. Hopefully, national policy makers are cognizant of this and willing to increase unemployment and worker support programs for an "extended medium-term." Additionally, all of this also makes it likely that a lot of PE-owned retail with excessive leverage is also going to enter bankruptcy (hopefully the judges are wise to zero-out the debt as well), which we are seeing daily. Moreover, the "value of the dirt" will materially decline, i.e. real estate values and rent. As this last happens, it will allow for space to be re- imagined and re-crafted. Consumer offerings that previously couldn't produce attractive economics due to the high price of rent, will now find a sustainable business model. Space that previously demanded high sales densities to pay high debt servicing costs may be "liberated" from such debt-servitude and be allowed to "open up" with more green space, park features, expanded-out food halls, etc. Not only do such spaces better fit with on-going consumer trends (that have been reinforced by COVID), they are also potentially more inclusive of a broader set of household incomes because they are not "forced" to demand such a high "entrance" price for participation. 4 All rights reserved, Inflection Capital Management, LLC
- 6. Key Questions and Take-Aways from AMZN Q1 Results: 4) Amazon's largest internal risk is hiring and employee retention. Does the medium-term still look benign? A: Despite all the C-19 hiring challenges, Amazon was able to onboard a net 36K employees in the quarter vs. 23K in Q2'19; moreover, of the >125K temporary workers that are not included in their total 877K head count, Amazon announced that they were going to transition 125K of these into FTE. Moreover, their release comments "we've created over 175K new jobs since March." As such, of these 175K, 36K of were FTE and 89K were contractors. While we don't know the typical use of contractors by Amazon, the sizable 89K figure indicates that it is a material component of their staffing practices. To conclude, their ability to hire appears un-diminished and the risk of not being able to attract a sufficient number of workers to meet consumer demands appears significantly more benign given the nation's high unemployment rate and the large number of disrupted service industries. 5) What medium-term changes will Amazon make to its portfolio? A: We continue to believe that Amazon will spin AWS during 2021 (see prior reports) as the spin allows Amazon to lower its political profile and segment the value creation. North America is now cash generative and no longer dependent upon AWS' cash generation. Previously, we believed that Amazon would acquire Expedia. However, given all that is happening around Amazon and with C19, we don't see that in the near-term; longer-term, it still is still a compelling combination from a strategic perspective and very financially accretive. See here. 6) Any changes in our outlook for AWS? A: COVID-disrupted industries now have significantly lower workloads which has resulted in an industry-wide slowdown. In the medium-term, distributed computing, digitization, agility, spin-up -down have all become more critical, and thus, the S-curve of adoption just became materially steeper and likely higher. Thus, AWS' value materially increased. 7) Any change in the outlook for Prime? A: Prime additions and consumption were robust. In terms of video, we do not know if their pipeline is full for the near- term. Management did not address how it is adjusting for the production stoppages. Content costs for Digital Video and Music Content increased by $1B YoY to $2.8B, which are larger than NFLX's $400m YoY to $2.6B! Allrightsreserved,InflectionCapitalManagement,LLC 6
- 7. Perspective on Amazon's Total Revenue & Guidance 7All rights reserved, Inflection Capital Management, LLC Growth driven by higher frequency of buying and more Prime members. Orders / Prime, categories / Prime, and basket size all up. Q1 19 Q2 '19 Q3 '19 Q4 '19 2019 Q1 '20 Q2 '20 Q3 '20 Online Stores $29,498 $31,053 $35,039 $45,657 $141,247 $36,652 $45,896 $49,055 fx Neutral Growth 12% 16% 22% 15% 25% 50% 40% Rpt Growth 14% 21% 15% 24% 49% 40% Physical Stores $4,307 $4,330 $4,192 $4,363 $17,192 $4,640 $3,774 $4,192 fx Neutral Growth 1% Rpt Growth 0% -1% -1% 8% -13% 0% 3rd Party Services $11,141 $11,962 $13,212 $17,446 $53,761 $14,479 $18,195 $18,497 % of non-AWSrevenue fx Neutral Growth 23% 25% 28% 31% 31% 53% 40% Rpt Growth 23% 27% 30% 30% 52% 40% fx Neutral $Growth $2,131 $2,426 $2,911 $4,149 $3,454 $6,317 $5,311 Growth Factor 0.8 x 1.0 x 1.1 x 1.4 x 1.6 x 2.6 x 1.8 x Subscription Services $4,342 $4,676 $4,957 $5,235 $19,210 $5,556 $6,018 $6,593 fx Neutral Growth 42% 39% 35% 32% 29% 30% 33% Rpt Growth 37% 34% 32% 28% 29% 33% fx Neutral $Growth $1,303 $1,329 $1,294 $1,267 $1,259 $1,403 $1,636 Growth Factor 1.2 x 1.1 x 1.0 x 1.1 x 1.0 x 1.1 x 1.3 x Other $2,716 $3,002 $3,586 $4,782 $14,086 $3,906 $4,221 $4,821 QoQ $ Adjusted -$672 $286 $584 $1,196 -$876 $315 $915 fx Neutral Growth 37% 45% 41% 44% 41% 35% Adjusted Growth (ACS606)36% 37% 44% 41% 44% 41% 34% fx Neutral $Growth $685 $808 $1,091 $1,394 $1,190 $1,219 $1,235 Growth Factor 0.9 x 1.1 x 1.5 x 2.0 x 1.7 x 1.5 x 1.1 x AWS $7,696 $8,381 $8,995 $9,954 $35,940 $10,219 $10,808 $11,604 fx Neutral Growth 42% 37% 35% 34% 46% 33% 29% 29% Rpt Growth 37% 35% 34% 33% 29% 29% QoQ % Ch 4% 9% 7% 11% fx Neutral $Growth $2,286 $2,259 $2,338 $2,524 $10,284 $2,523 $2,427 $2,609 Growth Factor 1.3 x 1.1 x 1.1 x 1.1 x 1.3 x 1.1 x 1.1 x 1.1 x Total Reported $59,700 $63,404 $69,981 $87,437 $75,452 $88,912 $94,761 Organic 21.0% 24.6% 21.6% 27.0% 40.9% 35.6% Guidance High $60,000 $63,500 $70,000 $86,500 $73,000 $81,000 $93,000 Low $56,000 $59,500 $66,000 $80,000 $69,000 $75,000 $87,000 % of Range 92.5% 97.6% 99.5% 114.4% 161.3% 231.9% 129.3% Unit Growth 10% 18% 22% 22% 32% 57% 1P Unit Growth 19% 35% 60% 3P Unit Growth 24% 31% 56% 3P Unit M ix 53% 54% 53% 53% 52% 53% Growth driven by a higher frequency of buying and more Prime members. Seller growth also accelerating Prime growth up on lower churn and more gross adds; Q3 should show a further acceleration in revenue COVID impacted industries are dropping / slowing workloads due to declines in their own business activity. Getting more business development opportunity from slower adopters. Given Prime trends, revenue should again beat guidance; however, the beat should be of a lower magnitude. Management is planning for revenue growth to near 50% by the holiday. It likely will not reach that level, but they aren't sure and want to be prepared.
- 8. Q1'20 Q2'20 Q3'20e Q4'20e Shopify USGM V $11,832 $20,468 $19,756 $24,748 YoY$ Ch $3,728 $11,084 $9,692 $10,740 YoY% Ch 46% 118% 96% 77% QoQ % Ch 73% -3% 25% eBay USGM V $7,631 $10,489 $8,727 $9,164 YoY$ Ch -$294 $2,700 $1,393 $1,470 YoY% Ch -4% 35% 19% 19% QoQ % Ch 37% -17% 5% Amazon USGM V $66,353 $85,360 $85,523 $106,904 YoY$ Ch $15,492 $30,039 $24,435 $25,396 YoY% Ch 30% 54% 40% 31% QoQ % Ch 29% 0% 25% Retail Sales in Peer Set $389,332 $427,677 YoY$ Ch $30,279 $37,973 YoY% Ch 8% 10% QoQ % Ch 10% Addressible Retail Sales $662,098 $694,598 YoY$ Ch $26,871 -$8,896 YoY% Ch 4% -1% QoQ % Ch 5% Walmart-US, Target, & Costco-US $140,486 YoY$ Ch $11,231 YoY% Ch 9% References: Retail Sales in Peer Set is NAICS c ategories of Sporting Goods, General Merc handise Stores, Misc . Stores, Nonstore Retailers, Minus Amazon NA 1P rev enue. from the CB's June MRTS report, or the ADVANCEMONTHLY SALES FORRETAIL AND FOOD SERVICES, JUNE2020. Addressable Retail Sales is the abov e, plus the NAICS c atories for Furniture, Elec tronic s & Applianc es, Building Materials, and Clothing & Ac c essories Stores, eBay c omes from the c ompany's reports, Amazon and Shopify are our estimates Note the numbers from Target, Walmart, and Costc o are 1-month off being part of the retail c alender, thus, Q2 for them is May, June, & July--- a more robust period in Cov id-19 time. Moreov er, other apples-&-oranges is that roughly half Costc o and Walmart sales are groc ery. Perspective on US Retail 8 Allrightsreserved,InflectionCapitalManagement,LLC Amazon's numbers are flattered by consumables; whereas, Shopify and eBay are mostly discretionary items. Amazon's growth in Q2 doubled, whereas, it's peer set experienced a boost of 27%. Amazon's QoQ of 29% was 3X peer set Shopify's merchants grew GMV by a similar to the combined amount of Walmart, Target, and Costco eBay's gains were terrific; however, these gains were also the result of folks shopping as entertainment and for scarce goods like fitness equipment. Thus, as our world begin to normalize, it is unclear how sustained the gains are and how much loyalty eBay won.
- 9. Perspective on Amazon North America 9 Allrightsreserved,InflectionCapitalManagement,LLC 1D and C19 costs driving retail contribution margin lower Prime growth remains undiminished Direct C19 expense is est. at $3B. This is balanced by cuts to outside advertising (Google), T&E, and other discretionary categories Unlike other digital ad businesses. Amazon's remains robust North America ($ m illion) 2018 Q1 19 Q2 19 Q3 19 Q4 '19 2019 Q1 20 Q2 20 Q3 20e Subscription Fees $8,490 $2,515 $2,835 $3,282 $2,800 $11,432 $3,245 $3,686 $4,332 % Growth 38% 39% 35% 35% 30% 35% 29% 30% 32% Advertising $9,559 $2,573 $3,377 $3,400 $4,500 $13,850 $3,705 $4,795 $4,794 % Growth 35% 64% 45% 38% 45% 44% 42% 41% 1P Sales $75,908 $18,268 $19,542 $21,990 $28,840 $88,640 $23,932 $29,899 $30,785 Pf % Growth 13% 12% 16% 24% 16% 17% 35% 58% 44% 3P Fees $30,745 $8,148 $8,569 $9,775 $13,167 $39,659 $10,605 $13,282 $13,685 % Growth 36% 27% 25% 30% 33% 29% 30% 55% 40% Total Revenue $141,926 $35,812 $38,653 $42,638 $53,670 $170,773 $46,127 $55,436 $57,788 % Change ex. WFM 25% 19% 23% 31% 24% 23% 29% 43% 36% Prime Video Costs $4,010 $985 $1,190 $1,258 $1,284 $4,717 $1,497 $1,862 $1,676 1P M erchandise Cost $56,102 $13,380 $14,459 $16,673 $22,129 $66,640 $17,811 $21,991 $22,873 % of 1P Rev 73.9% 73.2% 74.0% 75.8% 76.7% 75.2% 74.4% 73.5% 74.3% Shipping Costs $17,619 $4,946 $5,334 $6,680 $9,079 $26,038 $7,616 $9,710 $9,710 % of 1P & 3P Rev 16.5% 18.7% 19.0% 21.0% 21.6% 20.3% 22.1% 22.5% 21.8% Fullfillment $19,620 $4,977 $5,699 $6,409 $7,688 $24,773 $7,338 $9,123 $9,383 % of 1P & 3P Rev 9.9% 18.8% 20.3% 20.2% 18.3% 10.0% 21.2% 21.1% 21.1% 1P & 3P Cont M argin $13,311 $3,114 $2,619 $2,003 $3,111 $10,847 $1,771 $2,358 $2,504 % of GM V 6.7% 6.1% 4.9% 3.3% 3.8% 4.4% 2.7% 2.8% 2.9% % Change -2% -19% -35% -19% -19% Whole Food Profit $1,158 $345 $346 $335 $131 $1,157 $371 $302 $335 Other Expense $21,318 $5,275 $6,423 $6,480 $7,358 $25,536 $6,284 $7,137 $7,054 % of Rev 15.0% 14.7% 16.6% 15.2% 13.7% 15.0% 13.6% 12.9% 12.2% Operating Profits $7,190 $2,287 $1,564 $1,282 $1,900 $7,033 $1,312 $2,141 $3,235 % of Rev 5.1% 6.4% 4.0% 3.0% 3.5% 4.1% 2.8% 3.9% 5.6% Covid Costs $600 $3,000 $1,500 Operating Profits ex/ Covid $1,912 $5,141 $4,735 4.1% 9.3% 8.2%
- 10. North America ($ m illion) 2018 2019 2020e 2021e 2022e 2023e 2024e Subscription Fees 38% 35% 32% 15% 23% 23% 10% Advertising 45% 40% 33% 25% 20% 16% 1P Sales 13% 17% 40% 23% 19% 16% 14% 3P Fees 36% 29% 48% 25% 15% 10% 7% Est. Total GM V $198,886 $247,276 $346,187 $425,809 $497,470 $561,965 $620,010 % Growth 26% 24% 40% 23% 17% 13% 10% Total Revenue $141,926 $170,773 $235,624 $287,686 $337,276 $385,625 $429,605 % Change 25% 23% 42% 24% 18% 15% 12% EBITBreakdown 1P & 3P $13,311 $10,847 $12,388 $20,856 $30,871 $38,795 $43,054 % of GM V 6.7% 4.4% 3.6% 4.9% 6.2% 6.9% 6.9% % of 1P/3P Rev 12.5% 8.5% 6.8% 9.2% 11.6% 12.8% 12.7% % Change -19% 14% NA 48% 26% 11% Prime $4,480 $6,715 $7,847 $9,197 $11,479 $14,323 $15,755 Advertising $9,559 $13,850 $19,390 $25,761 $32,132 $38,503 $44,555 Whole Foods $1,158 $1,157 $1,157 $1,157 $1,157 $1,157 $1,157 Other Expense $21,318 $25,536 $32,987 $29,487 $33,487 $37,487 $41,487 Subtotal $7,190 $7,033 $7,795 $27,484 $42,152 $55,291 $63,034 Depreciation $4,415 $5,106 $7,045 $8,602 $10,084 $11,530 $12,845 EBITDA $11,605 $12,139 $14,840 $36,086 $52,237 $66,821 $75,879 NTM Valuation 20.0 X 20.0 X 20.0 X 20.0 X Value (Billions) $1,045 $1,336 $1,518 $1,699 Forecasts for Amazon North America 2021 likely to be the year of significant profit growth 10All rights reserved, Inflection Capital Management, LLC A substantial downshift in profits began in 2019, our forecast of a longer-term expansion is due to improving efficiency in FC and shipping costs, higher merch pricing and favorable mix, cycling COVID-1- timers & 1D and pulling $1.5B out of office space expense Expecting a price increase in June '22 Longer-term, the Amazon flywheel is fueled by Prime fees and advertising revenue. Zero evidence of the Law-of-Large Numbers The $42B in "other expense" is Amazon's marketing and R&D. We have not assigned any return (value) from this investment. That is "upside" $1.3T in enterprise value appreciating to $2.7T solely from the North American segment
- 11. Perspective on AWS and International (this is capture in our prior deck) 11All rights reserved, Inflection Capital Management, LLC https://www.slideshare.net/thomaspaulson1/amazon-post-q1-2020-results