SlideShare a Scribd company logo
1 of 6
Download to read offline
Intercontinental Exchange | Investment Analysis
Discounted Cash Flow (DCF) Analysis
The team conducted a DCF analysis to get the intrinsic value of the firm and compare it to its
current price. With an implied new intrinsic price, we can tell whether the stock is over or
undervalued.
We adjusted the basic Enterprise Value formula to get the Implied Equity Value Per Share
(Implied Share Price). Formulas below:
Total Enterprise Value: (Share Price x Shares Outstanding) + Market Value of debt
Equity Value Per Share: (Total Enterprise Value – Market Value of Debt)/Shares Outstanding
Stage #1 of the DCF analysis consists on forecasting the first 10 years of ICE between 2016-
2025. It is important to note that we used the average of 1Q16-3Q16 to forecast 4Q16. Even
though 4Q has higher trading activity in exchanges, the team stood away from this method due to
the recent volatility in the markets. Moving on, we used a discount rate/WACC of 6.24% and we
used a current price of $56.65 as of 12/04/2016. We also used a growth rate of 7.5%, which is
the average of management’s growth expectation of 10% and the industry growth average of 5%.
When we forecast and discount the first 10 years of FCFs, we get an Implied Enterprise Value of
$14,179,079,000. Please see table below.
Growth Rate 7.5%
Discount Rate/WACC 6.24%
Implied Enterprise Value $14,179,079,000
Stage #2 is used to calculate the Implied Terminal Value, which represents the intrinsic value of
the firm after the forecasted period of 10 years. The first method of calculating the Implied
Terminal Value is the Perpetuity Method, where we have a 2% perpetual growth rate and a 2%
WACC. This gives us an Implied (discounted) Terminal Value of $24,667,289,000. Please see
table below.
Growth Rate 2%
Discount Rate/WACC 2%
Implied Discounted Terminal Value $24,667,289,000
The second method of calculating the Implied Terminal Value is called the EBITDA Multiple
Method. Which takes the last projected EBITDA (2025) of $5,165,578,000 and we multiply it by
the Industry Average EBITDA of 11.159x, which gives us an Implied (discounted) Terminal
Value of $31,471,344,00. Please see table below.
Projected 2025 EBITDA $5,165,578,000
Industry Average EBITDA 11.159x
Implied Discounted Terminal Value $31,471,344,000
ICE
We can now calculate the Implied Equity Value Per Share by first using the perpetuity method.
Please see table below for calculation.
Total Enterprise Value $38,846,368,000
Less Market Value of Debt ($158,492,000)
Divided by Shares Outstanding 560,000,000
Implied Equity Value Per Share $69.09
We can also calculate the Implied Equity Value Per Share by using the EBITDA Multiple
Method. Please see table below for calculation.
Total Enterprise Value $45,650,423,000
Less Market Value of Debt ($158,492,000)
Divided by Shares Outstanding 560,000,000
Implied Equity Value Per Share $81.24
Based on our DCF analysis, the team recommends to BUY the stock due to the higher implied
prices using both the Perpetuity Method and EBITDA Multiple Method.
Sensitivity Analysis
The team also performed a sensitivity analysis in order to evaluate the price sensitivity to
different growth rates and discount rates. As it is generally known, a higher growth rate will
provide a higher price, while a higher discount rate will provide a lower price.
$ 69.09 1.0% 2.0% 3.0% 4.0%
4.0% $ 95.67 $ 113.34 $ 142.79
5.0% $ 77.78 $ 88.59 $ 104.80 $ 131.81
6.0% $ 65.12 $ 72.21 $ 82.13 $ 97.01
7.0% $ 55.72 $ 60.60 $ 67.11 $ 76.22
8.0% $ 48.47 $ 51.96 $ 56.45 $ 62.44
(Highlighted cells are most relevant)
Terminal Growth Rate
DiscountRate/WACC
ICE
P/E Multiples Valuation
While performing a DCF is the industry standard to compute the intrinsic value of a firm, it has
its downsides. For example, the DCF model is based off of a set of assumptions which, if proven
to be incorrect, may severely alter the results of the DCF model. Due to the variability that may
exist in the intrinsic DCF valuation model, it is important to also use a relative valuation method
such as the P/E Ratio approach to use to compare the intrinsic approach to the relative approach.
We have calculated the P/E ratio for Intercontinental Exchange using historical data and dividing
the end of year price per share by the reported earnings per share. This calculation was
completed for the years 2011 to 2015 and the results are shown in the table below and visualized
graphically in the line chart below.
ICE Trailing P/E Ratio 2011 2012 2013 2014 2015 Average
Year-End Closing Price
(12/31/xx)
$24.11 $24.76 $44.98 $43.86 $51.25 $37.79
Earnings Per Share $1.38 $1.50 $0.64 $1.71 $2.28 $1.50
Price-to-Earnings Ratio
(TTM)
17.471 16.507 70.281 25.649 22.478 30.477
As the table and graph shows above, there is a large swing in the P/E ratio between years 2012
and 2014. This rapid jump in P/E ratio can be most attributed to a drastic drop in earnings during
2013 due to the $11 billion acquisition of NYSE Euro Next in 2013 which would increase costs
and thus decrease earnings for ICE. Once this price to earnings ratio variation is accounted for
and understood, there is a relatively stable P/E Ratio during this 5-year period.
In addition to calculating the historic P/E Ratio for ICE, a forward P/E Ratio was calculated
using the projected EPS from the Pro Forma Income Statement projections. This forward P/E
Ratio as well as other analyst’s projections for the industry competitors are shown below.
0.000
10.000
20.000
30.000
40.000
50.000
60.000
70.000
80.000
2011 2012 2013 2014 2015
P/E Ratio
ICE
As is evident in the above graph, there is a large variation between the forward P/E ratios of the
top 3 industry competitors. However, when examined further possible reasons for this variation
becomes more evident. For example, the market capitalization of these three firms is very
different. The CME Group’s market capitalization is approximately $41 billion whereas ICE’s
market capitalization is approximately $35 billion while NDAQ’s market capitalization is only
$11.17 billion (all market capitalizations as of 12/7/2016). These differences in market
capitalization start to tell a story about why these price to earnings ratios may vary as they do.
Furthermore, during the assessment of which Forward P/E ratios to use during the relative
valuation, it was concluded that using the CME Groups Forward P/E Ratio would be the best
comparison to ICE due to the more similar nature of their market capitalization. It was decided
that the NDAQ price to earnings ratio would not be presented for the relative valuation, however
NDAQ’s price to earnings ratio should not be ignored because NDAQ is still a major player in
the industry. In order to incorporate or capture some of the relative valuation of NDAQ, an
industry average was used in the relative valuation.
Through the relative P/E valuation, it was found that ICE’s implied relative valuation based on
the industry average was $52.04 and when compared to the current price of $56.65 (as of
12/04/2016) would net investors a less of $4.61 per share before fees. However, it is important to
keep in mind that this value is a relative valuation using in part a P/E ratio that does not fully
represent the size of ICE. When a relative valuation was performed using the CME groups P/E
ratio, an implied price of $63.31 was found which would net investors $6.66 profit per share
before fees.
With these two seemingly conflicting valuations, it is important to consider other factors that
may influence the investment decision in either direction. One such factor that may shine light
onto a decision is the EDITDA multiple. The EBITDA multiple is a measure of a firm’s total
enterprise value divided by their EBITDA, which is a proxy for operating income. This is
important when evaluating a company because it shows the potential earnings from equity and
debt that an investor may receive and how much that investor would have to pay for those
24.6
15.32
22.02
20.22
0
5
10
15
20
25
30
CME NDAQ ICE (Predicted) Industry Average
Forward P/E Ratio 2015
ICE
earnings. This differs from the P/E Ratio because it is inclusive of the effects that debt has on
earnings.
In the chart below, a comparison of ICE and the industry competitors can be observed:
In this chart it is seen that the EBITDA multiple for ICE is significantly below both the industry
average as well as its competitors. This means that ICE has a relatively high EBITDA or
operating income when compared to the operating income of its competitors. Implying that the
market currently undervalues the earnings of ICE.
By coupling the P/E Ratio method which showed both a sell or hold recommendation and a buy
recommendation for ICE with the EBITDA multiple analysis, it can be concluded that based
solely on relative valuation techniques, investors should buy ICE.
16.88
11.97
4.628
11.159
0
2
4
6
8
10
12
14
16
18
CME NDAQ ICE Industry Average
EV/EBITDA 2015
CME NDAQ ICE Industry Average
ICE
Summary
Based on 4 different valuations (2 intrinsic and 2 relative), the final recommendation is to BUY
the stock. Please see graph below for more information.
$56.65
$69.09
$81.24
$52.04
$63.31
30 40 50 60 70 80 90
Current Price
DCF - Perpetuity Method
DCF - EBITDA Method
Comps - P/E Industry AVG
Comps - P/E Industry Leader
Share Price Comparison
ICE

More Related Content

What's hot

A Study on Ratio Analysis
A Study on Ratio AnalysisA Study on Ratio Analysis
A Study on Ratio Analysisijtsrd
 
Chapter 9 on Valuation and Reporting in Organization
Chapter 9 on Valuation and Reporting in OrganizationChapter 9 on Valuation and Reporting in Organization
Chapter 9 on Valuation and Reporting in OrganizationFirdaus Fitri Zainal Abidin
 
Impact of leverage on shareholders’ return (1)
Impact of leverage on shareholders’ return (1)Impact of leverage on shareholders’ return (1)
Impact of leverage on shareholders’ return (1)University of Jaffna
 
Ratio Analysis project
Ratio Analysis projectRatio Analysis project
Ratio Analysis projectD V A Subhash
 
Financial analysis of cipla ltd
Financial  analysis of cipla ltdFinancial  analysis of cipla ltd
Financial analysis of cipla ltdRohit Rashinkar
 
Chapter 05(a) financial analysis-ratio and other analysis
Chapter 05(a) financial analysis-ratio and other analysisChapter 05(a) financial analysis-ratio and other analysis
Chapter 05(a) financial analysis-ratio and other analysisAl Sabbir
 
Effect of Leverage on Expected Stock Returns and Size of the Firm
Effect of Leverage on Expected Stock Returns and Size of the FirmEffect of Leverage on Expected Stock Returns and Size of the Firm
Effect of Leverage on Expected Stock Returns and Size of the FirmAakash Kumar
 
Project on ratio analysis
Project on ratio analysisProject on ratio analysis
Project on ratio analysisRanobir Dey
 
Oshkosh Activist Situation Report
Oshkosh Activist Situation ReportOshkosh Activist Situation Report
Oshkosh Activist Situation ReportAlliance Advisors
 
Chapter 02 strategy analysis
Chapter 02 strategy analysisChapter 02 strategy analysis
Chapter 02 strategy analysisAl Sabbir
 
Ratio Analysis of Samsung Electronics Co. Ltd.
Ratio Analysis of Samsung Electronics Co. Ltd.Ratio Analysis of Samsung Electronics Co. Ltd.
Ratio Analysis of Samsung Electronics Co. Ltd.Nikita Jangid
 
Breaking down-roe-using-the-dupont-formula
Breaking down-roe-using-the-dupont-formulaBreaking down-roe-using-the-dupont-formula
Breaking down-roe-using-the-dupont-formulaRahmatullah Mardanvi
 
pwc-stock-comp-2016-assumption-disclosure-study
pwc-stock-comp-2016-assumption-disclosure-studypwc-stock-comp-2016-assumption-disclosure-study
pwc-stock-comp-2016-assumption-disclosure-studyKen Stoler
 
The influence of debt ratio
The influence of debt ratioThe influence of debt ratio
The influence of debt ratioIntan Ayuna
 

What's hot (19)

A Study on Ratio Analysis
A Study on Ratio AnalysisA Study on Ratio Analysis
A Study on Ratio Analysis
 
Chapter 9 on Valuation and Reporting in Organization
Chapter 9 on Valuation and Reporting in OrganizationChapter 9 on Valuation and Reporting in Organization
Chapter 9 on Valuation and Reporting in Organization
 
Impact of leverage on shareholders’ return (1)
Impact of leverage on shareholders’ return (1)Impact of leverage on shareholders’ return (1)
Impact of leverage on shareholders’ return (1)
 
Ratio Analysis project
Ratio Analysis projectRatio Analysis project
Ratio Analysis project
 
Financial analysis of cipla ltd
Financial  analysis of cipla ltdFinancial  analysis of cipla ltd
Financial analysis of cipla ltd
 
Introduction to ratio analysis
Introduction to ratio analysisIntroduction to ratio analysis
Introduction to ratio analysis
 
Chapter 05(a) financial analysis-ratio and other analysis
Chapter 05(a) financial analysis-ratio and other analysisChapter 05(a) financial analysis-ratio and other analysis
Chapter 05(a) financial analysis-ratio and other analysis
 
Rahul ppt
Rahul pptRahul ppt
Rahul ppt
 
Effect of Leverage on Expected Stock Returns and Size of the Firm
Effect of Leverage on Expected Stock Returns and Size of the FirmEffect of Leverage on Expected Stock Returns and Size of the Firm
Effect of Leverage on Expected Stock Returns and Size of the Firm
 
Project on ratio analysis
Project on ratio analysisProject on ratio analysis
Project on ratio analysis
 
Ratio analysis project presentation
Ratio analysis project presentationRatio analysis project presentation
Ratio analysis project presentation
 
Ratio analysis of hul sd
Ratio analysis of hul sdRatio analysis of hul sd
Ratio analysis of hul sd
 
Oshkosh Activist Situation Report
Oshkosh Activist Situation ReportOshkosh Activist Situation Report
Oshkosh Activist Situation Report
 
Chapter 02 strategy analysis
Chapter 02 strategy analysisChapter 02 strategy analysis
Chapter 02 strategy analysis
 
Ratio Analysis of Samsung Electronics Co. Ltd.
Ratio Analysis of Samsung Electronics Co. Ltd.Ratio Analysis of Samsung Electronics Co. Ltd.
Ratio Analysis of Samsung Electronics Co. Ltd.
 
Financial ratio analysis
Financial ratio analysisFinancial ratio analysis
Financial ratio analysis
 
Breaking down-roe-using-the-dupont-formula
Breaking down-roe-using-the-dupont-formulaBreaking down-roe-using-the-dupont-formula
Breaking down-roe-using-the-dupont-formula
 
pwc-stock-comp-2016-assumption-disclosure-study
pwc-stock-comp-2016-assumption-disclosure-studypwc-stock-comp-2016-assumption-disclosure-study
pwc-stock-comp-2016-assumption-disclosure-study
 
The influence of debt ratio
The influence of debt ratioThe influence of debt ratio
The influence of debt ratio
 

Viewers also liked

5 клас 2 урок
5 клас 2 урок5 клас 2 урок
5 клас 2 урокIren50
 
Glidden Paint Campaign Book -- GP Relations
Glidden Paint Campaign Book -- GP RelationsGlidden Paint Campaign Book -- GP Relations
Glidden Paint Campaign Book -- GP RelationsIthaca College
 
TOUR10 - BRAZIL - VILLANUEVA
TOUR10 - BRAZIL - VILLANUEVATOUR10 - BRAZIL - VILLANUEVA
TOUR10 - BRAZIL - VILLANUEVApaulvillanueva01
 
PORTFOLIO- Golnaz Abadian
PORTFOLIO- Golnaz AbadianPORTFOLIO- Golnaz Abadian
PORTFOLIO- Golnaz AbadianGolnaz Abadian
 
女性のための栄養マカ根粉末の5健康上の利点
女性のための栄養マカ根粉末の5健康上の利点女性のための栄養マカ根粉末の5健康上の利点
女性のための栄養マカ根粉末の5健康上の利点organicsuperfood
 
DCBADD2015 getting your hands dirty with ux slides
DCBADD2015 getting your hands dirty with ux slidesDCBADD2015 getting your hands dirty with ux slides
DCBADD2015 getting your hands dirty with ux slidesIIBADCBADD
 
Tema 3 Los Inicios de la Edad Contemporánea
Tema 3 Los Inicios de la Edad ContemporáneaTema 3 Los Inicios de la Edad Contemporánea
Tema 3 Los Inicios de la Edad ContemporáneaJoseAngelSotocaPulpon
 
How to make the perfect mashed potato
How to make the perfect mashed potatoHow to make the perfect mashed potato
How to make the perfect mashed potatoArmentspieandmash
 

Viewers also liked (14)

5 клас 2 урок
5 клас 2 урок5 клас 2 урок
5 клас 2 урок
 
Glidden Paint Campaign Book -- GP Relations
Glidden Paint Campaign Book -- GP RelationsGlidden Paint Campaign Book -- GP Relations
Glidden Paint Campaign Book -- GP Relations
 
Prajiv CV
Prajiv CVPrajiv CV
Prajiv CV
 
TOUR10 - BRAZIL - VILLANUEVA
TOUR10 - BRAZIL - VILLANUEVATOUR10 - BRAZIL - VILLANUEVA
TOUR10 - BRAZIL - VILLANUEVA
 
PORTFOLIO- Golnaz Abadian
PORTFOLIO- Golnaz AbadianPORTFOLIO- Golnaz Abadian
PORTFOLIO- Golnaz Abadian
 
Производство ООО "РоСКом-ТехМаш"
Производство ООО "РоСКом-ТехМаш"Производство ООО "РоСКом-ТехМаш"
Производство ООО "РоСКом-ТехМаш"
 
女性のための栄養マカ根粉末の5健康上の利点
女性のための栄養マカ根粉末の5健康上の利点女性のための栄養マカ根粉末の5健康上の利点
女性のための栄養マカ根粉末の5健康上の利点
 
Референс-лист ООО "РоСКом-ТехМаш"
Референс-лист ООО "РоСКом-ТехМаш"Референс-лист ООО "РоСКом-ТехМаш"
Референс-лист ООО "РоСКом-ТехМаш"
 
DCBADD2015 getting your hands dirty with ux slides
DCBADD2015 getting your hands dirty with ux slidesDCBADD2015 getting your hands dirty with ux slides
DCBADD2015 getting your hands dirty with ux slides
 
Tema 3 Los Inicios de la Edad Contemporánea
Tema 3 Los Inicios de la Edad ContemporáneaTema 3 Los Inicios de la Edad Contemporánea
Tema 3 Los Inicios de la Edad Contemporánea
 
The Human Body and Reprodution
The Human Body and ReprodutionThe Human Body and Reprodution
The Human Body and Reprodution
 
MARKETING
MARKETINGMARKETING
MARKETING
 
SUMAN BIO DATA (1)
SUMAN BIO DATA (1)SUMAN BIO DATA (1)
SUMAN BIO DATA (1)
 
How to make the perfect mashed potato
How to make the perfect mashed potatoHow to make the perfect mashed potato
How to make the perfect mashed potato
 

Similar to Intercontinental Exchange -- Investment Analysis Report

Chapter 8 on Valuation and Reporting in Organization
Chapter 8 on Valuation and Reporting in OrganizationChapter 8 on Valuation and Reporting in Organization
Chapter 8 on Valuation and Reporting in OrganizationFirdaus Fitri Zainal Abidin
 
Walt Disney- Equity Valuation
Walt Disney- Equity ValuationWalt Disney- Equity Valuation
Walt Disney- Equity ValuationSonali Jain
 
SOC-436 Topic 2 Power in America Worksheet Scoring Guide.docx
SOC-436 Topic 2 Power in America Worksheet Scoring Guide.docxSOC-436 Topic 2 Power in America Worksheet Scoring Guide.docx
SOC-436 Topic 2 Power in America Worksheet Scoring Guide.docxwhitneyleman54422
 
Presentation on valuation of walt disney equity
Presentation on valuation of walt disney equityPresentation on valuation of walt disney equity
Presentation on valuation of walt disney equityambarapu sai kiran
 
InstructionsThe objective of the Case Debriefings is to revi
InstructionsThe objective of the Case Debriefings is to reviInstructionsThe objective of the Case Debriefings is to revi
InstructionsThe objective of the Case Debriefings is to reviTatianaMajor22
 
Luyao_Yang_COH_Report
Luyao_Yang_COH_ReportLuyao_Yang_COH_Report
Luyao_Yang_COH_Report璐瑶 杨
 
Financial analysis techniques
Financial analysis techniques  Financial analysis techniques
Financial analysis techniques Neven Erfan
 
Learn2Invest Session 9-Edge Framework.pdf
Learn2Invest Session 9-Edge Framework.pdfLearn2Invest Session 9-Edge Framework.pdf
Learn2Invest Session 9-Edge Framework.pdfMukul Chaudhri
 
Discussion 1  Analysis of Financial Statements.A. This discussi.docx
Discussion 1  Analysis of Financial Statements.A. This discussi.docxDiscussion 1  Analysis of Financial Statements.A. This discussi.docx
Discussion 1  Analysis of Financial Statements.A. This discussi.docxfelipaser7p
 
Gsk stock-valuation-final (group 09)
Gsk stock-valuation-final (group 09)Gsk stock-valuation-final (group 09)
Gsk stock-valuation-final (group 09)Sabiha Zaman Khan
 
Starbucks Valuation Report - V3 (Complete)
Starbucks Valuation Report - V3 (Complete) Starbucks Valuation Report - V3 (Complete)
Starbucks Valuation Report - V3 (Complete) Kevin Schultz
 
Leverage Buyout of Target Corp
Leverage Buyout of Target CorpLeverage Buyout of Target Corp
Leverage Buyout of Target CorpUsman Riaz
 
FIN449Individual Final ProjectIntroductionValuation can.docx
FIN449Individual Final ProjectIntroductionValuation can.docxFIN449Individual Final ProjectIntroductionValuation can.docx
FIN449Individual Final ProjectIntroductionValuation can.docxmydrynan
 
Risk & capital budgeting
Risk & capital  budgetingRisk & capital  budgeting
Risk & capital budgetinglubnasadiyah
 
Fin 370 final exam guide (new)/newtonhelp.com
Fin 370 final exam guide (new)/newtonhelp.comFin 370 final exam guide (new)/newtonhelp.com
Fin 370 final exam guide (new)/newtonhelp.comvenkateshmanohar4
 
Accounting-ad-Cost-Management-ppt.pptx
Accounting-ad-Cost-Management-ppt.pptxAccounting-ad-Cost-Management-ppt.pptx
Accounting-ad-Cost-Management-ppt.pptxlillianfweir32
 
FIN 370 Final Exam
FIN 370 Final ExamFIN 370 Final Exam
FIN 370 Final ExamArnoldKooman
 

Similar to Intercontinental Exchange -- Investment Analysis Report (20)

Chapter 8 on Valuation and Reporting in Organization
Chapter 8 on Valuation and Reporting in OrganizationChapter 8 on Valuation and Reporting in Organization
Chapter 8 on Valuation and Reporting in Organization
 
Walt Disney- Equity Valuation
Walt Disney- Equity ValuationWalt Disney- Equity Valuation
Walt Disney- Equity Valuation
 
SOC-436 Topic 2 Power in America Worksheet Scoring Guide.docx
SOC-436 Topic 2 Power in America Worksheet Scoring Guide.docxSOC-436 Topic 2 Power in America Worksheet Scoring Guide.docx
SOC-436 Topic 2 Power in America Worksheet Scoring Guide.docx
 
Presentation on valuation of walt disney equity
Presentation on valuation of walt disney equityPresentation on valuation of walt disney equity
Presentation on valuation of walt disney equity
 
CFA IRC Team E
CFA IRC Team ECFA IRC Team E
CFA IRC Team E
 
InstructionsThe objective of the Case Debriefings is to revi
InstructionsThe objective of the Case Debriefings is to reviInstructionsThe objective of the Case Debriefings is to revi
InstructionsThe objective of the Case Debriefings is to revi
 
Luyao_Yang_COH_Report
Luyao_Yang_COH_ReportLuyao_Yang_COH_Report
Luyao_Yang_COH_Report
 
Financial analysis techniques
Financial analysis techniques  Financial analysis techniques
Financial analysis techniques
 
Learn2Invest Session 9-Edge Framework.pdf
Learn2Invest Session 9-Edge Framework.pdfLearn2Invest Session 9-Edge Framework.pdf
Learn2Invest Session 9-Edge Framework.pdf
 
Discussion 1  Analysis of Financial Statements.A. This discussi.docx
Discussion 1  Analysis of Financial Statements.A. This discussi.docxDiscussion 1  Analysis of Financial Statements.A. This discussi.docx
Discussion 1  Analysis of Financial Statements.A. This discussi.docx
 
Gsk stock-valuation-final (group 09)
Gsk stock-valuation-final (group 09)Gsk stock-valuation-final (group 09)
Gsk stock-valuation-final (group 09)
 
Valncaps2
Valncaps2Valncaps2
Valncaps2
 
Unit 4
Unit 4Unit 4
Unit 4
 
Starbucks Valuation Report - V3 (Complete)
Starbucks Valuation Report - V3 (Complete) Starbucks Valuation Report - V3 (Complete)
Starbucks Valuation Report - V3 (Complete)
 
Leverage Buyout of Target Corp
Leverage Buyout of Target CorpLeverage Buyout of Target Corp
Leverage Buyout of Target Corp
 
FIN449Individual Final ProjectIntroductionValuation can.docx
FIN449Individual Final ProjectIntroductionValuation can.docxFIN449Individual Final ProjectIntroductionValuation can.docx
FIN449Individual Final ProjectIntroductionValuation can.docx
 
Risk & capital budgeting
Risk & capital  budgetingRisk & capital  budgeting
Risk & capital budgeting
 
Fin 370 final exam guide (new)/newtonhelp.com
Fin 370 final exam guide (new)/newtonhelp.comFin 370 final exam guide (new)/newtonhelp.com
Fin 370 final exam guide (new)/newtonhelp.com
 
Accounting-ad-Cost-Management-ppt.pptx
Accounting-ad-Cost-Management-ppt.pptxAccounting-ad-Cost-Management-ppt.pptx
Accounting-ad-Cost-Management-ppt.pptx
 
FIN 370 Final Exam
FIN 370 Final ExamFIN 370 Final Exam
FIN 370 Final Exam
 

Intercontinental Exchange -- Investment Analysis Report

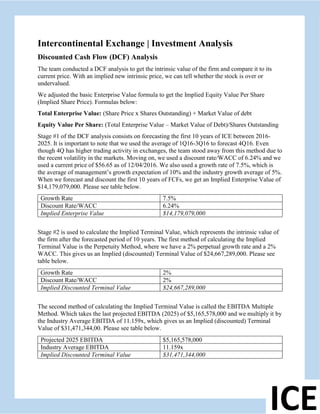
  • 1. Intercontinental Exchange | Investment Analysis Discounted Cash Flow (DCF) Analysis The team conducted a DCF analysis to get the intrinsic value of the firm and compare it to its current price. With an implied new intrinsic price, we can tell whether the stock is over or undervalued. We adjusted the basic Enterprise Value formula to get the Implied Equity Value Per Share (Implied Share Price). Formulas below: Total Enterprise Value: (Share Price x Shares Outstanding) + Market Value of debt Equity Value Per Share: (Total Enterprise Value – Market Value of Debt)/Shares Outstanding Stage #1 of the DCF analysis consists on forecasting the first 10 years of ICE between 2016- 2025. It is important to note that we used the average of 1Q16-3Q16 to forecast 4Q16. Even though 4Q has higher trading activity in exchanges, the team stood away from this method due to the recent volatility in the markets. Moving on, we used a discount rate/WACC of 6.24% and we used a current price of $56.65 as of 12/04/2016. We also used a growth rate of 7.5%, which is the average of management’s growth expectation of 10% and the industry growth average of 5%. When we forecast and discount the first 10 years of FCFs, we get an Implied Enterprise Value of $14,179,079,000. Please see table below. Growth Rate 7.5% Discount Rate/WACC 6.24% Implied Enterprise Value $14,179,079,000 Stage #2 is used to calculate the Implied Terminal Value, which represents the intrinsic value of the firm after the forecasted period of 10 years. The first method of calculating the Implied Terminal Value is the Perpetuity Method, where we have a 2% perpetual growth rate and a 2% WACC. This gives us an Implied (discounted) Terminal Value of $24,667,289,000. Please see table below. Growth Rate 2% Discount Rate/WACC 2% Implied Discounted Terminal Value $24,667,289,000 The second method of calculating the Implied Terminal Value is called the EBITDA Multiple Method. Which takes the last projected EBITDA (2025) of $5,165,578,000 and we multiply it by the Industry Average EBITDA of 11.159x, which gives us an Implied (discounted) Terminal Value of $31,471,344,00. Please see table below. Projected 2025 EBITDA $5,165,578,000 Industry Average EBITDA 11.159x Implied Discounted Terminal Value $31,471,344,000 ICE
  • 2. We can now calculate the Implied Equity Value Per Share by first using the perpetuity method. Please see table below for calculation. Total Enterprise Value $38,846,368,000 Less Market Value of Debt ($158,492,000) Divided by Shares Outstanding 560,000,000 Implied Equity Value Per Share $69.09 We can also calculate the Implied Equity Value Per Share by using the EBITDA Multiple Method. Please see table below for calculation. Total Enterprise Value $45,650,423,000 Less Market Value of Debt ($158,492,000) Divided by Shares Outstanding 560,000,000 Implied Equity Value Per Share $81.24 Based on our DCF analysis, the team recommends to BUY the stock due to the higher implied prices using both the Perpetuity Method and EBITDA Multiple Method. Sensitivity Analysis The team also performed a sensitivity analysis in order to evaluate the price sensitivity to different growth rates and discount rates. As it is generally known, a higher growth rate will provide a higher price, while a higher discount rate will provide a lower price. $ 69.09 1.0% 2.0% 3.0% 4.0% 4.0% $ 95.67 $ 113.34 $ 142.79 5.0% $ 77.78 $ 88.59 $ 104.80 $ 131.81 6.0% $ 65.12 $ 72.21 $ 82.13 $ 97.01 7.0% $ 55.72 $ 60.60 $ 67.11 $ 76.22 8.0% $ 48.47 $ 51.96 $ 56.45 $ 62.44 (Highlighted cells are most relevant) Terminal Growth Rate DiscountRate/WACC ICE
  • 3. P/E Multiples Valuation While performing a DCF is the industry standard to compute the intrinsic value of a firm, it has its downsides. For example, the DCF model is based off of a set of assumptions which, if proven to be incorrect, may severely alter the results of the DCF model. Due to the variability that may exist in the intrinsic DCF valuation model, it is important to also use a relative valuation method such as the P/E Ratio approach to use to compare the intrinsic approach to the relative approach. We have calculated the P/E ratio for Intercontinental Exchange using historical data and dividing the end of year price per share by the reported earnings per share. This calculation was completed for the years 2011 to 2015 and the results are shown in the table below and visualized graphically in the line chart below. ICE Trailing P/E Ratio 2011 2012 2013 2014 2015 Average Year-End Closing Price (12/31/xx) $24.11 $24.76 $44.98 $43.86 $51.25 $37.79 Earnings Per Share $1.38 $1.50 $0.64 $1.71 $2.28 $1.50 Price-to-Earnings Ratio (TTM) 17.471 16.507 70.281 25.649 22.478 30.477 As the table and graph shows above, there is a large swing in the P/E ratio between years 2012 and 2014. This rapid jump in P/E ratio can be most attributed to a drastic drop in earnings during 2013 due to the $11 billion acquisition of NYSE Euro Next in 2013 which would increase costs and thus decrease earnings for ICE. Once this price to earnings ratio variation is accounted for and understood, there is a relatively stable P/E Ratio during this 5-year period. In addition to calculating the historic P/E Ratio for ICE, a forward P/E Ratio was calculated using the projected EPS from the Pro Forma Income Statement projections. This forward P/E Ratio as well as other analyst’s projections for the industry competitors are shown below. 0.000 10.000 20.000 30.000 40.000 50.000 60.000 70.000 80.000 2011 2012 2013 2014 2015 P/E Ratio ICE
  • 4. As is evident in the above graph, there is a large variation between the forward P/E ratios of the top 3 industry competitors. However, when examined further possible reasons for this variation becomes more evident. For example, the market capitalization of these three firms is very different. The CME Group’s market capitalization is approximately $41 billion whereas ICE’s market capitalization is approximately $35 billion while NDAQ’s market capitalization is only $11.17 billion (all market capitalizations as of 12/7/2016). These differences in market capitalization start to tell a story about why these price to earnings ratios may vary as they do. Furthermore, during the assessment of which Forward P/E ratios to use during the relative valuation, it was concluded that using the CME Groups Forward P/E Ratio would be the best comparison to ICE due to the more similar nature of their market capitalization. It was decided that the NDAQ price to earnings ratio would not be presented for the relative valuation, however NDAQ’s price to earnings ratio should not be ignored because NDAQ is still a major player in the industry. In order to incorporate or capture some of the relative valuation of NDAQ, an industry average was used in the relative valuation. Through the relative P/E valuation, it was found that ICE’s implied relative valuation based on the industry average was $52.04 and when compared to the current price of $56.65 (as of 12/04/2016) would net investors a less of $4.61 per share before fees. However, it is important to keep in mind that this value is a relative valuation using in part a P/E ratio that does not fully represent the size of ICE. When a relative valuation was performed using the CME groups P/E ratio, an implied price of $63.31 was found which would net investors $6.66 profit per share before fees. With these two seemingly conflicting valuations, it is important to consider other factors that may influence the investment decision in either direction. One such factor that may shine light onto a decision is the EDITDA multiple. The EBITDA multiple is a measure of a firm’s total enterprise value divided by their EBITDA, which is a proxy for operating income. This is important when evaluating a company because it shows the potential earnings from equity and debt that an investor may receive and how much that investor would have to pay for those 24.6 15.32 22.02 20.22 0 5 10 15 20 25 30 CME NDAQ ICE (Predicted) Industry Average Forward P/E Ratio 2015 ICE
  • 5. earnings. This differs from the P/E Ratio because it is inclusive of the effects that debt has on earnings. In the chart below, a comparison of ICE and the industry competitors can be observed: In this chart it is seen that the EBITDA multiple for ICE is significantly below both the industry average as well as its competitors. This means that ICE has a relatively high EBITDA or operating income when compared to the operating income of its competitors. Implying that the market currently undervalues the earnings of ICE. By coupling the P/E Ratio method which showed both a sell or hold recommendation and a buy recommendation for ICE with the EBITDA multiple analysis, it can be concluded that based solely on relative valuation techniques, investors should buy ICE. 16.88 11.97 4.628 11.159 0 2 4 6 8 10 12 14 16 18 CME NDAQ ICE Industry Average EV/EBITDA 2015 CME NDAQ ICE Industry Average ICE
  • 6. Summary Based on 4 different valuations (2 intrinsic and 2 relative), the final recommendation is to BUY the stock. Please see graph below for more information. $56.65 $69.09 $81.24 $52.04 $63.31 30 40 50 60 70 80 90 Current Price DCF - Perpetuity Method DCF - EBITDA Method Comps - P/E Industry AVG Comps - P/E Industry Leader Share Price Comparison ICE