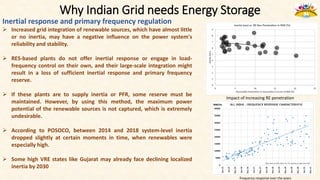
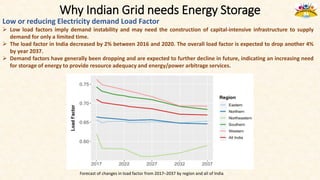
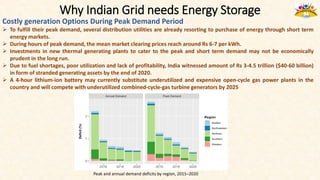
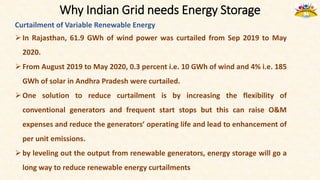
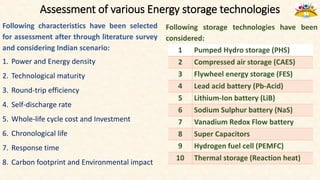
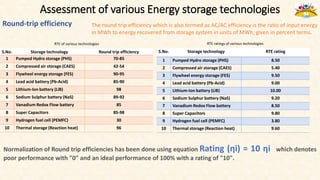
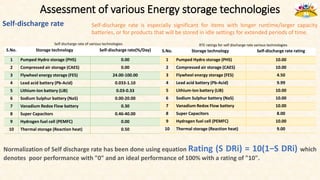
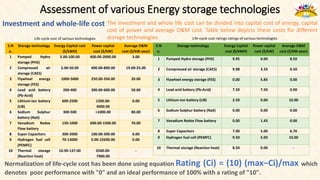
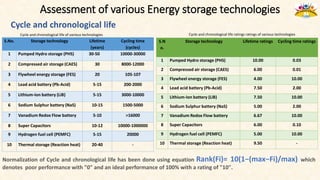
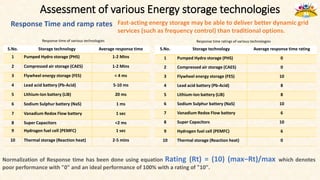
Grid scale energy storage - Potential solutions for India
Contents
01 Intent and driver behind the Project
02 Introduction to Energy Storage
03 Why Indian Grid needs energy storage
04 Technologies for Grid level energy storage
06 Assessment of various technologies
07 Energy storage policy landscape in India
08 Key findings and recommendations
Intent and driver behind the project
 India has made some bold promises at COP-26 all of which must be met by
2030. These are-
1. Renewable energy will provide 50% of total electricity
2. 500 GW of installed renewable energy capacity to be achieved
3. Carbon intensity to be reduced by 45%
4. Cut total carbon emissions of India by 1 billion tonnes
 For achieving 500 GW RE by 2030 and net zero by 2070, India cannot escape
deploying Grid level energy storage considering the variability and uncertainty
associated with such a large-scale renewable integration.
 The uncertainty and variability that comes with RE poses a threat to both Grid
security as well as reliability if not accounted for properly.
 Grid frequency and voltage balancing therefore become challenging as never
before and novel ways and means are required to accomplish them.
 Energy Storage can prove to be a viable solution and will be inevitable for
Indian case.
 The project report will try to assess the whole value chain of different energy
storage technologies (right from raw material sourcing, manufacturing and
deployment/operation in Grid) on basis of carefully selected eight factors
Bhadla, Raj Complex Situation
Solar eclipse, 21st June 2020
Introduction to Energy Storage
 Systems that can gather and store energy for a span of time before
releasing it to provide energy or power services are termed as energy
storage systems.
 Energy storage systems can help in closing the geographical and temporal
gaps between energy supply and demand.
 Throughout the energy system, energy storage technologies may be used
on big and on small scales and in both centralized and distributed
configurations.
 Grid frequency and voltage balancing therefore become challenging as
never before and novel ways and means are required to accomplish them.
 Many technologies are well established or nearing maturity, the majority
of the energy storage technologies are still in their early phases of
development and their full potential can be realized only after further
research efforts.
 Pumped storage hydroelectricity, which was initially used in the 1890s, is
one of the earliest kinds of grid level energy storage.
 Energy storage facilitate increased integration of intermittent renewable
energy resources which is becoming more apparent as the focus on
energy system decarbonization grows.
Introduction to Energy Storage
The Electrical Energy storage can be classified based on the
form of storage as followings –
Electricity storage – Mechanical
Pumped storage hydropower (abbreviated as PSH)
Compressed air energy storage (abbreviated as CAES)
Flywheels (abbreviated as FES)
Electricity storage – Electrochemical
Lithium-ion batteries
Sodium Sulphur batteries
Lead acid batteries
Vanadium Redox flow batteries
Electricity storage – Electrical
Super capacitors (abbreviated as SC)
Superconducting Magnetic energy storage (abbreviated as SME)
Electricity storage – Chemical
Hydrogen storage
Ammonia storage
Electricity storage – Thermal
Underground thermal energy storage (UTES)
Pit storage
Molten salts
Solid media storage
Hot and cold-water storage
Ice storage
PCM slurry storage
Thermochemical storage (phase change materials)
Introduction to Energy Storage
What Energy storage can provide -
 Storage of energy on seasonal basis to cope up with seasonal
generation changes and disruptions
 Use of energy storage for arbitrage trade in power market
 Regulation of frequency – Grid balancing
 Demand following and resource adequacy
 Reactive power support to Grid
 Black start support
 Congestion alleviation for T&D and postponement of infrastructure
investment
 Demand shifting to level out peak demand
 Off-grid capabilities for far flung areas along with renewables
 Integration of variable supply resources in large quantum into Grid
 Utilization of wasted/rejected heat from various process
 Reserves for spinning and non-spinning requirements of Grid
Why Indian Grid needs Energy Storage
Need for additional flexibility due to sharp net demand ramp rates
 The ramping requirements have increased over the years which will become further challenging by
2030 with 500 GW RE.
Hourly ramp rates of demand and thermal generation in India from 2008–2020
Ramp rates frequency distribution in India in 2027
 The National Electricity Plan (Generation) has stressed on the importance of having fast ramping capability for
large-scale renewable energy in the grid (NEP 2018).
 Specifically, there are more periods of time where the ramping demands of the system are above 6,000
MW/hour.
 Central Electricity Authority (Technical Standard for Construction of Electrical Plant and Electrical Lines)
requires thermal generators to be capable of providing 3%–5% ramp rate.
Why Indian Grid needs Energy Storage
Increased need of reactive power support
 The Indian electric grid has 104 GW of renewable energy installed capacity. plans to integrate 500 GW
of RE by 2030. Voltage stability is one of the issues that high Renewable Energy (RE) adoption brings.
Voltage profile at a solar pooling substation for a month
Over and under voltages in Indian Grid – 2020
Energy storage systems such as battery storage and
PHS can operate in all four quadrants thereby
providing necessary amounts of reactive power to
grid.
Why Indian Grid needs Energy Storage
Inertial response and primary frequency regulation
 Increased grid integration of renewable sources, which have almost little
or no inertia, may have a negative influence on the power system's
reliability and stability.
 RES-based plants do not offer inertial response or engage in load-
frequency control on their own, and their large-scale integration might
result in a loss of sufficient inertial response and primary frequency
reserve.
 If these plants are to supply inertia or PFR, some reserve must be
maintained. However, by using this method, the maximum power
potential of the renewable sources is not captured, which is extremely
undesirable.
 According to POSOCO, between 2014 and 2018 system-level inertia
dropped slightly at certain moments in time, when renewables were
especially high.
 Some high VRE states like Gujarat may already face declining localized
inertia by 2030
Impact of increasing RE penetration
frequency response over the years
Why Indian Grid needs Energy Storage
Low or reducing Electricity demand Load Factor
 Low load factors imply demand instability and may need the construction of capital-intensive infrastructure to supply
demand for only a limited time.
 The load factor in India decreased by 2% between 2016 and 2020. The overall load factor is expected to drop another 4%
by year 2037.
 Demand factors have generally been dropping and are expected to further decline in future, indicating an increasing need
for storage of energy to provide resource adequacy and energy/power arbitrage services.
Forecast of changes in load factor from 2017–2037 by region and all of India
Why Indian Grid needs Energy Storage
Costly generation Options During Peak Demand Period
 To fulfill their peak demand, several distribution utilities are already resorting to purchase of energy through short term
energy markets.
 During hours of peak demand, the mean market clearing prices reach around Rs 6-7 per kWh.
 Investments in new thermal generating plants to cater to the peak and short term demand may not be economically
prudent in the long run.
 Due to fuel shortages, poor utilization and lack of profitability, India witnessed amount of Rs 3-4.5 trillion ($40-60 billion)
in form of stranded generating assets by the end of 2020.
 A 4-hour lithium-ion battery may currently substitute underutilized and expensive open-cycle gas power plants in the
country and will compete with underutilized combined-cycle-gas turbine generators by 2025
Peak and annual demand deficits by region, 2015–2020
Why Indian Grid needs Energy Storage
Curtailment of Variable Renewable Energy
In Rajasthan, 61.9 GWh of wind power was curtailed from Sep 2019 to May
2020.
From August 2019 to May 2020, 0.3 percent i.e. 10 GWh of wind and 4% i.e. 185
GWh of solar in Andhra Pradesh were curtailed.
One solution to reduce curtailment is by increasing the flexibility of
conventional generators and frequent start stops but this can raise O&M
expenses and reduce the generators’ operating life and lead to enhancement of
per unit emissions.
by leveling out the output from renewable generators, energy storage will go a
long way to reduce renewable energy curtailments
Assessment of various Energy storage technologies
Following characteristics have been selected
for assessment after through literature survey
and considering Indian scenario:
1. Power and Energy density
2. Technological maturity
3. Round-trip efficiency
4. Self-discharge rate
5. Whole-life cycle cost and Investment
6. Chronological life
7. Response time
8. Carbon footprint and Environmental impact
1 Pumped Hydro storage (PHS)
2 Compressed air storage (CAES)
3 Flywheel energy storage (FES)
4 Lead acid battery (Pb-Acid)
5 Lithium-Ion battery (LiB)
6 Sodium Sulphur battery (NaS)
7 Vanadium Redox Flow battery
8 Super Capacitors
9 Hydrogen fuel cell (PEMFC)
10 Thermal storage (Reaction heat)
Following storage technologies have been
considered:
Assessment of various Energy storage technologies
 The selected performance characteristics of interest are standardized for adequately
analyzing the viability of technology in the electricity value chain. The scale has been
divided in to 0 to 10 with the range in-between worst and best performance being judged
accordingly.
Assessment of various Energy storage technologies
Power and Energy density Simply put energy density is defined as the quantum of energy stored in a given mass or
volume, while the quantity of power stored in a specified mass is termed as power density.
S.No
.
Storage technology Power density,
kW/m3
Energy Density, kWh/m3
1 Pumped Hydro storage (PHS) 0.01-0.12 0.5-133
2 Compressed air storage (CAES) 0.04-10 0.4-20
3 Flywheel energy storage (FES) 40-2000 0.25-424
4 Lead acid battery (Pb-Acid) 10-400 25-90
5 Lithium-Ion battery (LiB) 56-800 94-500
6 Sodium Sulphur battery (NaS) 1.3-50 150-345
7 Vanadium Redox Flow battery 2.5-33.4 10-33
8 Super Capacitors 15-4500 1-35
9 Hydrogen fuel cell (PEMFC) 4.20–35.00 112.20–770.00
10 Thermal storage (Reaction heat) 300
S.No
.
Storage technology Power density rating Energy Density rating
1 Pumped Hydro storage (PHS) 0 3.14
2 Compressed air storage (CAES) 0.05 0.47
3 Flywheel energy storage (FES) 10 10
4 Lead acid battery (Pb-Acid) 5 1.80
5 Lithium-Ion battery (LiB) 10 10
6 Sodium Sulphur battery (NaS) 1.67 2.06
7 Vanadium Redox Flow battery 10 4.71
8 Super Capacitors 10 0
9 Hydrogen fuel cell (PEMFC) 10 8
10 Thermal storage (Reaction heat) 1.78
Energy and Power densities of various technologies Energy and Power densities ratings of various technologies
Higher the power and energy densities better is the technology therefore equation Rank(Fi)= 10(1−(max−Fi)/max) has
been used to calculate ratings of above mentioned ten storage technologies. Where the value is given in a range, average of
highest and lowest value has been taken
Assessment of various Energy storage technologies
Technological maturity
Technological maturity ratings of various technologies
Each of the above technology's unique attribute of technological maturity is standardized as "2" corresponding to
"developing", "4" to under demo, "6" to commercialization, "8" to marketed, and "10" to fully established technologies
S.No. Storage technology Technological maturity rating
1 Pumped Hydro storage (PHS) 10
2 Compressed air storage (CAES) 8
3 Flywheel energy storage (FES) 4
4 Lead acid battery (Pb-Acid) 10
5 Lithium-Ion battery (LiB) 10
6 Sodium Sulphur battery (NaS) 6
7 Vanadium Redox Flow battery 4
8 Super Capacitors 4
9 Hydrogen fuel cell (PEMFC) 4
10 Thermal storage (Reaction heat) 2
Assessment of various Energy storage technologies
Round-trip efficiency The round trip efficiency which is also termed as AC/AC efficiency is the ratio of input energy
in MWh to energy recovered from storage system in units of MWh, given in percent terms.
RTE of various technologies RTE ratings of various technologies
Normalization of Round trip efficiencies has been done using equation Rating (ηi) = 10 ηi which denotes
poor performance with "0" and an ideal performance of 100% with a rating of "10".
S.No. Storage technology Round trip efficiency
1 Pumped Hydro storage (PHS) 70-85
2 Compressed air storage (CAES) 42-54
3 Flywheel energy storage (FES) 90-95
4 Lead acid battery (Pb-Acid) 85-90
5 Lithium-Ion battery (LiB) 98
6 Sodium Sulphur battery (NaS) 89-92
7 Vanadium Redox Flow battery 85
8 Super Capacitors 85-98
9 Hydrogen fuel cell (PEMFC) 30
10 Thermal storage (Reaction heat) 96
S.No. Storage technology RTE rating
1 Pumped Hydro storage (PHS) 8.50
2 Compressed air storage (CAES) 5.40
3 Flywheel energy storage (FES) 9.50
4 Lead acid battery (Pb-Acid) 9.00
5 Lithium-Ion battery (LiB) 10.00
6 Sodium Sulphur battery (NaS) 9.20
7 Vanadium Redox Flow battery 8.50
8 Super Capacitors 9.80
9 Hydrogen fuel cell (PEMFC) 3.80
10 Thermal storage (Reaction heat) 9.60
Assessment of various Energy storage technologies
Self-discharge rate Self-discharge rate is especially significant for items with longer runtime/larger capacity
batteries, or for products that will be stored in idle settings for extended periods of time.
Self discharge rate of various technologies RTE ratings for self discharge rate various technologies
Normalization of Self discharge rate has been done using equation Rating (S DRi) = 10(1−S DRi) which
denotes poor performance with "0" and an ideal performance of 100% with a rating of "10".
S.No. Storage technology Self-discharge rate(%/Day)
1 Pumped Hydro storage (PHS) 0.00
2 Compressed air storage (CAES) 0.00
3 Flywheel energy storage (FES) 24.00-100.00
4 Lead acid battery (Pb-Acid) 0.033-1.10
5 Lithium-Ion battery (LiB) 0.03-0.33
6 Sodium Sulphur battery (NaS) 0.00-20.00
7 Vanadium Redox Flow battery 0.30
8 Super Capacitors 0.46-40.00
9 Hydrogen fuel cell (PEMFC) 0.00
10 Thermal storage (Reaction heat) 0.50
S.No. Storage technology Self-discharge rate rating
1 Pumped Hydro storage (PHS) 10.00
2 Compressed air storage (CAES) 10.00
3 Flywheel energy storage (FES) 4.50
4 Lead acid battery (Pb-Acid) 9.99
5 Lithium-Ion battery (LiB) 10.00
6 Sodium Sulphur battery (NaS) 10.00
7 Vanadium Redox Flow battery 10.00
8 Super Capacitors 8.00
9 Hydrogen fuel cell (PEMFC) 10.00
10 Thermal storage (Reaction heat) 9.00
Assessment of various Energy storage technologies
Investment and whole-life cost The investment and whole life cost can be divided into capital cost of energy, capital
cost of power and average O&M cost. Table below depicts these costs for different
storage technologies.
Life-cycle cost of various technologies Life-cycle cost ratings ratings of various technologies
Normalization of life-cycle cost has been done using equation Rating (Ci) = (10) (max−Ci)/max which
denotes poor performance with "0" and an ideal performance of 100% with a rating of "10".
S.N
o.
Storage technology Energy Capital cost
($/kWH)
Power capital
cost ($/kW)
Average O&M
cost ($/kW-year)
1 Pumped Hydro
storage (PHS)
5.00-100.00 600.00-2000.00 3.00
2 Compressed air
storage (CAES)
2.00-50.00 400.00-800.00 19.00-25.00
3 Flywheel energy
storage (FES)
1000-5000 250.00-350.00 20.00
4 Lead acid battery
(Pb-Acid)
200-400 300.00-600.00 50.00
5 Lithium-Ion battery
(LiB)
600-2500 1200.00-
4000.00
0.00
6 Sodium Sulphur
battery (NaS)
300-500 >1000.00 80.00
7 Vanadium Redox
Flow battery
150-1000 600.00-1500.00 70.00
8 Super Capacitors 300-2000 100.00-300.00 6.00
9 Hydrogen fuel cell
(PEMFC)
70-13000 0.00-10200.00 0.00
10 Thermal storage
(Reaction heat)
10.90-137.00 2500.00-
7900.00
-
S.N
o.
Storage technology Energy Capital
cost ($/kWH)
Power capital
cost ($/kW)
Average O&M
cost ($/kW-year)
1 Pumped Hydro storage (PHS) 9.95 0.00 8.50
2 Compressed air storage (CAES) 9.98 3.33 0.50
3 Flywheel energy storage (FES) 0.00 5.83 0.00
4 Lead acid battery (Pb-Acid) 7.50 7.50 0.00
5 Lithium-Ion battery (LiB) 2.50 0.00 10.00
6 Sodium Sulphur battery (NaS) 0.00 0.00 0.00
7 Vanadium Redox Flow battery 0.00 1.43 0.00
8 Super Capacitors 7.00 5.00 6.76
9 Hydrogen fuel cell (PEMFC) 9.50 5.00 10.00
10 Thermal storage (Reaction heat) 8.50 0.00 -
Assessment of various Energy storage technologies
Cycle and chronological life
Cycle and chronological life of various technologies Cycle and chronological life ratings ratings of various technologies
Normalization of Cycle and chronological life has been done using equation Rank(Fi)= 10(1−(max−Fi)/max) which
denotes poor performance with "0" and an ideal performance of 100% with a rating of "10".
S.No. Storage technology Lifetime
(years)
Cycling time
(cycles)
1 Pumped Hydro storage (PHS) 30-50 10000-30000
2 Compressed air storage (CAES) 30 8000-12000
3 Flywheel energy storage (FES) 20 105-107
4 Lead acid battery (Pb-Acid) 5-15 200-2000
5 Lithium-Ion battery (LiB) 5-15 3000-10000
6 Sodium Sulphur battery (NaS) 10-15 1500-5000
7 Vanadium Redox Flow battery 5-10 >16000
8 Super Capacitors 10-12 10000-1000000
9 Hydrogen fuel cell (PEMFC) 5-15 20000
10 Thermal storage (Reaction heat) 20-40 -
S.N
o.
Storage technology Lifetime ratings Cycling time ratings
1 Pumped Hydro storage (PHS) 10.00 0.03
2 Compressed air storage (CAES) 6.00 0.01
3 Flywheel energy storage (FES) 4.00 10.00
4 Lead acid battery (Pb-Acid) 7.50 2.00
5 Lithium-Ion battery (LiB) 7.50 10.00
6 Sodium Sulphur battery (NaS) 5.00 2.00
7 Vanadium Redox Flow battery 6.67 10.00
8 Super Capacitors 6.00 0.10
9 Hydrogen fuel cell (PEMFC) 5.00 10.00
10 Thermal storage (Reaction heat) 9.50 -
Assessment of various Energy storage technologies
Response Time and ramp rates
Response time of various technologies Response time ratings of various technologies
Normalization of Response time has been done using equation Rating (Rt) = (10) (max−Rt)/max which denotes
poor performance with "0" and an ideal performance of 100% with a rating of "10".
Fast-acting energy storage may be able to deliver better dynamic grid
services (such as frequency control) than traditional options.
S.No. Storage technology Average response time
1 Pumped Hydro storage (PHS) 1-2 Mins
2 Compressed air storage (CAES) 1-2 Mins
3 Flywheel energy storage (FES) < 4 ms
4 Lead acid battery (Pb-Acid) 5-10 ms
5 Lithium-Ion battery (LiB) 20 ms
6 Sodium Sulphur battery (NaS) 1 ms
7 Vanadium Redox Flow battery 1 sec
8 Super Capacitors <2 ms
9 Hydrogen fuel cell (PEMFC) 1 sec
10 Thermal storage (Reaction heat) 2-5 mins
S.No. Storage technology Average response time rating
1 Pumped Hydro storage (PHS) 0
2 Compressed air storage (CAES) 0
3 Flywheel energy storage (FES) 10
4 Lead acid battery (Pb-Acid) 8
5 Lithium-Ion battery (LiB) 8
6 Sodium Sulphur battery (NaS) 10
7 Vanadium Redox Flow battery 6
8 Super Capacitors 10
9 Hydrogen fuel cell (PEMFC) 6
10 Thermal storage (Reaction heat) 0
Energy storage policy & regulatory challenges in India
Following are some of the policy and regulatory challenges that require attention
 Energy storage for grid has been identified and included in national planning being done by
Niti Ayog but is yet absent from National electricity policy and national electricity plan.
 No targets or programs have been identified and specified by Government regarding Grid
scale energy storage.
 Opportunities for energy storage to meet flexibility needs are not fully appreciated and
promoted.
 R&D efforts for energy storage are getting little Government support and lacking needed
thrust.
 The domestic manufacturing support for storage manufacturing from Government is limited
to electric vehicles and not available for grid scale storage projects.
 The ownership models for energy storage have not yet been finalized.
 Energy storage is not yet eligible to provide ancillary services such as frequency regulation
etc.
 The revenue streams are not well defined and many services that storage can provide are
not yet marketable.
Key findings and recommendations
Technology Centric
 Despite its limited present use in the area, pumped hydro has tremendous potential for
large-scale grid systems due to the huge hydroelectric infrastructure that many nations
already have in place and the fact that it is a mature and cost-effective technology.
 Li-ion batteries are now the best option for a 4-hour BESS in terms of performance, cost,
cycle life, calendar life and technical maturity.
 CAES along with PSH have the lowest cost in $/kWh for longer-term storage. As a result,
they are competitive with battery storage solutions even at a low E/P ratio.
 If overall cost along with performance and chronological life is considered then redox flow
batteries, which have many installations worldwide appears to be a good choice. While their
RTE is modest, they can enhance their RTE by optimizing their stack and using better flow
battery management methods.
 Despite many advantages lead-acid battery’s cycle life is restricted, owning to a
chronological life of fewer than 3-years after considering one cycle/day.
Key findings and recommendations
Policy Centric
 Government will require a thorough understanding of the technical qualities and benefits of these technologies, as
well as the services they can provide and the most significant regional and power market applications for each.
 Policy makers should roll out ownership models for storage, procurement of services and include storage
characteristics in existing trading algorithms.
 Government should clearly define targets for energy storage to be deployed in future in order to meet the 500 GW
renewable aim. Also, regulators need to acknowledge the role of storage in providing operational flexibility.
 There is a need for more coordination between various bodies, which may be achieved by establishing a
government owned body or a privately driven platform.
 The use of batteries in the transportation industry has been the focus of policies to boost domestic energy storage
manufacturing. Further expanding this initiative to encompass a broader variety of storage applications.
 The existing financial/commercial incentives for storage are inadequate. One strategy to encourage the
development of new storage technologies is to establish comparable purchasing obligations for all storage systems.
 Early-stage investments in battery production can be derisked through start-up incentives, thereby accelerating the
growth of India's indigenous battery manufacturing industry. Land grants, tax incentives, expedited approvals,
attracting foreign investment, direct subsidies, and R&D funding are all possible incentives.
 Existing tax incentives for clean energy technology or other related industries should be extended to energy storage.
Key findings and recommendations
Regulation Centric
 CERC regulations should be regularizing the responsibilities and various laid out ownership models of energy storage
projects.
 Battery Storage System Developer should be made responsible for dedicated transmission infrastructure up to ISTS / InSTS
substations defined by CTU/STU as BESS acts both as a generator and load.
 The transmission charges for BESS may be totally waived off if BESS is charged at least 51 percent in terms of annual
energy by wind and solar energy sources.
 CERC must publish the variable costs at which the charging/discharging energy of BESS will be paid in order to dispatch
BESS under Automatic Generation Control (AGC).
 The Ministry of Power should release a clarification similar to the EV charging station allowing requirements so that
agencies such as transmission licensees can engage in BESS projects without it being considered energy trading.
 Compliance with provisions for energy storage systems (including LVRT, HVRT, Frequency response, Reactive power
management, and so on) is required to ensure that BESS complies Grid Reliability.
 The Expert Group has proposed that current ancillary services regulations be amended to cover energy storage technology
in the grid code.
 MOD criterion, as well as the norms for ancillary services neglect the speed/response time and precision with which
resources providing these services respond. Changing the pricing indicators to favor generators/resources that scale up
quickly, such as energy storage, might reduce overall ancillary service needs.
 Another topic is the compensation for energy storage resources with multiple applications using both the methods of cost
based as well market-based instruments.
Some References
 Palchak, David, Jaquelin Cochran, et al. 2017. Greening the Grid: Pathways to Integrate 175 Gigawatts of Renewable Energy into India’s Electric Grid, Vol. II—Regional Study. Golden,
CO: National Renewable Energy Laboratory, forthcoming.
 Porter, Kevin, Lori Bird, Lisa Schwartz, Mike Hogan, Dave Lamont, and Brendan Kirby. 2012. Meeting Renewable Energy Targets in the West at Least Cost: The Integration Challenge.
Denver, CO: Western Governors’ Association. www.westgov.org/component/docman/doc_download/1610-meeting-renewable-energytargets-in-the-west-at-least-cost-the-integration-
challenge-full-report?Itemid.
 POSOCO (Power System Operation Corporation Limited). 2016. “Electricity Demand Pattern Analysis.” https://posoco.in/reports/electricity-demand-pattern-analysis/volume-i/.
 POSOCO (Power System Operation Corporation Limited). 2016. Flexibility Requirement in Indian Power System. New Delhi: POSOCO National Load Despatch Center.
https://posoco.in/download/flexibility_requirement_in_indian_power_system/?wpdmdl=711.
 REN21 (Renewable Energy Policy Network for the 21st Century). 2016. Renewables 2016 Global Status Report. Paris: Renewable Energy Policy Network for the 21st Century.
http://www.ren21.net/wp content/uploads/2016/10/REN21_GSR2016_FullReport_en_11.pdf.
 Stark, Greg. 2015. A Systematic Approach to Better Understanding Integration Costs. NREL/TP-5D00-64502. Golden, CO: National Renewable Energy
 Laboratory. http://www.nrel.gov/docs/fy15osti/64502.pdf.
 Svenningsen, Lasse. 2010. Power Curves Air Density Correction and Other Power Curve Options in WindPRO. Alborg Ost, Denmark: EMD International A/S. USGS (United States
Geological Survey). 2016. “Land Cover Trends Project.” Last modified July 7. https://landcovertrends.usgs.gov/main/classification.html.
 Ministry of Power, Government of India. 2016. Report of Technical Committee on Large Scale Integration of Renewable Energy. New Delhi: Ministry of Power.
http://powermin.nic.in/sites/default/files/uploads/Final_Consolidated_Report_RE_Technical_Committee.pdf.
 MNRE (Ministry of New and Renewable Power, Government of India). 2017. “Tentative State-wise break-up of Renewable Power target to ‘be achieved by the year 2022.”
http://mnre.gov.in/file-manager/UserFiles/Tentative-State-wise-break-up-of-Renewable-Power-by-2022.pdf.
 OECD/IEA. 2016. World Energy Outlook 2016. http://nrel.libguides.com/market
 Ong, Sean, Clinton Campbell, Paul Denholm, Robert Margolis, and Garvin Heath. 2013. Land-Use Requirements for Solar Power Plants in the United States. NREL/TP-6A20-56290.
Golden, CO: National Renewable Energy Laboratory. http://www.nrel.gov/docs/fy13osti/56290.pdf.
Comments, Queries and Feedback are welcome…..
07-03-2022
Thank You

Energy storage ppt

  • 1.
    Grid scale energystorage - Potential solutions for India
  • 2.
    Contents 01 Intent anddriver behind the Project 02 Introduction to Energy Storage 03 Why Indian Grid needs energy storage 04 Technologies for Grid level energy storage 06 Assessment of various technologies 07 Energy storage policy landscape in India 08 Key findings and recommendations
  • 3.
    Intent and driverbehind the project  India has made some bold promises at COP-26 all of which must be met by 2030. These are- 1. Renewable energy will provide 50% of total electricity 2. 500 GW of installed renewable energy capacity to be achieved 3. Carbon intensity to be reduced by 45% 4. Cut total carbon emissions of India by 1 billion tonnes  For achieving 500 GW RE by 2030 and net zero by 2070, India cannot escape deploying Grid level energy storage considering the variability and uncertainty associated with such a large-scale renewable integration.  The uncertainty and variability that comes with RE poses a threat to both Grid security as well as reliability if not accounted for properly.  Grid frequency and voltage balancing therefore become challenging as never before and novel ways and means are required to accomplish them.  Energy Storage can prove to be a viable solution and will be inevitable for Indian case.  The project report will try to assess the whole value chain of different energy storage technologies (right from raw material sourcing, manufacturing and deployment/operation in Grid) on basis of carefully selected eight factors Bhadla, Raj Complex Situation Solar eclipse, 21st June 2020
  • 4.
    Introduction to EnergyStorage  Systems that can gather and store energy for a span of time before releasing it to provide energy or power services are termed as energy storage systems.  Energy storage systems can help in closing the geographical and temporal gaps between energy supply and demand.  Throughout the energy system, energy storage technologies may be used on big and on small scales and in both centralized and distributed configurations.  Grid frequency and voltage balancing therefore become challenging as never before and novel ways and means are required to accomplish them.  Many technologies are well established or nearing maturity, the majority of the energy storage technologies are still in their early phases of development and their full potential can be realized only after further research efforts.  Pumped storage hydroelectricity, which was initially used in the 1890s, is one of the earliest kinds of grid level energy storage.  Energy storage facilitate increased integration of intermittent renewable energy resources which is becoming more apparent as the focus on energy system decarbonization grows.
  • 5.
    Introduction to EnergyStorage The Electrical Energy storage can be classified based on the form of storage as followings – Electricity storage – Mechanical Pumped storage hydropower (abbreviated as PSH) Compressed air energy storage (abbreviated as CAES) Flywheels (abbreviated as FES) Electricity storage – Electrochemical Lithium-ion batteries Sodium Sulphur batteries Lead acid batteries Vanadium Redox flow batteries Electricity storage – Electrical Super capacitors (abbreviated as SC) Superconducting Magnetic energy storage (abbreviated as SME) Electricity storage – Chemical Hydrogen storage Ammonia storage Electricity storage – Thermal Underground thermal energy storage (UTES) Pit storage Molten salts Solid media storage Hot and cold-water storage Ice storage PCM slurry storage Thermochemical storage (phase change materials)
  • 6.
    Introduction to EnergyStorage What Energy storage can provide -  Storage of energy on seasonal basis to cope up with seasonal generation changes and disruptions  Use of energy storage for arbitrage trade in power market  Regulation of frequency – Grid balancing  Demand following and resource adequacy  Reactive power support to Grid  Black start support  Congestion alleviation for T&D and postponement of infrastructure investment  Demand shifting to level out peak demand  Off-grid capabilities for far flung areas along with renewables  Integration of variable supply resources in large quantum into Grid  Utilization of wasted/rejected heat from various process  Reserves for spinning and non-spinning requirements of Grid
  • 7.
    Why Indian Gridneeds Energy Storage Need for additional flexibility due to sharp net demand ramp rates  The ramping requirements have increased over the years which will become further challenging by 2030 with 500 GW RE. Hourly ramp rates of demand and thermal generation in India from 2008–2020 Ramp rates frequency distribution in India in 2027  The National Electricity Plan (Generation) has stressed on the importance of having fast ramping capability for large-scale renewable energy in the grid (NEP 2018).  Specifically, there are more periods of time where the ramping demands of the system are above 6,000 MW/hour.  Central Electricity Authority (Technical Standard for Construction of Electrical Plant and Electrical Lines) requires thermal generators to be capable of providing 3%–5% ramp rate.
  • 8.
    Why Indian Gridneeds Energy Storage Increased need of reactive power support  The Indian electric grid has 104 GW of renewable energy installed capacity. plans to integrate 500 GW of RE by 2030. Voltage stability is one of the issues that high Renewable Energy (RE) adoption brings. Voltage profile at a solar pooling substation for a month Over and under voltages in Indian Grid – 2020 Energy storage systems such as battery storage and PHS can operate in all four quadrants thereby providing necessary amounts of reactive power to grid.
  • 9.
    Why Indian Gridneeds Energy Storage Inertial response and primary frequency regulation  Increased grid integration of renewable sources, which have almost little or no inertia, may have a negative influence on the power system's reliability and stability.  RES-based plants do not offer inertial response or engage in load- frequency control on their own, and their large-scale integration might result in a loss of sufficient inertial response and primary frequency reserve.  If these plants are to supply inertia or PFR, some reserve must be maintained. However, by using this method, the maximum power potential of the renewable sources is not captured, which is extremely undesirable.  According to POSOCO, between 2014 and 2018 system-level inertia dropped slightly at certain moments in time, when renewables were especially high.  Some high VRE states like Gujarat may already face declining localized inertia by 2030 Impact of increasing RE penetration frequency response over the years
  • 10.
    Why Indian Gridneeds Energy Storage Low or reducing Electricity demand Load Factor  Low load factors imply demand instability and may need the construction of capital-intensive infrastructure to supply demand for only a limited time.  The load factor in India decreased by 2% between 2016 and 2020. The overall load factor is expected to drop another 4% by year 2037.  Demand factors have generally been dropping and are expected to further decline in future, indicating an increasing need for storage of energy to provide resource adequacy and energy/power arbitrage services. Forecast of changes in load factor from 2017–2037 by region and all of India
  • 11.
    Why Indian Gridneeds Energy Storage Costly generation Options During Peak Demand Period  To fulfill their peak demand, several distribution utilities are already resorting to purchase of energy through short term energy markets.  During hours of peak demand, the mean market clearing prices reach around Rs 6-7 per kWh.  Investments in new thermal generating plants to cater to the peak and short term demand may not be economically prudent in the long run.  Due to fuel shortages, poor utilization and lack of profitability, India witnessed amount of Rs 3-4.5 trillion ($40-60 billion) in form of stranded generating assets by the end of 2020.  A 4-hour lithium-ion battery may currently substitute underutilized and expensive open-cycle gas power plants in the country and will compete with underutilized combined-cycle-gas turbine generators by 2025 Peak and annual demand deficits by region, 2015–2020
  • 12.
    Why Indian Gridneeds Energy Storage Curtailment of Variable Renewable Energy In Rajasthan, 61.9 GWh of wind power was curtailed from Sep 2019 to May 2020. From August 2019 to May 2020, 0.3 percent i.e. 10 GWh of wind and 4% i.e. 185 GWh of solar in Andhra Pradesh were curtailed. One solution to reduce curtailment is by increasing the flexibility of conventional generators and frequent start stops but this can raise O&M expenses and reduce the generators’ operating life and lead to enhancement of per unit emissions. by leveling out the output from renewable generators, energy storage will go a long way to reduce renewable energy curtailments
  • 13.
    Assessment of variousEnergy storage technologies Following characteristics have been selected for assessment after through literature survey and considering Indian scenario: 1. Power and Energy density 2. Technological maturity 3. Round-trip efficiency 4. Self-discharge rate 5. Whole-life cycle cost and Investment 6. Chronological life 7. Response time 8. Carbon footprint and Environmental impact 1 Pumped Hydro storage (PHS) 2 Compressed air storage (CAES) 3 Flywheel energy storage (FES) 4 Lead acid battery (Pb-Acid) 5 Lithium-Ion battery (LiB) 6 Sodium Sulphur battery (NaS) 7 Vanadium Redox Flow battery 8 Super Capacitors 9 Hydrogen fuel cell (PEMFC) 10 Thermal storage (Reaction heat) Following storage technologies have been considered:
  • 14.
    Assessment of variousEnergy storage technologies  The selected performance characteristics of interest are standardized for adequately analyzing the viability of technology in the electricity value chain. The scale has been divided in to 0 to 10 with the range in-between worst and best performance being judged accordingly.
  • 15.
    Assessment of variousEnergy storage technologies Power and Energy density Simply put energy density is defined as the quantum of energy stored in a given mass or volume, while the quantity of power stored in a specified mass is termed as power density. S.No . Storage technology Power density, kW/m3 Energy Density, kWh/m3 1 Pumped Hydro storage (PHS) 0.01-0.12 0.5-133 2 Compressed air storage (CAES) 0.04-10 0.4-20 3 Flywheel energy storage (FES) 40-2000 0.25-424 4 Lead acid battery (Pb-Acid) 10-400 25-90 5 Lithium-Ion battery (LiB) 56-800 94-500 6 Sodium Sulphur battery (NaS) 1.3-50 150-345 7 Vanadium Redox Flow battery 2.5-33.4 10-33 8 Super Capacitors 15-4500 1-35 9 Hydrogen fuel cell (PEMFC) 4.20–35.00 112.20–770.00 10 Thermal storage (Reaction heat) 300 S.No . Storage technology Power density rating Energy Density rating 1 Pumped Hydro storage (PHS) 0 3.14 2 Compressed air storage (CAES) 0.05 0.47 3 Flywheel energy storage (FES) 10 10 4 Lead acid battery (Pb-Acid) 5 1.80 5 Lithium-Ion battery (LiB) 10 10 6 Sodium Sulphur battery (NaS) 1.67 2.06 7 Vanadium Redox Flow battery 10 4.71 8 Super Capacitors 10 0 9 Hydrogen fuel cell (PEMFC) 10 8 10 Thermal storage (Reaction heat) 1.78 Energy and Power densities of various technologies Energy and Power densities ratings of various technologies Higher the power and energy densities better is the technology therefore equation Rank(Fi)= 10(1−(max−Fi)/max) has been used to calculate ratings of above mentioned ten storage technologies. Where the value is given in a range, average of highest and lowest value has been taken
  • 16.
    Assessment of variousEnergy storage technologies Technological maturity Technological maturity ratings of various technologies Each of the above technology's unique attribute of technological maturity is standardized as "2" corresponding to "developing", "4" to under demo, "6" to commercialization, "8" to marketed, and "10" to fully established technologies S.No. Storage technology Technological maturity rating 1 Pumped Hydro storage (PHS) 10 2 Compressed air storage (CAES) 8 3 Flywheel energy storage (FES) 4 4 Lead acid battery (Pb-Acid) 10 5 Lithium-Ion battery (LiB) 10 6 Sodium Sulphur battery (NaS) 6 7 Vanadium Redox Flow battery 4 8 Super Capacitors 4 9 Hydrogen fuel cell (PEMFC) 4 10 Thermal storage (Reaction heat) 2
  • 17.
    Assessment of variousEnergy storage technologies Round-trip efficiency The round trip efficiency which is also termed as AC/AC efficiency is the ratio of input energy in MWh to energy recovered from storage system in units of MWh, given in percent terms. RTE of various technologies RTE ratings of various technologies Normalization of Round trip efficiencies has been done using equation Rating (ηi) = 10 ηi which denotes poor performance with "0" and an ideal performance of 100% with a rating of "10". S.No. Storage technology Round trip efficiency 1 Pumped Hydro storage (PHS) 70-85 2 Compressed air storage (CAES) 42-54 3 Flywheel energy storage (FES) 90-95 4 Lead acid battery (Pb-Acid) 85-90 5 Lithium-Ion battery (LiB) 98 6 Sodium Sulphur battery (NaS) 89-92 7 Vanadium Redox Flow battery 85 8 Super Capacitors 85-98 9 Hydrogen fuel cell (PEMFC) 30 10 Thermal storage (Reaction heat) 96 S.No. Storage technology RTE rating 1 Pumped Hydro storage (PHS) 8.50 2 Compressed air storage (CAES) 5.40 3 Flywheel energy storage (FES) 9.50 4 Lead acid battery (Pb-Acid) 9.00 5 Lithium-Ion battery (LiB) 10.00 6 Sodium Sulphur battery (NaS) 9.20 7 Vanadium Redox Flow battery 8.50 8 Super Capacitors 9.80 9 Hydrogen fuel cell (PEMFC) 3.80 10 Thermal storage (Reaction heat) 9.60
  • 18.
    Assessment of variousEnergy storage technologies Self-discharge rate Self-discharge rate is especially significant for items with longer runtime/larger capacity batteries, or for products that will be stored in idle settings for extended periods of time. Self discharge rate of various technologies RTE ratings for self discharge rate various technologies Normalization of Self discharge rate has been done using equation Rating (S DRi) = 10(1−S DRi) which denotes poor performance with "0" and an ideal performance of 100% with a rating of "10". S.No. Storage technology Self-discharge rate(%/Day) 1 Pumped Hydro storage (PHS) 0.00 2 Compressed air storage (CAES) 0.00 3 Flywheel energy storage (FES) 24.00-100.00 4 Lead acid battery (Pb-Acid) 0.033-1.10 5 Lithium-Ion battery (LiB) 0.03-0.33 6 Sodium Sulphur battery (NaS) 0.00-20.00 7 Vanadium Redox Flow battery 0.30 8 Super Capacitors 0.46-40.00 9 Hydrogen fuel cell (PEMFC) 0.00 10 Thermal storage (Reaction heat) 0.50 S.No. Storage technology Self-discharge rate rating 1 Pumped Hydro storage (PHS) 10.00 2 Compressed air storage (CAES) 10.00 3 Flywheel energy storage (FES) 4.50 4 Lead acid battery (Pb-Acid) 9.99 5 Lithium-Ion battery (LiB) 10.00 6 Sodium Sulphur battery (NaS) 10.00 7 Vanadium Redox Flow battery 10.00 8 Super Capacitors 8.00 9 Hydrogen fuel cell (PEMFC) 10.00 10 Thermal storage (Reaction heat) 9.00
  • 19.
    Assessment of variousEnergy storage technologies Investment and whole-life cost The investment and whole life cost can be divided into capital cost of energy, capital cost of power and average O&M cost. Table below depicts these costs for different storage technologies. Life-cycle cost of various technologies Life-cycle cost ratings ratings of various technologies Normalization of life-cycle cost has been done using equation Rating (Ci) = (10) (max−Ci)/max which denotes poor performance with "0" and an ideal performance of 100% with a rating of "10". S.N o. Storage technology Energy Capital cost ($/kWH) Power capital cost ($/kW) Average O&M cost ($/kW-year) 1 Pumped Hydro storage (PHS) 5.00-100.00 600.00-2000.00 3.00 2 Compressed air storage (CAES) 2.00-50.00 400.00-800.00 19.00-25.00 3 Flywheel energy storage (FES) 1000-5000 250.00-350.00 20.00 4 Lead acid battery (Pb-Acid) 200-400 300.00-600.00 50.00 5 Lithium-Ion battery (LiB) 600-2500 1200.00- 4000.00 0.00 6 Sodium Sulphur battery (NaS) 300-500 >1000.00 80.00 7 Vanadium Redox Flow battery 150-1000 600.00-1500.00 70.00 8 Super Capacitors 300-2000 100.00-300.00 6.00 9 Hydrogen fuel cell (PEMFC) 70-13000 0.00-10200.00 0.00 10 Thermal storage (Reaction heat) 10.90-137.00 2500.00- 7900.00 - S.N o. Storage technology Energy Capital cost ($/kWH) Power capital cost ($/kW) Average O&M cost ($/kW-year) 1 Pumped Hydro storage (PHS) 9.95 0.00 8.50 2 Compressed air storage (CAES) 9.98 3.33 0.50 3 Flywheel energy storage (FES) 0.00 5.83 0.00 4 Lead acid battery (Pb-Acid) 7.50 7.50 0.00 5 Lithium-Ion battery (LiB) 2.50 0.00 10.00 6 Sodium Sulphur battery (NaS) 0.00 0.00 0.00 7 Vanadium Redox Flow battery 0.00 1.43 0.00 8 Super Capacitors 7.00 5.00 6.76 9 Hydrogen fuel cell (PEMFC) 9.50 5.00 10.00 10 Thermal storage (Reaction heat) 8.50 0.00 -
  • 20.
    Assessment of variousEnergy storage technologies Cycle and chronological life Cycle and chronological life of various technologies Cycle and chronological life ratings ratings of various technologies Normalization of Cycle and chronological life has been done using equation Rank(Fi)= 10(1−(max−Fi)/max) which denotes poor performance with "0" and an ideal performance of 100% with a rating of "10". S.No. Storage technology Lifetime (years) Cycling time (cycles) 1 Pumped Hydro storage (PHS) 30-50 10000-30000 2 Compressed air storage (CAES) 30 8000-12000 3 Flywheel energy storage (FES) 20 105-107 4 Lead acid battery (Pb-Acid) 5-15 200-2000 5 Lithium-Ion battery (LiB) 5-15 3000-10000 6 Sodium Sulphur battery (NaS) 10-15 1500-5000 7 Vanadium Redox Flow battery 5-10 >16000 8 Super Capacitors 10-12 10000-1000000 9 Hydrogen fuel cell (PEMFC) 5-15 20000 10 Thermal storage (Reaction heat) 20-40 - S.N o. Storage technology Lifetime ratings Cycling time ratings 1 Pumped Hydro storage (PHS) 10.00 0.03 2 Compressed air storage (CAES) 6.00 0.01 3 Flywheel energy storage (FES) 4.00 10.00 4 Lead acid battery (Pb-Acid) 7.50 2.00 5 Lithium-Ion battery (LiB) 7.50 10.00 6 Sodium Sulphur battery (NaS) 5.00 2.00 7 Vanadium Redox Flow battery 6.67 10.00 8 Super Capacitors 6.00 0.10 9 Hydrogen fuel cell (PEMFC) 5.00 10.00 10 Thermal storage (Reaction heat) 9.50 -
  • 21.
    Assessment of variousEnergy storage technologies Response Time and ramp rates Response time of various technologies Response time ratings of various technologies Normalization of Response time has been done using equation Rating (Rt) = (10) (max−Rt)/max which denotes poor performance with "0" and an ideal performance of 100% with a rating of "10". Fast-acting energy storage may be able to deliver better dynamic grid services (such as frequency control) than traditional options. S.No. Storage technology Average response time 1 Pumped Hydro storage (PHS) 1-2 Mins 2 Compressed air storage (CAES) 1-2 Mins 3 Flywheel energy storage (FES) < 4 ms 4 Lead acid battery (Pb-Acid) 5-10 ms 5 Lithium-Ion battery (LiB) 20 ms 6 Sodium Sulphur battery (NaS) 1 ms 7 Vanadium Redox Flow battery 1 sec 8 Super Capacitors <2 ms 9 Hydrogen fuel cell (PEMFC) 1 sec 10 Thermal storage (Reaction heat) 2-5 mins S.No. Storage technology Average response time rating 1 Pumped Hydro storage (PHS) 0 2 Compressed air storage (CAES) 0 3 Flywheel energy storage (FES) 10 4 Lead acid battery (Pb-Acid) 8 5 Lithium-Ion battery (LiB) 8 6 Sodium Sulphur battery (NaS) 10 7 Vanadium Redox Flow battery 6 8 Super Capacitors 10 9 Hydrogen fuel cell (PEMFC) 6 10 Thermal storage (Reaction heat) 0
  • 22.
    Energy storage policy& regulatory challenges in India Following are some of the policy and regulatory challenges that require attention  Energy storage for grid has been identified and included in national planning being done by Niti Ayog but is yet absent from National electricity policy and national electricity plan.  No targets or programs have been identified and specified by Government regarding Grid scale energy storage.  Opportunities for energy storage to meet flexibility needs are not fully appreciated and promoted.  R&D efforts for energy storage are getting little Government support and lacking needed thrust.  The domestic manufacturing support for storage manufacturing from Government is limited to electric vehicles and not available for grid scale storage projects.  The ownership models for energy storage have not yet been finalized.  Energy storage is not yet eligible to provide ancillary services such as frequency regulation etc.  The revenue streams are not well defined and many services that storage can provide are not yet marketable.
  • 23.
    Key findings andrecommendations Technology Centric  Despite its limited present use in the area, pumped hydro has tremendous potential for large-scale grid systems due to the huge hydroelectric infrastructure that many nations already have in place and the fact that it is a mature and cost-effective technology.  Li-ion batteries are now the best option for a 4-hour BESS in terms of performance, cost, cycle life, calendar life and technical maturity.  CAES along with PSH have the lowest cost in $/kWh for longer-term storage. As a result, they are competitive with battery storage solutions even at a low E/P ratio.  If overall cost along with performance and chronological life is considered then redox flow batteries, which have many installations worldwide appears to be a good choice. While their RTE is modest, they can enhance their RTE by optimizing their stack and using better flow battery management methods.  Despite many advantages lead-acid battery’s cycle life is restricted, owning to a chronological life of fewer than 3-years after considering one cycle/day.
  • 24.
    Key findings andrecommendations Policy Centric  Government will require a thorough understanding of the technical qualities and benefits of these technologies, as well as the services they can provide and the most significant regional and power market applications for each.  Policy makers should roll out ownership models for storage, procurement of services and include storage characteristics in existing trading algorithms.  Government should clearly define targets for energy storage to be deployed in future in order to meet the 500 GW renewable aim. Also, regulators need to acknowledge the role of storage in providing operational flexibility.  There is a need for more coordination between various bodies, which may be achieved by establishing a government owned body or a privately driven platform.  The use of batteries in the transportation industry has been the focus of policies to boost domestic energy storage manufacturing. Further expanding this initiative to encompass a broader variety of storage applications.  The existing financial/commercial incentives for storage are inadequate. One strategy to encourage the development of new storage technologies is to establish comparable purchasing obligations for all storage systems.  Early-stage investments in battery production can be derisked through start-up incentives, thereby accelerating the growth of India's indigenous battery manufacturing industry. Land grants, tax incentives, expedited approvals, attracting foreign investment, direct subsidies, and R&D funding are all possible incentives.  Existing tax incentives for clean energy technology or other related industries should be extended to energy storage.
  • 25.
    Key findings andrecommendations Regulation Centric  CERC regulations should be regularizing the responsibilities and various laid out ownership models of energy storage projects.  Battery Storage System Developer should be made responsible for dedicated transmission infrastructure up to ISTS / InSTS substations defined by CTU/STU as BESS acts both as a generator and load.  The transmission charges for BESS may be totally waived off if BESS is charged at least 51 percent in terms of annual energy by wind and solar energy sources.  CERC must publish the variable costs at which the charging/discharging energy of BESS will be paid in order to dispatch BESS under Automatic Generation Control (AGC).  The Ministry of Power should release a clarification similar to the EV charging station allowing requirements so that agencies such as transmission licensees can engage in BESS projects without it being considered energy trading.  Compliance with provisions for energy storage systems (including LVRT, HVRT, Frequency response, Reactive power management, and so on) is required to ensure that BESS complies Grid Reliability.  The Expert Group has proposed that current ancillary services regulations be amended to cover energy storage technology in the grid code.  MOD criterion, as well as the norms for ancillary services neglect the speed/response time and precision with which resources providing these services respond. Changing the pricing indicators to favor generators/resources that scale up quickly, such as energy storage, might reduce overall ancillary service needs.  Another topic is the compensation for energy storage resources with multiple applications using both the methods of cost based as well market-based instruments.
  • 26.
    Some References  Palchak,David, Jaquelin Cochran, et al. 2017. Greening the Grid: Pathways to Integrate 175 Gigawatts of Renewable Energy into India’s Electric Grid, Vol. II—Regional Study. Golden, CO: National Renewable Energy Laboratory, forthcoming.  Porter, Kevin, Lori Bird, Lisa Schwartz, Mike Hogan, Dave Lamont, and Brendan Kirby. 2012. Meeting Renewable Energy Targets in the West at Least Cost: The Integration Challenge. Denver, CO: Western Governors’ Association. www.westgov.org/component/docman/doc_download/1610-meeting-renewable-energytargets-in-the-west-at-least-cost-the-integration- challenge-full-report?Itemid.  POSOCO (Power System Operation Corporation Limited). 2016. “Electricity Demand Pattern Analysis.” https://posoco.in/reports/electricity-demand-pattern-analysis/volume-i/.  POSOCO (Power System Operation Corporation Limited). 2016. Flexibility Requirement in Indian Power System. New Delhi: POSOCO National Load Despatch Center. https://posoco.in/download/flexibility_requirement_in_indian_power_system/?wpdmdl=711.  REN21 (Renewable Energy Policy Network for the 21st Century). 2016. Renewables 2016 Global Status Report. Paris: Renewable Energy Policy Network for the 21st Century. http://www.ren21.net/wp content/uploads/2016/10/REN21_GSR2016_FullReport_en_11.pdf.  Stark, Greg. 2015. A Systematic Approach to Better Understanding Integration Costs. NREL/TP-5D00-64502. Golden, CO: National Renewable Energy  Laboratory. http://www.nrel.gov/docs/fy15osti/64502.pdf.  Svenningsen, Lasse. 2010. Power Curves Air Density Correction and Other Power Curve Options in WindPRO. Alborg Ost, Denmark: EMD International A/S. USGS (United States Geological Survey). 2016. “Land Cover Trends Project.” Last modified July 7. https://landcovertrends.usgs.gov/main/classification.html.  Ministry of Power, Government of India. 2016. Report of Technical Committee on Large Scale Integration of Renewable Energy. New Delhi: Ministry of Power. http://powermin.nic.in/sites/default/files/uploads/Final_Consolidated_Report_RE_Technical_Committee.pdf.  MNRE (Ministry of New and Renewable Power, Government of India). 2017. “Tentative State-wise break-up of Renewable Power target to ‘be achieved by the year 2022.” http://mnre.gov.in/file-manager/UserFiles/Tentative-State-wise-break-up-of-Renewable-Power-by-2022.pdf.  OECD/IEA. 2016. World Energy Outlook 2016. http://nrel.libguides.com/market  Ong, Sean, Clinton Campbell, Paul Denholm, Robert Margolis, and Garvin Heath. 2013. Land-Use Requirements for Solar Power Plants in the United States. NREL/TP-6A20-56290. Golden, CO: National Renewable Energy Laboratory. http://www.nrel.gov/docs/fy13osti/56290.pdf.
  • 27.
    Comments, Queries andFeedback are welcome….. 07-03-2022 Thank You