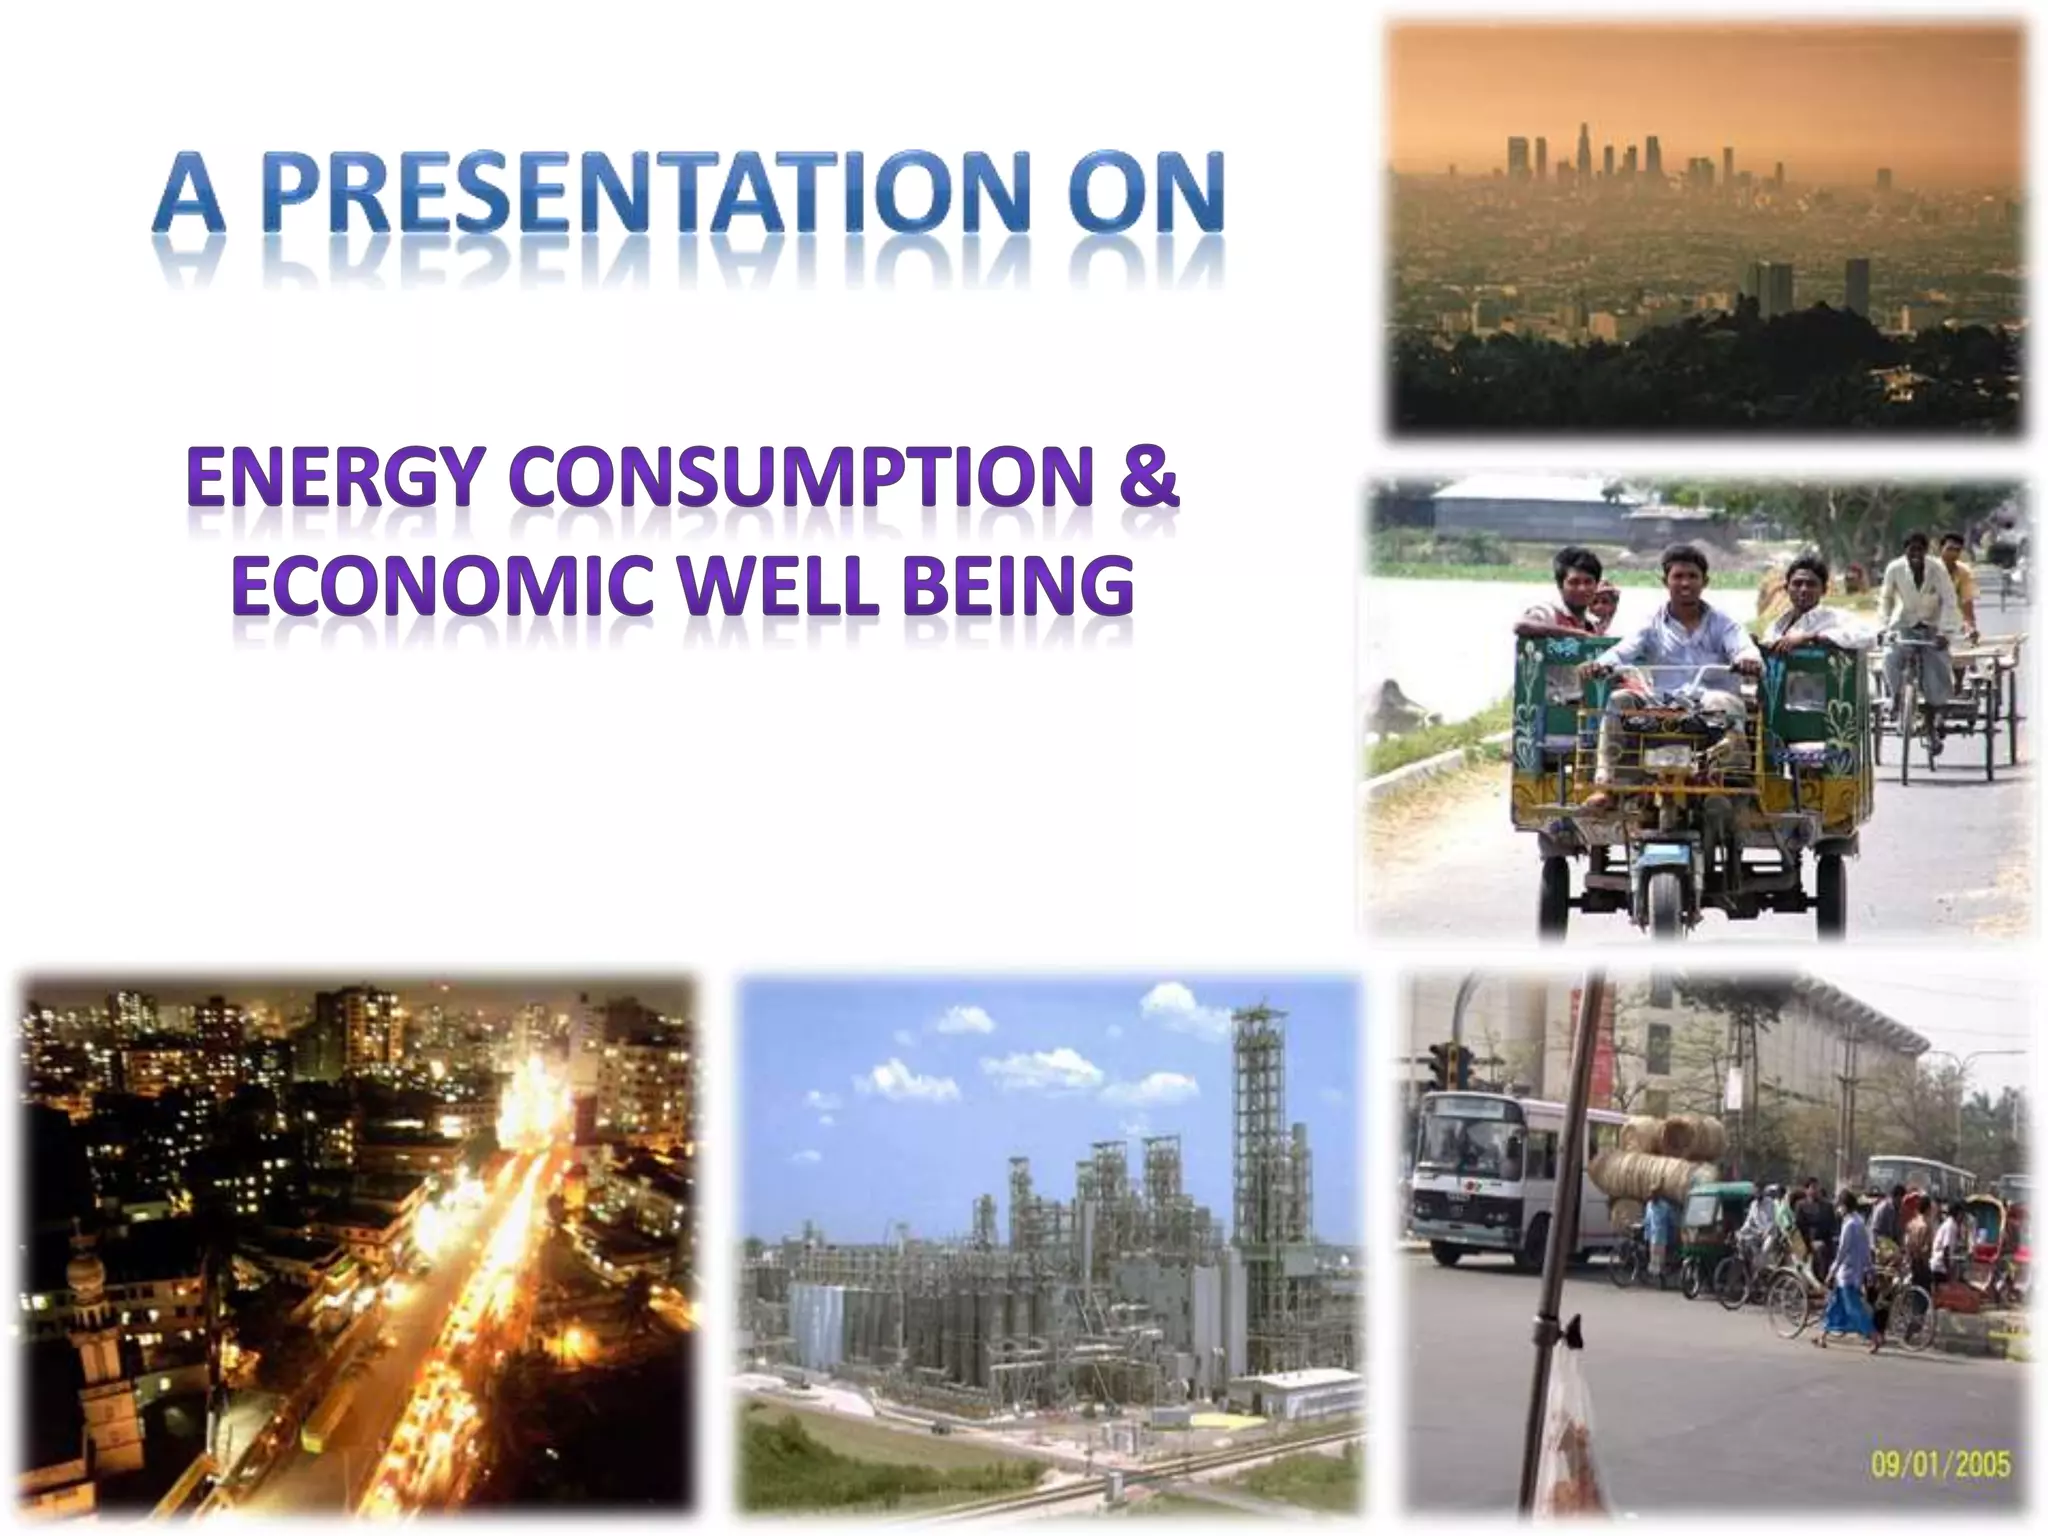
This document discusses energy consumption trends globally and by various countries and sectors. It makes three key points:
1. Energy is essential for improving living standards and powering economic development as countries industrialize. Energy supplies will need to expand to meet growing demand.
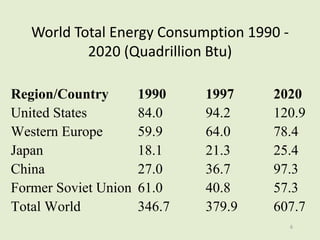
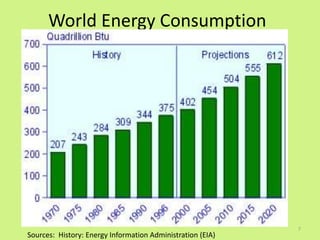
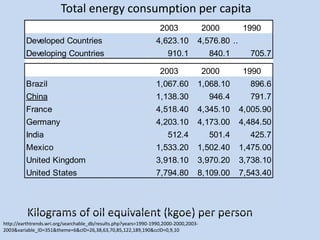
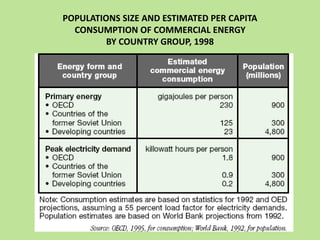
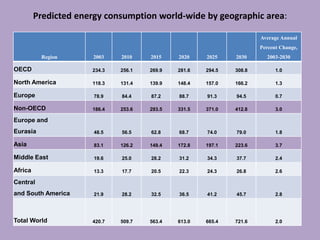
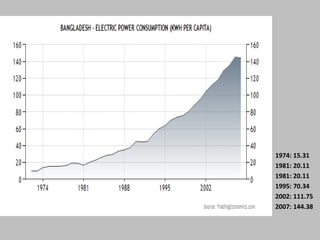
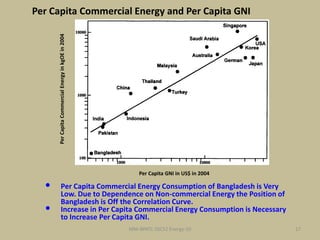
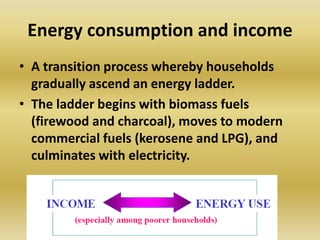
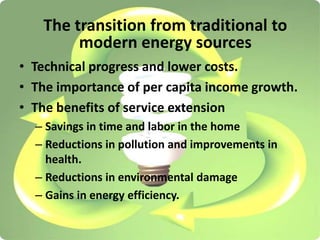
2. Total energy consumption and per capita energy usage has increased significantly in recent decades, especially in developing countries like China, and is projected to continue rising to support economic growth.
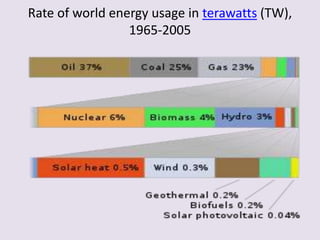
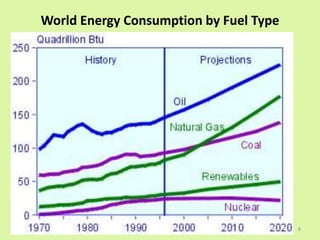
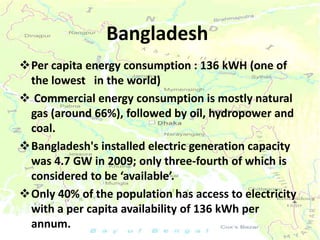
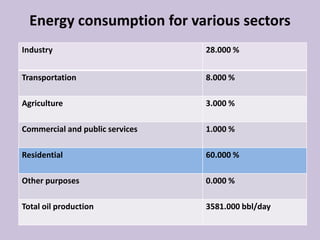
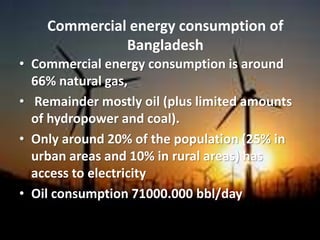
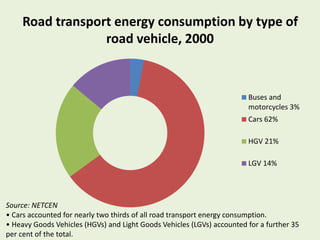
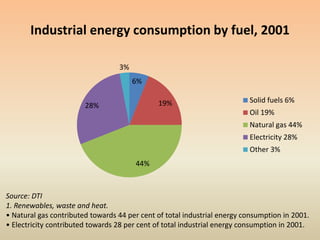
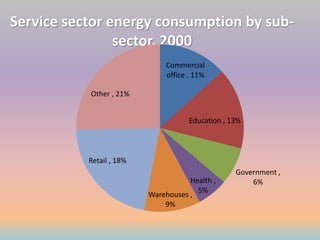
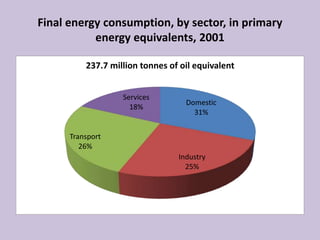
3. Transportation, industry, and residential sectors account for the majority of energy consumption, with natural gas and oil being the dominant fuel sources globally and in most countries. Improving energy efficiency can reduce costs for economies.