This document provides a summary of a report on the elasticity of demand in India's power industry from 1970-2012. It finds that India's energy elasticity was initially elastic from 1970-1976 but then decreased below 1 until increasing again after 2008. The report analyzes India's historical energy consumption patterns, current energy mix dominated by coal, and challenges around increasing demand, energy security, and reducing emissions. It concludes that deregulating energy prices could increase efficiency while still protecting low-income groups.
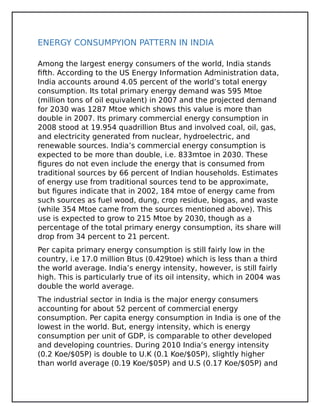
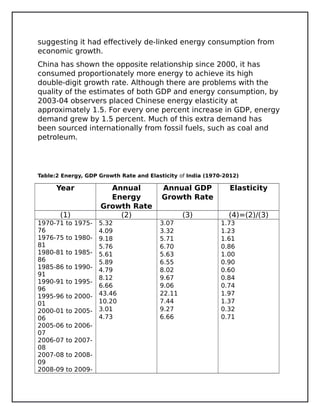
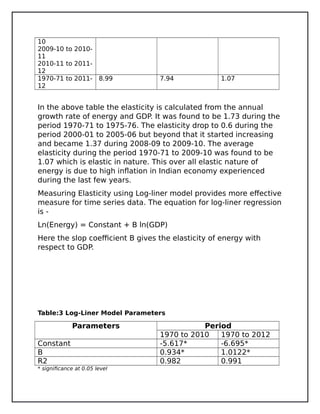
![lower than Asia (0.22 Koe/$05P) and China (0.28 Koe/$05P) [6]
.Thus there is a huge scope for energy conservation in the
country. The Energy Consumption Pattern of India during the past
four decades are presented in Fig.1
Figure:1 Energy Consumption Pattern– India (1970-2012)
Source : Energy Statistics, 2013, CSO, Govt. of India.
From the above graph it was found that the per capita energy
consumption in India increases steadily. During 1970-71 the per
capita was around 1204.39 KWHr and increased to 4646.87 KWHr
in 2009-2010. The energy consumption per capita increased
around 2.85 fold (3442.48 KWHr) during the last four decades.
The energy intensity was 0.1284 KWHr / Rs during 1970-71 and it
increased to 0.1653 KWHr / Rs during 1985-86. There after it
decreases to 0.1224 KWHr / Rs during 2009-10.](https://image.slidesharecdn.com/elasticityreport-160916165516/85/Elasticity-report-4-320.jpg)