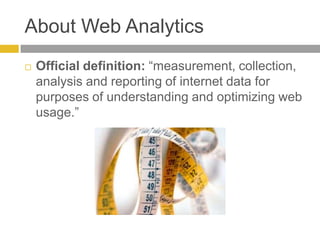
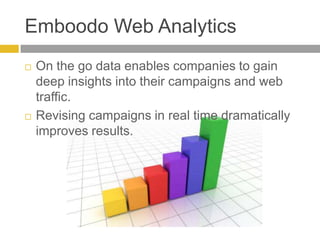
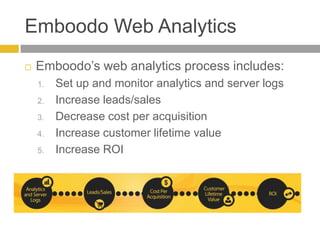
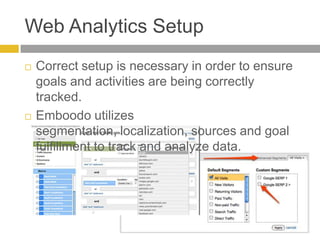
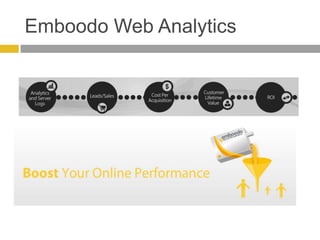
Emboodo believes that web analytics is much more than a measurement tool. We use web analytics as a tool for business research and real-time optimization in order to improve website and campaign performance.
Google Analytics: Configuring 10 Key Ecommerce MetricsPunit Kumar Tiwari
Google Analytics provides 10 key metrics and techniques for tracking ecommerce metrics on a website, including: 1) including ecommerce tracking code, 2) adding campaign tags to inbound links, 3) comparing ecommerce metrics by landing page, 4) understanding the page value metric, 5) checking per visit value by traffic channel, 6) viewing multichannel funnel reports, 7) applying the visits with transactions segment, 8) setting custom intelligence alerts, 9) maintaining a timeline with annotations, and 10) tracking ecommerce in mobile apps. Properly configuring these ecommerce metrics in Google Analytics allows sites to monitor key performance indicators like which campaigns generate sales and what product pages convert best.
Using Google Analytics with your eyes closedOne Further
The document discusses how data from Google Analytics can be used without logging into the tool through setting up custom alerts, automated reports, and integrating with other systems to enhance marketing automation, personalization, customer records, and more. While this level of integration is powerful, it requires the website and analytics setup to be properly configured with clean data and full tracking of ecommerce, campaigns, and other integrations to realize the full benefits.
Intent Based Analytics with Google Analytics and Google Tag ManagerJatin Kochhar
Intent-Based Analytics with Google Analytics and Google Tag Manager. Map google funnel with the marketing funnel. Learn how to track visitor intent through GA and GTM
The content includes the meaning of Google analytics, the demographic of the audience, how to use Google analytics, why is it important to your website and the dark side of Google analytics.
A brief introduction to Web Analytics
For a course in Web Analytics - See more at: http://www.jigsawacademy.com/web-analytics-training#sthash.LsGc9ZIT.dpuf.
This course is for professionals interested in assessing online business performances and students interested in e-commerce marketing & sales careers.
Beginners discussion to - Google Analytics Lee Trevena
Google Analytics is a software program that collects and reports website data. It measures how many people visit a site, how they find it, and what they do while there. Data is collected through JavaScript code on the site which tracks user behavior and sends this information back to Google Analytics. This raw data is then processed into useful metrics and reports. Businesses can use these metrics and reports to improve site performance, track marketing campaigns, and enhance the user experience. Potential future applications of analytics technology include more personalized content, tracking robot and space activities, and uses in healthcare and bio-technology.
Google analytics is a free service offered by Google that generates statistics about the visitors to a website. Google Analytics is a free web analytical tool that can help you create effective sites and increase ROI on marketing campaigns. It can help answer all the important questions about your site and marketing activities, such as:
• Where my customers are coming from
• How to make marketing campaigns move effective
• Where are visitors abandoning the site
• How to improve site navigation
And can help you:
• Help you make informed decisions
• Increase conversions
• Measure keyword and ad performance
• Track a wide variety of metrics
How Google Analytics works.
You will need to insert a Google tracking code into each page of your website. When a person visits your site the code is executed and produces a first party cookie that is stored on the visitor's PC.
The webpage then sends information from this cookie as an invisible gift request containing all the data to Google Analytics server, where it is processed for you to read.
Analysing your traffic
Comparing Metrics
When analysing traffic you need to compare several metrics together. You can not measure your websites performance on pageviews alone.
Comparing the pageviews data with the bounce rate will give a clearer picture of the sites performance.
Example:
Q. If your site received 1,600 page views in week one and 2,000 in week two can you tell which week had the better performance?
A. The answer is no. You have to compare it with the bounce rate.
Week one received 1,600 page views and the bounce rate was 50%
This means half of the people (800 people) who visited these pages left the site straight away.
Week two received 2,000 page views and the bounce rate was 80%
This means only 400 people actually stayed on the site
You can see from the above example the importance of comparing metrics together.
Google Analytics will let you drill down and explore metrics in detail and the information you can get is endless. You may want to investigate what pages the visitors navigated to, where did they go afterwards and where they came from.
Analysing Marketing Campaigns
Google Analytics can help you determine which marketing activity is driving the best traffic to your site. This can be anything from SEO campaigns, referrals, affiliate programs, PPC campaigns, email campaigns and banner ads.
There are two ways you can track your campaigns, auto tagging and manual tagging.
Google AdWords uses auto tagging and automatically populate your reports with click, cost and other data.
For all other campaigns including email, affiliate and banner ads you will have to manually tag your links with campaign identifying information.
Google Analytics vs Omniture SiteCatalyst vs In-ouse Webanalytics at iMetricsRoman Zykov
This document compares Google Analytics, Adobe/Omniture SiteCatalyst, and an in-house web analytics system. It provides an overview of Wikimart's custom system, including its data collection, storage, and users. Key areas of comparison include commerce metrics, campaign management, data export/import, product analytics, and support. The document concludes that for a large e-commerce site like Wikimart, SiteCatalyst is best for deep product analysis and managing a large number of marketing campaigns, while an in-house system enables deep analytics and integration with offline data.
This is EXTREMELY DATED. I performed this prior to 2010 and much of the data is no longer valid. Please contact me to receive a FREE Google Analytics Audit.
NOTE: Concentrates on data collection and value definition ... not feature sets. This PPT combines analysis provided from Google Analytics and WebTrends Analytics for the same data.
Google Analytics is a tool introduced by Google to track the performance of websites and applications. It provides a complete picture of how well a website is performing by displaying collected data that can then be analyzed to gain critical insights into what areas of the site need improvement. Google Analytics allows users to check website traffic, user behavior, conversion rates and other key metrics.
Google Analytics is a web analytics service offered by Google that tracks and reports website traffic, currently as a platform inside the Google Marketing Platform brand.
A basic overview of Google Analytics. The slide talks about how google analytics can help track key information such as visits, unique visitors, pageviews, traffic sources for your website.
It also talks about important features of google analytics such as goals & a brief about account, property & profile views.
Studies upon studies have been done on how efficient you could be, and how much more ROI you’d gain, if you’d just put an organized lead management process in place. Easier said than done though, and best practices are only a good starting point to get your mind around the concept.
Learn Effective decision making with Royal Cyber Digital AnalyticsRoyal Cyber Inc.
This webcast will teach How to Retain Visitors & Increase conversions? How to earn more by being Proactive? How to turn Insights into Answers? How to create segments and analyze them? Inquire more: http://bit.ly/1d0Gj2A
This document provides an overview of Google Analytics basics for online marketers. It introduces key Google Analytics concepts and terminology like views, dashboards, audiences, acquisition, behavior, and conversions. It also covers how to set up an account, incorporate the tracking code, customize date ranges and reports, and ask questions. The goal is to help users understand basic Google Analytics functionality and metrics.
Google Analytics is a free web analytics service offered by Google that generates detailed statistics about website traffic, sources, conversions, and sales. It tracks visitors from all referrers including search engines, social media, direct visits, and affiliated sites. Integrated with AdWords, it allows users to review online campaign performance by tracking landing page quality and goals like sales, leads, or downloads. Google Analytics provides both high-level dashboard data and more in-depth reports to help optimize websites.
This presentation covers methods to set up Google Analytics on your website. It also includes basic terminologies / jargons / concepts that are used throughout Google Analytics
Google Analytics is a free service provided by Google that allows you to track and analyze traffic to your website. It provides key metrics on visitors, traffic sources, content, goals, and ecommerce (if applicable). To set up Google Analytics, sign up for a Google account if needed, then add a profile for your website and copy and paste the Google Analytics JavaScript code onto your website pages. You can then access reports from anywhere and schedule automated emails with important metrics.
I delivered this presentation in Dublin Web Summit in November 2014.
The session aimed at helping startups to decide what and how to track. I covered why metrics matter and what every startup should measure at different stages of their lifecycle. The session also covered Analytics mistakes that startups must avoid and some Analytics best practices.
Details can be found here: http://websummit.net/
The document discusses different types of adserver solutions that can help increase business revenue, including predictive analytics, revenue optimization, targeting, programmatic advertising, blockchain, in-game, and IPTV. Predictive analytics uses data to identify potential audiences and predict campaign performance. Revenue optimization techniques analyze customer behavior to sell the right products at the right price. Targeting methods identify customer needs and interests to display relevant ads. Programmatic advertising automatically delivers ads across devices based on a user's browsing history and interests. In-game advertising incorporates ads directly into games.
Google Analytics 발표 자료
참고:
구글 애널리틱스: 웹 로그 분석의 시작과 끝 (개정판)
Analytics Academy (https://analyticsacademy.withgoogle.com/)
Google Analytics - Google Developers (https://developers.google.com/analytics/)
Google analytic best website performance checker tool, get complete guide information on website with Google analytics tool for better results and for complete check on information.
The web analytics market is expected to grow from $1.33 billion in 2014 to $3.09 billion in 2019, representing a compound annual growth rate of 18.3%. New technologies have been developed to meet demand for web analytics, which can be used for purposes such as social media analysis, targeting and behavior analysis, display advertising optimization, and multichannel campaign performance monitoring. Key players in the web analytics market include IBM, Adobe Systems, Oracle, SAS, Google, and Yahoo.
Introduction to web analytics and the Google analytics platform pdfMartin Bloomfield
An introduction to Google Analytics - tracking and understanding user behaviour on your website.
Sussex guru Julian Erbsloeh - Head of Insight at Fresh Egg, explains in a little detail to the members of Worthing and Adur Chamber of Commerce at Northbrook College, Worthing.
For a PDF version of the presentation please click the link here https://goo.gl/CV6CLD
See and hear Julian on the YouTube Video version of this presentation: https://youtu.be/WdH1NBnnooU
Critical Mass Marketing Science leverages innovative thinking, modeling, and technology to overcome three big challenges in web measurement: unreliable data, complex reporting needs, and cross-channel attribution. They use tag management systems and analytics auditing tools to ensure reliable data. For complex reporting, they provide web-based reporting and data warehousing for rapid, customized, and accessible reports. Their solutions help clients measure performance, find optimization opportunities, and improve marketing results.
I delivered this presentation to MSc Digital Marketing class of "The UCD Michael Smurfit Graduate Business School - University College Dublin" in February 2015.
The presentation covers some basics and fundamental information about Google Analytics.
Emboodo is a result driven global online marketing company with over 11 years of experience of proven search engine marketing and optimization success.
Le 14 avril 2016, Objectif Papillon organisait à Toulouse une conférence sur les nouvelles pratiques SEO pour que votre site internet reste au top des résultats des moteurs de recherche.
Intervenants :
Laetitia Chessé (Trafimedia) Vincent Moreau (Objectif Papillon), Laurent Brice (Vale Tudo), Alexandre Santoni (Keeg), Marc Laliat (Escale Web), Vincent Moreau et Aurélien Miklas (Objectif Papillon).
http://inarocket.com
Learn BEM fundamentals as fast as possible. What is BEM (Block, element, modifier), BEM syntax, how it works with a real example, etc.
How to Build a Dynamic Social Media PlanPost Planner
Stop guessing and wasting your time on networks and strategies that don’t work!
Join Rebekah Radice and Katie Lance to learn how to optimize your social networks, the best kept secrets for hot content, top time management tools, and much more!
Watch the replay here: bit.ly/socialmedia-plan
The document discusses how personalization and dynamic content are becoming increasingly important on websites. It notes that 52% of marketers see content personalization as critical and 75% of consumers like it when brands personalize their content. However, personalization can create issues for search engine optimization as dynamic URLs and content are more difficult for search engines to index than static pages. The document provides tips for SEOs to help address these personalization and SEO challenges, such as using static URLs when possible and submitting accurate sitemaps.
Lightning Talk #9: How UX and Data Storytelling Can Shape Policy by Mika Aldabaux singapore
How can we take UX and Data Storytelling out of the tech context and use them to change the way government behaves?
Showcasing the truth is the highest goal of data storytelling. Because the design of a chart can affect the interpretation of data in a major way, one must wield visual tools with care and deliberation. Using quantitative facts to evoke an emotional response is best achieved with the combination of UX and data storytelling.
This document summarizes a study of CEO succession events among the largest 100 U.S. corporations between 2005-2015. The study analyzed executives who were passed over for the CEO role ("succession losers") and their subsequent careers. It found that 74% of passed over executives left their companies, with 30% eventually becoming CEOs elsewhere. However, companies led by succession losers saw average stock price declines of 13% over 3 years, compared to gains for companies whose CEO selections remained unchanged. The findings suggest that boards generally identify the most qualified CEO candidates, though differences between internal and external hires complicate comparisons.
SharePoint Marketing Suite - Presentation from Intlock and AtidanDavid J Rosenthal
The document discusses Intlock's SharePoint Marketing Suite, which provides analytics, reporting, and marketing tools integrated with SharePoint. It allows marketers to optimize digital interactions across intranet, extranet, and internet sites built on SharePoint. The suite includes modules for web analytics, campaign tracking, testing and optimization, visitor profiles, customer feedback, SEO, and plugins for CRM integration and third-party tools. It is designed to help enterprises better understand customers, increase demand, empower marketers, and engage audiences.
To increase the website conversion rates a marketer would require a robust, simple, & scalable platform. Here, Sitecore is an excellent web content management tool and also a dynamic marketing tool for marketers.
https://www.raybiztech.com/blog/sitecore/improving-website-conversion-rate-through-sitecore
This document provides an introduction to web analytics. It defines web analytics as the measurement, collection, analysis and reporting of internet data to understand and optimize web usage. The main goals of web analytics are to measure traffic, understand user behavior on websites, and optimize websites. It discusses different categories of web analytics including on-site and off-site analytics. Common web analytics tools like Google Analytics use page tagging to collect data as users interact with websites. Key metrics that web analytics measures are discussed like visits, time on site, bounce rate, and conversion rate. The document also covers common web analytics products, how data is collected and stored, and factors to consider when selecting a web analytics tool.
This document provides an overview of web analytics and Google Analytics. It defines web analytics, discusses ways to analyze data both traditionally and through the web analytics paradigm. It also covers setting up goals and funnels in Google Analytics, using segments, alerts and enhanced ecommerce tracking. A key section discusses attribution modeling and how to set up a custom attribution model based on an understanding of your business and customer journey.
This document discusses web analytics and how it can be used to improve websites and customer experience. It presents a web analytics process that includes defining goals and key performance indicators (KPIs), collecting data from various sources like web logs and JavaScript tagging, analyzing the data to gain insights, and taking action to optimize the website. Good KPIs are described as being uncomplex, relevant, timely, and instantly useful. Various methods of collecting data are explained including web logs, JavaScript tagging, web beacons, and packet sniffing. The importance of analyzing basic metrics first before deeper analyses is also highlighted.
I recently had the pleasure of using "The Click Engine" developed by Jeff Aman, and I must say, it has completely revolutionized my digital marketing strategy. This powerful tool is an absolute game-changer for anyone looking to maximize their online presence and boost conversion rates.
First and foremost, The Click Engine offers an incredibly user-friendly interface. As someone with limited technical expertise, I found it easy to navigate and utilize all its features effectively. The layout is intuitive, and the various functions are well-organized, allowing even beginners to get started quickly.
Les web analitycs présentés par Unica lors de la première WAW en France en mai 2008.
http://www.referencement-blog.net/le-premier-webanalitycs-wednesday-en-france-waw-pour-les-intimes-217
Direct Performance is a consulting company that specializes in business intelligence, marketing campaigns, search engine optimization, and web analytics to help clients achieve their business goals and optimize results. They use data analysis, metrics, and continuous improvement strategies. Their team includes experts from various industries and backgrounds. Direct Performance offers services such as site analytics, media analytics, social media analysis, search engine marketing, SEO consulting, and customized projects. Their goal is to fully understand clients' online performance and provide recommendations to improve results.
Benchmarking Your Online Impact: From Stats to Reputation ManagementNSI Partners, LLC
"Benchmarking Your Online Impact: From Stats to Reputation Management" delivered live at UnTech10, 1:30pm Thursday Feb. 11, 2010; combined from 2 sessions originally scheduled for delivery at the ASAE Technology Conference (canceled due to snowfall in Washington, DC)
This document provides an introduction to web analytics for startups. It discusses how web analytics can be used to understand and optimize web usage, measure the results of marketing campaigns, and provide insights about traffic and popularity trends. The document outlines key metrics for startups to track, including sessions, location, top pages, time on site, bounce rate, pages/visit, traffic sources, and conversions. It also discusses setting goals and dashboards in Google Analytics to track progress and keep track of important metrics. Custom campaign tracking is presented as a way to discover which marketing efforts drive the most traffic and conversions to a website.
This document discusses various tools for digital marketing. It describes search advertising tools like Google Adwords and Microsoft Ad Center for creating search ads. It covers analytics and tracking tools like Google Analytics, Omniture, and ComScore for analyzing website and campaign performance. Additional tools mentioned include Google AdSense for generating ad revenue, Google Trends for keyword research, and Display Planner for planning display campaigns.
Digital marketing includes all marketing efforts which uses an electronic device or the internet. Business firms market themselves in various channels like serch engines, social media emails and other websites to get leads and to connect with existing customers.
To know more about web analytics and internet marketing log on to:
http://www.iexpertsforum.com/smf/index.php
Web analytics is the measurement, collection, analysis and reporting of internet data for purposes of understanding and optimizing web usage.
To assess the performance and to improve your website , it is imperative that you understand the key performance indicators of your site like the traffic, hits, and many more concepts.
Web analytics help you in having a thorough analysis, of how your site is performing which helps you to optimize your site to suit your needs as well as your customer's and clients.
How to use Adobe Analytics features for data analysis & personalization.pdfTech Modena
How to use Adobe Analytics features for data analysis & personalization
With Adobe Analytics features, businesses can conduct thorough data analysis, uncovering valuable insights that enable effective personalization strategies for delivering tailored and engaging experiences to their audience.
Organizations gather a lot of data to understand customers, improve products, and enhance experiences. But analyzing this data for useful insights can be a challenge. That’s where Adobe Analytics comes in.
Adobe Analytics, part of Adobe Experience Cloud, helps businesses make sense of data from various digital channels. It provides real-time insights, enabling effective marketing campaigns and better customer experiences. Integrated with other Adobe platforms, it enhances audience targeting and marketing activities.
Amidst the noise of data, our experts discuss how Adobe Analytics tackles challenges, making data-driven decisions easier and personalizing experiences for every user.
What is Adobe Analytics?
Adobe Analytics, once known as Omniture SiteCatalyst, is a top-notch tool for analyzing data across various channels. It’s a key component of the Adobe Marketing Cloud, offering plugins for assessing campaign performance not just on websites but also on mobile apps and video platforms.
Adobe Analytics empowers marketers by offering valuable insights to make informed decisions. By leveraging this data, marketers aim to increase revenues, boost conversions, and reduce advertising costs. Success with Adobe Analytics, like any data analytics platform, relies on accurately interpreting marketing metrics derived from available data.
Types of Data Captured by Adobe Analytics
Adobe Analytics gathers data from websites, mobile apps, and other sources to create reports. They call this data metrics or key performance indicators (KPIs), showing quantitative info about your website’s performance. The main tracked metric categories are:
Traffic metrics: Details about your visitors, revealing public attention through marketing, PR, and services.
Conversion metrics: Info on user actions to measure website engagement.
Calculated metrics: Custom metrics you create by combining existing ones.
Video metrics: Stats like total views, time spent, and completion rates.
Social metrics: Data to track your brand’s presence on social media.
To protect privacy, Adobe only collects non-personally identifiable information (PII), like a visitor’s zip code, avoiding sensitive data to ensure individual identity remains safe.
Benefits of Adobe Analytics
Quick Web Insights: Adobe Analytics helps you get speedy results by collecting web data in real-time. It’s like having a super-fast tool to understand what’s happening on your website.
Smart Marketing Know-How: We’re not just about analytics; we cover all the new digital stuff. With Adobe Analytics, you can see everything about your customers in one go, getting smart insights in no time.
Better Choices with Attribution: Figure out what’s
Learn how to build and leverage your current customers database in this digital age of disruption, where barriers to play and compete in the marketplace are low.
Data-driven marketing refers to strategies built on insights pulled from the analysis of big data, collected through consumer interactions and engagements, to form predictions about future behaviors.
Learn the following:
* Digital Marketing
* Facebook Ads
* Audience Management
* Events trackings through Pixels
* Digital Advertising
* Google Ads
* Google Analytics
* Google Merchant Center
* Google Tag Manager
* Google Search Console
* eCommerce Marketing
Using Google Analytics for Business Growth - Webinar ReapDigital
Learn how to go beyond the default setup of Google Analytics and adopt a holistic approach to Google Analytics by measuring your business KPI’s, online and offline customer journey and, using analytics to discover actionable insights.
This document provides an introduction to web analytics. It begins with explaining why web analytics is needed by discussing how offline marketing lacks accountability and measurability. It then defines web analytics as the measurement, collection, analysis and reporting of internet data to understand and optimize web usage. The document outlines different types of web analytics including on-site and off-site. It also discusses the history and context of web analytics within decision support systems and business intelligence. Finally, it covers the main website data collection methods of server log file analysis and page tagging.
This document provides an introduction to web analytics. It discusses why web analytics is needed to measure the success of digital marketing efforts. Web analytics involves measuring, collecting, analyzing and reporting internet data to understand and optimize web usage. There are two main methods for collecting web analytics data: server log file analysis and page tagging. Server log files record information from a website's server, while page tagging involves including tracking code on website pages that collects user interaction data. The document outlines the advantages and considerations of each data collection method.
For the full video of this presentation, please visit: https://www.edge-ai-vision.com/2024/06/how-axelera-ai-uses-digital-compute-in-memory-to-deliver-fast-and-energy-efficient-computer-vision-a-presentation-from-axelera-ai/
Bram Verhoef, Head of Machine Learning at Axelera AI, presents the “How Axelera AI Uses Digital Compute-in-memory to Deliver Fast and Energy-efficient Computer Vision” tutorial at the May 2024 Embedded Vision Summit.
As artificial intelligence inference transitions from cloud environments to edge locations, computer vision applications achieve heightened responsiveness, reliability and privacy. This migration, however, introduces the challenge of operating within the stringent confines of resource constraints typical at the edge, including small form factors, low energy budgets and diminished memory and computational capacities. Axelera AI addresses these challenges through an innovative approach of performing digital computations within memory itself. This technique facilitates the realization of high-performance, energy-efficient and cost-effective computer vision capabilities at the thin and thick edge, extending the frontier of what is achievable with current technologies.
In this presentation, Verhoef unveils his company’s pioneering chip technology and demonstrates its capacity to deliver exceptional frames-per-second performance across a range of standard computer vision networks typical of applications in security, surveillance and the industrial sector. This shows that advanced computer vision can be accessible and efficient, even at the very edge of our technological ecosystem.
Driving Business Innovation: Latest Generative AI Advancements & Success StorySafe Software
Are you ready to revolutionize how you handle data? Join us for a webinar where we’ll bring you up to speed with the latest advancements in Generative AI technology and discover how leveraging FME with tools from giants like Google Gemini, Amazon, and Microsoft OpenAI can supercharge your workflow efficiency.
During the hour, we’ll take you through:
Guest Speaker Segment with Hannah Barrington: Dive into the world of dynamic real estate marketing with Hannah, the Marketing Manager at Workspace Group. Hear firsthand how their team generates engaging descriptions for thousands of office units by integrating diverse data sources—from PDF floorplans to web pages—using FME transformers, like OpenAIVisionConnector and AnthropicVisionConnector. This use case will show you how GenAI can streamline content creation for marketing across the board.
Ollama Use Case: Learn how Scenario Specialist Dmitri Bagh has utilized Ollama within FME to input data, create custom models, and enhance security protocols. This segment will include demos to illustrate the full capabilities of FME in AI-driven processes.
Custom AI Models: Discover how to leverage FME to build personalized AI models using your data. Whether it’s populating a model with local data for added security or integrating public AI tools, find out how FME facilitates a versatile and secure approach to AI.
We’ll wrap up with a live Q&A session where you can engage with our experts on your specific use cases, and learn more about optimizing your data workflows with AI.
This webinar is ideal for professionals seeking to harness the power of AI within their data management systems while ensuring high levels of customization and security. Whether you're a novice or an expert, gain actionable insights and strategies to elevate your data processes. Join us to see how FME and AI can revolutionize how you work with data!
5th LF Energy Power Grid Model Meet-up SlidesDanBrown980551
5th Power Grid Model Meet-up
It is with great pleasure that we extend to you an invitation to the 5th Power Grid Model Meet-up, scheduled for 6th June 2024. This event will adopt a hybrid format, allowing participants to join us either through an online Mircosoft Teams session or in person at TU/e located at Den Dolech 2, Eindhoven, Netherlands. The meet-up will be hosted by Eindhoven University of Technology (TU/e), a research university specializing in engineering science & technology.
Power Grid Model
The global energy transition is placing new and unprecedented demands on Distribution System Operators (DSOs). Alongside upgrades to grid capacity, processes such as digitization, capacity optimization, and congestion management are becoming vital for delivering reliable services.
Power Grid Model is an open source project from Linux Foundation Energy and provides a calculation engine that is increasingly essential for DSOs. It offers a standards-based foundation enabling real-time power systems analysis, simulations of electrical power grids, and sophisticated what-if analysis. In addition, it enables in-depth studies and analysis of the electrical power grid’s behavior and performance. This comprehensive model incorporates essential factors such as power generation capacity, electrical losses, voltage levels, power flows, and system stability.
Power Grid Model is currently being applied in a wide variety of use cases, including grid planning, expansion, reliability, and congestion studies. It can also help in analyzing the impact of renewable energy integration, assessing the effects of disturbances or faults, and developing strategies for grid control and optimization.
What to expect
For the upcoming meetup we are organizing, we have an exciting lineup of activities planned:
-Insightful presentations covering two practical applications of the Power Grid Model.
-An update on the latest advancements in Power Grid -Model technology during the first and second quarters of 2024.
-An interactive brainstorming session to discuss and propose new feature requests.
-An opportunity to connect with fellow Power Grid Model enthusiasts and users.
zkStudyClub - LatticeFold: A Lattice-based Folding Scheme and its Application...Alex Pruden
Folding is a recent technique for building efficient recursive SNARKs. Several elegant folding protocols have been proposed, such as Nova, Supernova, Hypernova, Protostar, and others. However, all of them rely on an additively homomorphic commitment scheme based on discrete log, and are therefore not post-quantum secure. In this work we present LatticeFold, the first lattice-based folding protocol based on the Module SIS problem. This folding protocol naturally leads to an efficient recursive lattice-based SNARK and an efficient PCD scheme. LatticeFold supports folding low-degree relations, such as R1CS, as well as high-degree relations, such as CCS. The key challenge is to construct a secure folding protocol that works with the Ajtai commitment scheme. The difficulty, is ensuring that extracted witnesses are low norm through many rounds of folding. We present a novel technique using the sumcheck protocol to ensure that extracted witnesses are always low norm no matter how many rounds of folding are used. Our evaluation of the final proof system suggests that it is as performant as Hypernova, while providing post-quantum security.
Paper Link: https://eprint.iacr.org/2024/257
Dandelion Hashtable: beyond billion requests per second on a commodity serverAntonios Katsarakis
This slide deck presents DLHT, a concurrent in-memory hashtable. Despite efforts to optimize hashtables, that go as far as sacrificing core functionality, state-of-the-art designs still incur multiple memory accesses per request and block request processing in three cases. First, most hashtables block while waiting for data to be retrieved from memory. Second, open-addressing designs, which represent the current state-of-the-art, either cannot free index slots on deletes or must block all requests to do so. Third, index resizes block every request until all objects are copied to the new index. Defying folklore wisdom, DLHT forgoes open-addressing and adopts a fully-featured and memory-aware closed-addressing design based on bounded cache-line-chaining. This design offers lock-free index operations and deletes that free slots instantly, (2) completes most requests with a single memory access, (3) utilizes software prefetching to hide memory latencies, and (4) employs a novel non-blocking and parallel resizing. In a commodity server and a memory-resident workload, DLHT surpasses 1.6B requests per second and provides 3.5x (12x) the throughput of the state-of-the-art closed-addressing (open-addressing) resizable hashtable on Gets (Deletes).
Monitoring and Managing Anomaly Detection on OpenShift.pdfTosin Akinosho
Monitoring and Managing Anomaly Detection on OpenShift
Overview
Dive into the world of anomaly detection on edge devices with our comprehensive hands-on tutorial. This SlideShare presentation will guide you through the entire process, from data collection and model training to edge deployment and real-time monitoring. Perfect for those looking to implement robust anomaly detection systems on resource-constrained IoT/edge devices.
Key Topics Covered
1. Introduction to Anomaly Detection
- Understand the fundamentals of anomaly detection and its importance in identifying unusual behavior or failures in systems.
2. Understanding Edge (IoT)
- Learn about edge computing and IoT, and how they enable real-time data processing and decision-making at the source.
3. What is ArgoCD?
- Discover ArgoCD, a declarative, GitOps continuous delivery tool for Kubernetes, and its role in deploying applications on edge devices.
4. Deployment Using ArgoCD for Edge Devices
- Step-by-step guide on deploying anomaly detection models on edge devices using ArgoCD.
5. Introduction to Apache Kafka and S3
- Explore Apache Kafka for real-time data streaming and Amazon S3 for scalable storage solutions.
6. Viewing Kafka Messages in the Data Lake
- Learn how to view and analyze Kafka messages stored in a data lake for better insights.
7. What is Prometheus?
- Get to know Prometheus, an open-source monitoring and alerting toolkit, and its application in monitoring edge devices.
8. Monitoring Application Metrics with Prometheus
- Detailed instructions on setting up Prometheus to monitor the performance and health of your anomaly detection system.
9. What is Camel K?
- Introduction to Camel K, a lightweight integration framework built on Apache Camel, designed for Kubernetes.
10. Configuring Camel K Integrations for Data Pipelines
- Learn how to configure Camel K for seamless data pipeline integrations in your anomaly detection workflow.
11. What is a Jupyter Notebook?
- Overview of Jupyter Notebooks, an open-source web application for creating and sharing documents with live code, equations, visualizations, and narrative text.
12. Jupyter Notebooks with Code Examples
- Hands-on examples and code snippets in Jupyter Notebooks to help you implement and test anomaly detection models.
Main news related to the CCS TSI 2023 (2023/1695)Jakub Marek
An English 🇬🇧 translation of a presentation to the speech I gave about the main changes brought by CCS TSI 2023 at the biggest Czech conference on Communications and signalling systems on Railways, which was held in Clarion Hotel Olomouc from 7th to 9th November 2023 (konferenceszt.cz). Attended by around 500 participants and 200 on-line followers.
The original Czech 🇨🇿 version of the presentation can be found here: https://www.slideshare.net/slideshow/hlavni-novinky-souvisejici-s-ccs-tsi-2023-2023-1695/269688092 .
The videorecording (in Czech) from the presentation is available here: https://youtu.be/WzjJWm4IyPk?si=SImb06tuXGb30BEH .
Digital Banking in the Cloud: How Citizens Bank Unlocked Their MainframePrecisely
Inconsistent user experience and siloed data, high costs, and changing customer expectations – Citizens Bank was experiencing these challenges while it was attempting to deliver a superior digital banking experience for its clients. Its core banking applications run on the mainframe and Citizens was using legacy utilities to get the critical mainframe data to feed customer-facing channels, like call centers, web, and mobile. Ultimately, this led to higher operating costs (MIPS), delayed response times, and longer time to market.
Ever-changing customer expectations demand more modern digital experiences, and the bank needed to find a solution that could provide real-time data to its customer channels with low latency and operating costs. Join this session to learn how Citizens is leveraging Precisely to replicate mainframe data to its customer channels and deliver on their “modern digital bank” experiences.
The Microsoft 365 Migration Tutorial For Beginner.pptxoperationspcvita
This presentation will help you understand the power of Microsoft 365. However, we have mentioned every productivity app included in Office 365. Additionally, we have suggested the migration situation related to Office 365 and how we can help you.
You can also read: https://www.systoolsgroup.com/updates/office-365-tenant-to-tenant-migration-step-by-step-complete-guide/
Skybuffer SAM4U tool for SAP license adoptionTatiana Kojar
Manage and optimize your license adoption and consumption with SAM4U, an SAP free customer software asset management tool.
SAM4U, an SAP complimentary software asset management tool for customers, delivers a detailed and well-structured overview of license inventory and usage with a user-friendly interface. We offer a hosted, cost-effective, and performance-optimized SAM4U setup in the Skybuffer Cloud environment. You retain ownership of the system and data, while we manage the ABAP 7.58 infrastructure, ensuring fixed Total Cost of Ownership (TCO) and exceptional services through the SAP Fiori interface.
Conversational agents, or chatbots, are increasingly used to access all sorts of services using natural language. While open-domain chatbots - like ChatGPT - can converse on any topic, task-oriented chatbots - the focus of this paper - are designed for specific tasks, like booking a flight, obtaining customer support, or setting an appointment. Like any other software, task-oriented chatbots need to be properly tested, usually by defining and executing test scenarios (i.e., sequences of user-chatbot interactions). However, there is currently a lack of methods to quantify the completeness and strength of such test scenarios, which can lead to low-quality tests, and hence to buggy chatbots.
To fill this gap, we propose adapting mutation testing (MuT) for task-oriented chatbots. To this end, we introduce a set of mutation operators that emulate faults in chatbot designs, an architecture that enables MuT on chatbots built using heterogeneous technologies, and a practical realisation as an Eclipse plugin. Moreover, we evaluate the applicability, effectiveness and efficiency of our approach on open-source chatbots, with promising results.
For the full video of this presentation, please visit: https://www.edge-ai-vision.com/2024/06/temporal-event-neural-networks-a-more-efficient-alternative-to-the-transformer-a-presentation-from-brainchip/
Chris Jones, Director of Product Management at BrainChip , presents the “Temporal Event Neural Networks: A More Efficient Alternative to the Transformer” tutorial at the May 2024 Embedded Vision Summit.
The expansion of AI services necessitates enhanced computational capabilities on edge devices. Temporal Event Neural Networks (TENNs), developed by BrainChip, represent a novel and highly efficient state-space network. TENNs demonstrate exceptional proficiency in handling multi-dimensional streaming data, facilitating advancements in object detection, action recognition, speech enhancement and language model/sequence generation. Through the utilization of polynomial-based continuous convolutions, TENNs streamline models, expedite training processes and significantly diminish memory requirements, achieving notable reductions of up to 50x in parameters and 5,000x in energy consumption compared to prevailing methodologies like transformers.
Integration with BrainChip’s Akida neuromorphic hardware IP further enhances TENNs’ capabilities, enabling the realization of highly capable, portable and passively cooled edge devices. This presentation delves into the technical innovations underlying TENNs, presents real-world benchmarks, and elucidates how this cutting-edge approach is positioned to revolutionize edge AI across diverse applications.
HCL Notes and Domino License Cost Reduction in the World of DLAUpanagenda
Webinar Recording: https://www.panagenda.com/webinars/hcl-notes-and-domino-license-cost-reduction-in-the-world-of-dlau/
The introduction of DLAU and the CCB & CCX licensing model caused quite a stir in the HCL community. As a Notes and Domino customer, you may have faced challenges with unexpected user counts and license costs. You probably have questions on how this new licensing approach works and how to benefit from it. Most importantly, you likely have budget constraints and want to save money where possible. Don’t worry, we can help with all of this!
We’ll show you how to fix common misconfigurations that cause higher-than-expected user counts, and how to identify accounts which you can deactivate to save money. There are also frequent patterns that can cause unnecessary cost, like using a person document instead of a mail-in for shared mailboxes. We’ll provide examples and solutions for those as well. And naturally we’ll explain the new licensing model.
Join HCL Ambassador Marc Thomas in this webinar with a special guest appearance from Franz Walder. It will give you the tools and know-how to stay on top of what is going on with Domino licensing. You will be able lower your cost through an optimized configuration and keep it low going forward.
These topics will be covered
- Reducing license cost by finding and fixing misconfigurations and superfluous accounts
- How do CCB and CCX licenses really work?
- Understanding the DLAU tool and how to best utilize it
- Tips for common problem areas, like team mailboxes, functional/test users, etc
- Practical examples and best practices to implement right away
2. About Web Analytics Official definition: “measurement, collection, analysis and reporting of internet data for purposes of understanding and optimizing web usage.”
3. Emboodo Web Analytics Emboodo believes that web analytics is much more than a measurement tool. Emboodo uses web analytics as a tool for business research and real-time optimization in order to improve website and campaign performance.
4. Emboodo Web Analytics Dual-system Tracking based (also known as Java Script based) such as Google Analytics Web Server log file analysis Connecting Analytics to CRM (SalesForce, Sugar CRM, Oracle) to calculate ROI (return on investment). Segmentation, intelligence and customized tracking per campaign.
5. Emboodo Web Analytics On the go data enables companies to gain deep insights into their campaigns and web traffic. Revising campaigns in real time dramatically improves results.
6. Emboodo Web Analytics Emboodo’s web analytics process includes: Set up and monitor analytics and server logs Increase leads/sales Decrease cost per acquisition Increase customer lifetime value Increase ROI
9. Define Goals Before launching any campaign, it is necessary to define the goals and achievements– whether they are branding, awareness, leads, sales, etc… Emboodo uses these goals and achievements to measure the campaign success.
10. Web Analytics Setup Correct setup is necessary in order to ensure goals and activities are being correctly tracked. Emboodo utilizes segmentation, localization, sources and goal fulfillment to track and analyze data.
11. Segmentation Segmentation divides traffic into smaller subsets in order to analyze specific metrics. Understand web traffic on a deep level. Identify weak and strong online ads, campaigns, user groups, pages and referring sites to improve in almost real-time.
12. Event Tracking Emboodo utilizes Event Tracking to track users interactions on the site. Every action can be tracked and analyzed – from clicking a button to completing a transaction.
13. Business Intelligence Emboodo utilizes Business Intelligence to track specific items on a daily, weekly and monthly basis. Through Intelligence, Emboodo can track what in the campaign and website is working well, and what should be modified.
14. Real-Time Suggestions Business Intelligence and on-the-go analytical data, allow Emboodo to track daily activity and suggest improvements in almost real-time.
15. Explain and share results Numbers and statistics are only useful when interpreted correctly. Emboodo understands the meaning behind the numbers and converts analytical data into improved results for clients. Emboodo shares information with clients in order to empower them to make intelligent decisions based on concrete data.
16. Stay Ahead of the Market Web Analytics is a growing and powerful tool. Web Analytics enables media agencies to better manage and understand company campaigns and web traffic. Stay ahead of the market, and utilize web analytics before clients start using the tool.