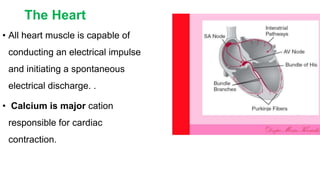
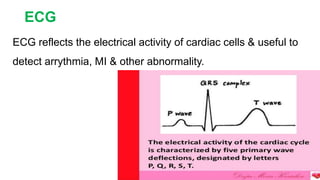
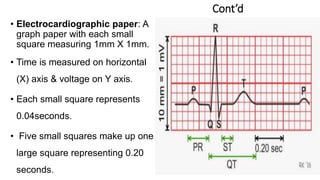
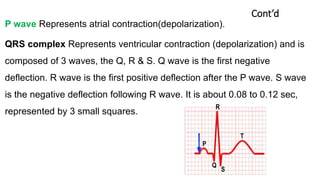
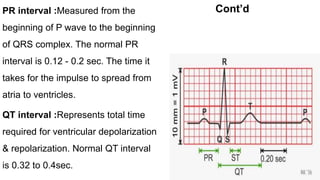
Electrocardiography
Prepared By:
Barsha Silwal
The Heart
• All heart muscle is capable of
conducting an electrical impulse
and initiating a spontaneous
electrical discharge. .
• Calcium is major cation
responsible for cardiac
contraction.
ECG
ECG reflects the electrical activity of cardiac cells & useful to
detect arrythmia, MI & other abnormality.
Cont’d
ECG — A galvanometer & electrodes with four limb leads and
six chest leads which record electrical activity of heart on graph
paper with divisions.
• ECG recorders & monitors are standardized at a speed of
25mm/sec.
Cont’d
• Electrocardiographic paper: A
graph paper with each small
square measuring 1mm X 1mm.
• Time is measured on horizontal
(X) axis & voltage on Y axis.
• Each small square represents
0.04seconds.
• Five small squares make up one
large square representing 0.20
seconds.
Cont’d
In 12 lead ECG
Chest leads-6 (V1,V2,V3,V4,V5&V6 ) Electrode positioned in
the
• V1-4th intercostal space (ICS) in the right sternal border.
• V2-4th ICS in the left sternal border.
• V3- Midway between V2&V4.
• V4-5th ICS in the left midclavicular line.
• V5- Same level as V4, anterior axillary line.
• V6-Same level as V4 & V5, midaxillary line.
Cont’d
Cont’d
P wave Represents atrial contraction(depolarization).
QRS complex Represents ventricular contraction (depolarization) and is
composed of 3 waves, the Q, R & S. Q wave is the first negative
deflection. R wave is the first positive deflection after the P wave. S wave
is the negative deflection following R wave. It is about 0.08 to 0.12 sec,
represented by 3 small squares.
Cont’d
• ST segment representing early ventricular relaxation
(repolarization). Elevated ST segment in MI & depress ST
segment in myocardial ischemia.
• T wave Represents ventricular repolarization. Usually
positive, rounded, & slightly Asymmetric.
• U wave Results from slow repolarization of ventricular
Purkinje fibers. More common in lead V3. Due to
Hypokalemia.
Cont’d
PR interval :Measured from the
beginning of P wave to the beginning
of QRS complex. The normal PR
interval is 0.12 - 0.2 sec. The time it
takes for the impulse to spread from
atria to ventricles.
QT interval :Represents total time
required for ventricular depolarization
& repolarization. Normal QT interval
is 0.32 to 0.4sec.
Indications
• Myocardial Infarction& other types of CAD such as angina
• Cardiac dysrhythmias
• Cardiac enlargement
• Electrolyte disturbances
• Inflammatory diseases of the heart (RHD & myocarditis)
• Effects on the heart by drugs, such as antiarrhythmics.
Cont’d
Cont’d
Cont’d
Cont’d
Cont’d
Electrocardiography.

Electrocardiography.

  • 1.
  • 2.
    The Heart • Allheart muscle is capable of conducting an electrical impulse and initiating a spontaneous electrical discharge. . • Calcium is major cation responsible for cardiac contraction.
  • 3.
    ECG ECG reflects theelectrical activity of cardiac cells & useful to detect arrythmia, MI & other abnormality.
  • 4.
    Cont’d ECG — Agalvanometer & electrodes with four limb leads and six chest leads which record electrical activity of heart on graph paper with divisions. • ECG recorders & monitors are standardized at a speed of 25mm/sec.
  • 5.
    Cont’d • Electrocardiographic paper:A graph paper with each small square measuring 1mm X 1mm. • Time is measured on horizontal (X) axis & voltage on Y axis. • Each small square represents 0.04seconds. • Five small squares make up one large square representing 0.20 seconds.
  • 6.
    Cont’d In 12 leadECG Chest leads-6 (V1,V2,V3,V4,V5&V6 ) Electrode positioned in the • V1-4th intercostal space (ICS) in the right sternal border. • V2-4th ICS in the left sternal border. • V3- Midway between V2&V4. • V4-5th ICS in the left midclavicular line. • V5- Same level as V4, anterior axillary line. • V6-Same level as V4 & V5, midaxillary line.
  • 7.
  • 8.
    Cont’d P wave Representsatrial contraction(depolarization). QRS complex Represents ventricular contraction (depolarization) and is composed of 3 waves, the Q, R & S. Q wave is the first negative deflection. R wave is the first positive deflection after the P wave. S wave is the negative deflection following R wave. It is about 0.08 to 0.12 sec, represented by 3 small squares.
  • 9.
    Cont’d • ST segmentrepresenting early ventricular relaxation (repolarization). Elevated ST segment in MI & depress ST segment in myocardial ischemia. • T wave Represents ventricular repolarization. Usually positive, rounded, & slightly Asymmetric. • U wave Results from slow repolarization of ventricular Purkinje fibers. More common in lead V3. Due to Hypokalemia.
  • 10.
    Cont’d PR interval :Measuredfrom the beginning of P wave to the beginning of QRS complex. The normal PR interval is 0.12 - 0.2 sec. The time it takes for the impulse to spread from atria to ventricles. QT interval :Represents total time required for ventricular depolarization & repolarization. Normal QT interval is 0.32 to 0.4sec.
  • 11.
    Indications • Myocardial Infarction&other types of CAD such as angina • Cardiac dysrhythmias • Cardiac enlargement • Electrolyte disturbances • Inflammatory diseases of the heart (RHD & myocarditis) • Effects on the heart by drugs, such as antiarrhythmics.
  • 12.
  • 13.
  • 14.
  • 15.
  • 16.

Editor's Notes

  • #7 Four limb lead & lead in right leg is for earthing.