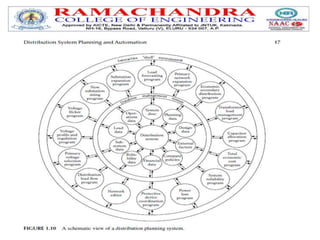
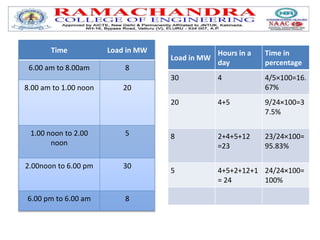
This document discusses future trends in electrical distribution system planning. It predicts that distribution planning will rely heavily on computer tools to optimize network design based on multiple criteria. Load management will also impact distribution by altering load patterns, requiring systems to be designed differently. New automated tools like network editors are expected to enable trial network designs that can be simulated to ensure performance and accommodate load growth. The central role of databases and management systems in supporting these new planning tools is also highlighted.
Generation of High D.C. Voltage (HVDC generation)RP6997
Generation of high dc voltage using different methods like half wave and full wave rectifier, voltage doubler circuits, voltage multiplier circuits, cockcroft-walton circuits and van de graaff generators.
Generation of High D.C. Voltage (HVDC generation)RP6997
Generation of high dc voltage using different methods like half wave and full wave rectifier, voltage doubler circuits, voltage multiplier circuits, cockcroft-walton circuits and van de graaff generators.
Electrical Technology was founded on the remarkable discovery by Faraday that a changing magnetic flux creates an electric field. Out of that discovery, grew the largest and most complex engineering achievement of man : the electric power system. Indeed, life without electricity is now unimaginable. Electric power systems form the basic infrastructure of a country. Even as we read this, electrical energy is being produced at rates in excess of hundreds of giga-watts (1 GW = 1,000,000,000 W). Giant rotors spinning at speeds up to 3000 rotations per minute bring us the energy stored in the potential energy of water, or in fossil fuels. Yet we notice electricity only when the lights go out!
While the basic features of the electrical power system have remained practically unchanged in the past century, but there are some significant milestones in the evolution of electrical power systems.
Power Quality is a combination of Voltage profile, Frequency profile, Harmonics contain and reliability of power supply.
The Power Quality is defined as the degree to which the power supply approaches the ideal case of stable, uninterrupted, zero distortion and disturbance free supply.
HVDC (high-voltage direct current) is a highly efficient alternative for transmitting large amounts of electricity over long distances and for special purpose applications.
We had made a working model on static VAR compensator which is made by power electronic switch and mechanically switched. We had chosen mechanically switched capacitor method to improved receiving end voltage as well as power factor.
Development of a Suitable Load Balancing Strategy In Case Of a Cloud Computi...IJMER
Cloud computing is an attracting technology in the field of computer science. In
Gartner’s report, it says that the cloud will bring changes to the IT industry. The cloud is changing
our life by providing users with new types of services. Users get service from a cloud without paying
attention to the details. NIST gave a definition of cloud computing as a model for enabling
ubiquitous, convenient, on-demand network access to a shared pool of configurable computing
resources (e.g., networks, servers, storage, applications, and services) that can be rapidly
provisioned and released with minimal management effort or service provider interaction. More
and more people pay attention to cloud computing. Cloud computing is efficient and scalable but
maintaining the stability of processing so many jobs in the cloud computing environment is a very
complex problem with load balancing receiving much attention for researchers. Since the job
arrival pattern is not predictable and the capacities of each node in the cloud differ, for load
balancing problem, workload control is crucial to improve system performance and maintain
stability. Load balancing schemes depending on whether the system dynamics are important can be
either static or dynamic. Static schemes do not use the system information and are less complex
while dynamic schemes will bring additional costs for the system but can change as the system
status changes. A dynamic scheme is used here for its flexibility. The model has a main controller
and balancers to gather and analyze the information. Thus, the dynamic control has little influence
on the other working nodes. The system status then provides a basis for choosing the right load
balancing strategy. The load balancing model given in this research article is aimed at the public
cloud which has numerous nodes with distributed computing resources in many different
geographic locations. Thus, this model divides the public cloud into several cloud partitions. When
the environment is very large and complex, these divisions simplify the load balancing. The cloud
has a main controller that chooses the suitable partitions for arriving jobs while the balancer for
each cloud partition chooses the best load balancing strategy.
A distributed system can be viewed as an environment in which, number of computers/nodes are connected and resources are shared among these computers/nodes. But unfortunately, distributed systems often face the problem of traffic, which can degrade the performance of the system. Traffic management is used to improve scalability and overall system throughput in distributed systems using Software Defined Network (SDN) based systems. Traffic management improves system performance by dividing the work traffic effectively among the participating computers/nodes. Many algorithms were proposed for traffic management and their performance is measured based on certain parameters such as response time, resource utilization, and fault tolerance. Traffic management algorithms are broadly classified into two categories- scheduling and machine learning traffic management. This work presents the study of performance analysis of traffic management algorithms. This analysis can further help in the design of new algorithms. However, when multiple servers are assigned to compile the mysterious code, different kinds of techniques are used. One common example is traffic management. The processes are managed based on power efficiency, networking bandwidth, Processor speed. The desired output will again send back to the developer. If multiple programs have to be compiled then appropriate technique such as scheduling algorithm is used. So the compilation process becomes faster and also the other process can get a chance to compile. SDN based clustering algorithm based on Simulated Annealing whose main goal is to increase network lifetime while maintaining adequate sensing coverage in scenarios where sensor nodes produce uniform or non-uniform data traffic.
Advanced Automated Approach for Interconnected Power System Congestion ForecastPower System Operation
system operators need the solution that
will allow them to keep the electrical grid secure in
spite of frequent changes in network loadings. The
Day-ahead congestion forecast (DACF) is a part of
congestion management process that becomes more
and more important. This paper contains the
description of an approach to automate the DACF for
an interconnected power system network. Using the
existing industrial tools and workflows automation
system, the congestion forecast system runs in fully
automatic mode, significantly reducing need of
specialist resources in operational congestion
management process. The realisation of the advanced
automated approach allows a quick, efficient and cost
effective method for energy management that could be
easily adopted by transmission system operators.
MULTIOBJECTIVE OPTIMIZATION AND QUANTITATIVE TRADE-OFF ANALYSIS IN XEROGRAPHI...Sudhendu Rai
A complex engineering system such as a xerographic marking engine is an aggregate of interacting subsystems that are coupled through a large number of constraints and design variables. The traditional way of designing these systems is to decouple the overall design into smaller subsystems and assign teams to work on these subsystems. This approach is critical to making the project manageable and enabling concurrent development. However, if the goal is to design systems that can deliver best possible performance, i.e. if the performance limits are being pushed to the extreme, characterizing the interactions becomes critical.
Multiobjective optimization is a design methodology that addresses the issue of designing large systems where the goal is to simultaneously optimize a finite number of performance criteria that come from one or more disciplines and are coupled through a set of design variables and constraints. This approach to design makes explicit and quantitative the inherent trade-offs that need to be made in doing coupled system design. It also enables the determination of the attainable limits of performance from a given system.
This paper will discuss the multiobjective optimization methodology and optimal methods of performing quantitative trade-off analysis. These design methods will be applied to problems from the xerographic design domain and results will be presented.
IMPACT OF RESOURCE MANAGEMENT AND SCALABILITY ON PERFORMANCE OF CLOUD APPLICA...IJCSEA Journal
Cloud computing facilitates service providers to rent their computing capabilities for deploying
applications depending on user requirements. Applications of cloud have diverse composition,
configuration and deployment requirements. Quantifying the performance of applications in Cloud
computing environments is a challenging task. In this paper, we try to identify various parameters
associated with performance of cloud applications and analyse the impact of resource management and
scalability among them.
IMPACT OF RESOURCE MANAGEMENT AND SCALABILITY ON PERFORMANCE OF CLOUD APPLICA...IJCSEA Journal
Cloud computing facilitates service providers to rent their computing capabilities for deploying applications depending on user requirements. Applications of cloud have diverse composition, configuration and deployment requirements. Quantifying the performance of applications in Cloud computing environments is a challenging task. In this paper, we try to identify various parameters associated with performance of cloud applications and analyse the impact of resource management and scalability among them.
IMPACT OF RESOURCE MANAGEMENT AND SCALABILITY ON PERFORMANCE OF CLOUD APPLICA...IJCSEA Journal
Cloud computing facilitates service providers to rent their computing capabilities for deploying
applications depending on user requirements. Applications of cloud have diverse composition,
configuration and deployment requirements. Quantifying the performance of applications in Cloud
computing environments is a challenging task. In this paper, we try to identify various parameters
associated with performance of
Explore the innovative world of trenchless pipe repair with our comprehensive guide, "The Benefits and Techniques of Trenchless Pipe Repair." This document delves into the modern methods of repairing underground pipes without the need for extensive excavation, highlighting the numerous advantages and the latest techniques used in the industry.
Learn about the cost savings, reduced environmental impact, and minimal disruption associated with trenchless technology. Discover detailed explanations of popular techniques such as pipe bursting, cured-in-place pipe (CIPP) lining, and directional drilling. Understand how these methods can be applied to various types of infrastructure, from residential plumbing to large-scale municipal systems.
Ideal for homeowners, contractors, engineers, and anyone interested in modern plumbing solutions, this guide provides valuable insights into why trenchless pipe repair is becoming the preferred choice for pipe rehabilitation. Stay informed about the latest advancements and best practices in the field.
Overview of the fundamental roles in Hydropower generation and the components involved in wider Electrical Engineering.
This paper presents the design and construction of hydroelectric dams from the hydrologist’s survey of the valley before construction, all aspects and involved disciplines, fluid dynamics, structural engineering, generation and mains frequency regulation to the very transmission of power through the network in the United Kingdom.
Author: Robbie Edward Sayers
Collaborators and co editors: Charlie Sims and Connor Healey.
(C) 2024 Robbie E. Sayers
Courier management system project report.pdfKamal Acharya
It is now-a-days very important for the people to send or receive articles like imported furniture, electronic items, gifts, business goods and the like. People depend vastly on different transport systems which mostly use the manual way of receiving and delivering the articles. There is no way to track the articles till they are received and there is no way to let the customer know what happened in transit, once he booked some articles. In such a situation, we need a system which completely computerizes the cargo activities including time to time tracking of the articles sent. This need is fulfilled by Courier Management System software which is online software for the cargo management people that enables them to receive the goods from a source and send them to a required destination and track their status from time to time.
Democratizing Fuzzing at Scale by Abhishek Aryaabh.arya
Presented at NUS: Fuzzing and Software Security Summer School 2024
This keynote talks about the democratization of fuzzing at scale, highlighting the collaboration between open source communities, academia, and industry to advance the field of fuzzing. It delves into the history of fuzzing, the development of scalable fuzzing platforms, and the empowerment of community-driven research. The talk will further discuss recent advancements leveraging AI/ML and offer insights into the future evolution of the fuzzing landscape.
Hybrid optimization of pumped hydro system and solar- Engr. Abdul-Azeez.pdffxintegritypublishin
Advancements in technology unveil a myriad of electrical and electronic breakthroughs geared towards efficiently harnessing limited resources to meet human energy demands. The optimization of hybrid solar PV panels and pumped hydro energy supply systems plays a pivotal role in utilizing natural resources effectively. This initiative not only benefits humanity but also fosters environmental sustainability. The study investigated the design optimization of these hybrid systems, focusing on understanding solar radiation patterns, identifying geographical influences on solar radiation, formulating a mathematical model for system optimization, and determining the optimal configuration of PV panels and pumped hydro storage. Through a comparative analysis approach and eight weeks of data collection, the study addressed key research questions related to solar radiation patterns and optimal system design. The findings highlighted regions with heightened solar radiation levels, showcasing substantial potential for power generation and emphasizing the system's efficiency. Optimizing system design significantly boosted power generation, promoted renewable energy utilization, and enhanced energy storage capacity. The study underscored the benefits of optimizing hybrid solar PV panels and pumped hydro energy supply systems for sustainable energy usage. Optimizing the design of solar PV panels and pumped hydro energy supply systems as examined across diverse climatic conditions in a developing country, not only enhances power generation but also improves the integration of renewable energy sources and boosts energy storage capacities, particularly beneficial for less economically prosperous regions. Additionally, the study provides valuable insights for advancing energy research in economically viable areas. Recommendations included conducting site-specific assessments, utilizing advanced modeling tools, implementing regular maintenance protocols, and enhancing communication among system components.
Vaccine management system project report documentation..pdfKamal Acharya
The Division of Vaccine and Immunization is facing increasing difficulty monitoring vaccines and other commodities distribution once they have been distributed from the national stores. With the introduction of new vaccines, more challenges have been anticipated with this additions posing serious threat to the already over strained vaccine supply chain system in Kenya.
TECHNICAL TRAINING MANUAL GENERAL FAMILIARIZATION COURSEDuvanRamosGarzon1
AIRCRAFT GENERAL
The Single Aisle is the most advanced family aircraft in service today, with fly-by-wire flight controls.
The A318, A319, A320 and A321 are twin-engine subsonic medium range aircraft.
The family offers a choice of engines
NO1 Uk best vashikaran specialist in delhi vashikaran baba near me online vas...Amil Baba Dawood bangali
Contact with Dawood Bhai Just call on +92322-6382012 and we'll help you. We'll solve all your problems within 12 to 24 hours and with 101% guarantee and with astrology systematic. If you want to take any personal or professional advice then also you can call us on +92322-6382012 , ONLINE LOVE PROBLEM & Other all types of Daily Life Problem's.Then CALL or WHATSAPP us on +92322-6382012 and Get all these problems solutions here by Amil Baba DAWOOD BANGALI
#vashikaranspecialist #astrologer #palmistry #amliyaat #taweez #manpasandshadi #horoscope #spiritual #lovelife #lovespell #marriagespell#aamilbabainpakistan #amilbabainkarachi #powerfullblackmagicspell #kalajadumantarspecialist #realamilbaba #AmilbabainPakistan #astrologerincanada #astrologerindubai #lovespellsmaster #kalajaduspecialist #lovespellsthatwork #aamilbabainlahore#blackmagicformarriage #aamilbaba #kalajadu #kalailam #taweez #wazifaexpert #jadumantar #vashikaranspecialist #astrologer #palmistry #amliyaat #taweez #manpasandshadi #horoscope #spiritual #lovelife #lovespell #marriagespell#aamilbabainpakistan #amilbabainkarachi #powerfullblackmagicspell #kalajadumantarspecialist #realamilbaba #AmilbabainPakistan #astrologerincanada #astrologerindubai #lovespellsmaster #kalajaduspecialist #lovespellsthatwork #aamilbabainlahore #blackmagicforlove #blackmagicformarriage #aamilbaba #kalajadu #kalailam #taweez #wazifaexpert #jadumantar #vashikaranspecialist #astrologer #palmistry #amliyaat #taweez #manpasandshadi #horoscope #spiritual #lovelife #lovespell #marriagespell#aamilbabainpakistan #amilbabainkarachi #powerfullblackmagicspell #kalajadumantarspecialist #realamilbaba #AmilbabainPakistan #astrologerincanada #astrologerindubai #lovespellsmaster #kalajaduspecialist #lovespellsthatwork #aamilbabainlahore #Amilbabainuk #amilbabainspain #amilbabaindubai #Amilbabainnorway #amilbabainkrachi #amilbabainlahore #amilbabaingujranwalan #amilbabainislamabad
About
Indigenized remote control interface card suitable for MAFI system CCR equipment. Compatible for IDM8000 CCR. Backplane mounted serial and TCP/Ethernet communication module for CCR remote access. IDM 8000 CCR remote control on serial and TCP protocol.
• Remote control: Parallel or serial interface.
• Compatible with MAFI CCR system.
• Compatible with IDM8000 CCR.
• Compatible with Backplane mount serial communication.
• Compatible with commercial and Defence aviation CCR system.
• Remote control system for accessing CCR and allied system over serial or TCP.
• Indigenized local Support/presence in India.
• Easy in configuration using DIP switches.
Technical Specifications
Indigenized remote control interface card suitable for MAFI system CCR equipment. Compatible for IDM8000 CCR. Backplane mounted serial and TCP/Ethernet communication module for CCR remote access. IDM 8000 CCR remote control on serial and TCP protocol.
Key Features
Indigenized remote control interface card suitable for MAFI system CCR equipment. Compatible for IDM8000 CCR. Backplane mounted serial and TCP/Ethernet communication module for CCR remote access. IDM 8000 CCR remote control on serial and TCP protocol.
• Remote control: Parallel or serial interface
• Compatible with MAFI CCR system
• Copatiable with IDM8000 CCR
• Compatible with Backplane mount serial communication.
• Compatible with commercial and Defence aviation CCR system.
• Remote control system for accessing CCR and allied system over serial or TCP.
• Indigenized local Support/presence in India.
Application
• Remote control: Parallel or serial interface.
• Compatible with MAFI CCR system.
• Compatible with IDM8000 CCR.
• Compatible with Backplane mount serial communication.
• Compatible with commercial and Defence aviation CCR system.
• Remote control system for accessing CCR and allied system over serial or TCP.
• Indigenized local Support/presence in India.
• Easy in configuration using DIP switches.
Automobile Management System Project Report.pdfKamal Acharya
The proposed project is developed to manage the automobile in the automobile dealer company. The main module in this project is login, automobile management, customer management, sales, complaints and reports. The first module is the login. The automobile showroom owner should login to the project for usage. The username and password are verified and if it is correct, next form opens. If the username and password are not correct, it shows the error message.
When a customer search for a automobile, if the automobile is available, they will be taken to a page that shows the details of the automobile including automobile name, automobile ID, quantity, price etc. “Automobile Management System” is useful for maintaining automobiles, customers effectively and hence helps for establishing good relation between customer and automobile organization. It contains various customized modules for effectively maintaining automobiles and stock information accurately and safely.
When the automobile is sold to the customer, stock will be reduced automatically. When a new purchase is made, stock will be increased automatically. While selecting automobiles for sale, the proposed software will automatically check for total number of available stock of that particular item, if the total stock of that particular item is less than 5, software will notify the user to purchase the particular item.
Also when the user tries to sale items which are not in stock, the system will prompt the user that the stock is not enough. Customers of this system can search for a automobile; can purchase a automobile easily by selecting fast. On the other hand the stock of automobiles can be maintained perfectly by the automobile shop manager overcoming the drawbacks of existing system.
Cosmetic shop management system project report.pdfKamal Acharya
Buying new cosmetic products is difficult. It can even be scary for those who have sensitive skin and are prone to skin trouble. The information needed to alleviate this problem is on the back of each product, but it's thought to interpret those ingredient lists unless you have a background in chemistry.
Instead of buying and hoping for the best, we can use data science to help us predict which products may be good fits for us. It includes various function programs to do the above mentioned tasks.
Data file handling has been effectively used in the program.
The automated cosmetic shop management system should deal with the automation of general workflow and administration process of the shop. The main processes of the system focus on customer's request where the system is able to search the most appropriate products and deliver it to the customers. It should help the employees to quickly identify the list of cosmetic product that have reached the minimum quantity and also keep a track of expired date for each cosmetic product. It should help the employees to find the rack number in which the product is placed.It is also Faster and more efficient way.
Cosmetic shop management system project report.pdf
Electrical distribution system planning
1. Future Nature of Distribution Planning
Central Role of the Computer in Distribution Planning
Load characteristics.
ELECRTICAL DISTRIBUTION SYSTEMS
IV B.TECH II SEMESTER EEE
S K B PRADEEPKUMAR CH
ASSISTANT PROFESSOR
EEE
2. Future Nature of Distribution Planning
Increasing Importance of Good Planning
Impacts of Load Management (or Demand-Side Management)
Cost/Benefit Ratio for Innovation
New Planning Tools
3. Predictions about the future methods for distribution planning must necessarily be
extrapolations of present methods. Basic algorithms for network analysis have been known
for years and are not likely to be improved upon in the near future. However, the
superstructure that supports these algorithms and the problem-solving environment used by
the system designer is expected to change significantly to take advantage of new methods
that technology has made possible. Before giving a detailed discussion of these expected
changes, the changing role of distribution planning needs to be examined
Future Nature of Distribution Planning
4. For the economic reasons listed earlier, distribution systems will become more expensive to
build, expand, and modify. Thus, it is particularly important that each distribution system
design be as cost effective as possible. This means that the system must be optimal from many
points of view over the time period from the 1st day of operation to the planning-time horizon.
In addition to the accurate load growth estimates, components must be phased in and out of the
system so as to minimize capital expenditure, meet performance goals, and minimize losses.
These requirements need to be met at a time when demographic trends are veering away from
what have been their norms for many years in the past and when distribution systems are
becoming more complex in design due to the appearance of more active components (e.g., fuel
cells) instead of the conventional passive ones.
Increasing Importance of Good Planning
5. In the past, the power utility companies of this nation supplied electric energy to meet all
customer demands when demands occurred. Recently, however, because of the financial
constraints (i.e., high cost of labor, materials, and interest rates), environmental concerns,
and the recent shortage (or high cost) of fuels, this basic philosophy has been reexamined
and customer load management investigated as an alternative to capacity expansion. Load
management’s benefits are system wide. Alteration of the electric energy use patterns will
not only affect the demands on system generating equipment but also alter the loading of
distribution equipment. The load management (or demand-side management) may be used
to reduce or balance loads on marginal substations and circuits, thus even extending their
lives. Therefore, in the future, the implementation of load management policies may
drastically affect the distribution of load, in
Impacts of Load Management (or Demand-Side Management)
6. time and in location, on the distribution system, sub transmission system, and the bulk power
system. Since distribution systems have been designed to interface with controlled load
patterns, the systems of the future will necessarily be designed somewhat differently to benefit
from the altered conditions. However, the benefits of load management (or demand-side
management) cannot be fully realized unless the system planners have the tools required to
adequately plan incorporation into the evolving electric energy system. The evolution of the
system in response to changing requirements and under changing constraints is a process
involving considerable uncertainty.
7. 1. It must be able to reduce demand during critical system load periods.
2. It must result in a reduction in new generation requirements, purchased power, and/or fuel
costs.
3. It must have an acceptable cost/benefit ratio.
4. Its operation must be compatible with system design and operation.
5. It must operate at an acceptable reliability level.
6. It must have an acceptable level of customer convenience.
7. It must provide a benefit to the customer in the form of reduced rates or other incentives.
The requirements of a successful load management program are specified by
Delgado as follows:
8. In the utility industry, the most powerful force shaping the future is that of economics.
Therefore, any new innovations are not likely to be adopted for their own sake but will be
adopted only if they reduce the cost of some activity or provide something of economic value,
which previously had been unavailable for comparable costs. In predicting that certain
practices or tools will replace current ones, it is necessary that one judge their acceptance on
this basis. The expected innovations that satisfy these criteria are planning tools implemented
on a digital computer that deals with distribution systems in network terms. One might be
tempted to conclude that these planning tools would be adequate for industry use throughout
the 1980s. That this is not likely to be the case may be seen by considering the trends judged to
be dominant during this period with those that held sway over the period in which the tools
were developed.
Cost/Benefit Ratio for Innovation
9. Tools to be considered fall into two categories: network design tools and network analysis
tools. The analysis tools may become more efficient but are not expected to undergo any major
changes, although the environment in which they are used will change significantly. This
environment will be discussed in the next section. The design tools, however, are expected to
show the greatest development since better planning could have a significant impact on the
utility industry.
New Planning Tools
10. The results of this development will show the following characteristics:
1. Network design will be optimized with respect to many criteria by using programming
methods of operations research.
2. Network design will be only one facet of distribution system management directed by
human engineers using a computer system designed for such management functions.
3. So-called network editors will be available for designing trial networks; these designs in
digital form will be passed to extensive simulation programs, which will determine if the
proposed network satisfies performance and load growth criteria.
11. Central Role of the Computer in Distribution Planning
System Approach
Database Concept
New Automated Tools
12. Central Role of the Computer in Distribution Planning
As is well known, distribution system planners have used computers for many years to
perform the tedious calculations necessary for system analysis. However, it has only been
in the past few years that technology has provided the means for planners to truly take a
system approach to the total design and analysis. It is the central thesis of this book that
the development of such an approach will occupy planners in the future and will
significantly contribute to their meeting the challenges previously discussed.
13. System Approach
A collection of computer programs to solve the analysis problems of a designer necessarily
constitutes neither an efficient problem-solving system nor such a collection even when the
output of one can be used as the input of another. The system approach to the design of a
useful tool for the designer begins by examining the types of information required and its
sources. The view taken is that this information generates decisions and additional
information that pass from one stage of the design process to another. At certain points, it is
noted that the human engineer must evaluate the information generated and add his or her
input. Finally, the results must be displayed for use and stored for later reference. With this
conception of the planning process, the system approach seeks to automate as much of the
process as possible, ensuring in the process that the various transformations of information
are made as efficiently as possible. One representation of this information flow is shown in
Figure 1.10, where the outer circle represents the interface between the engineer and the
system.
14. Analysis programs forming part of the system are supported by a database management
system (DBMS) that stores, retrieves, and modifies various data on distribution systems.
Database Concept
As suggested in Figure 1.10, the database plays a central role in the operation of such a
system. It is in this area that technology has made some significant strides in the past 5
years so that not only is it possible to store vast quantities of data economically, but it is
also possible to retrieve desired data with access times on the order of seconds. The DBMS
provides the interface between the process that requires access to the data and the data
themselves. The particular organization that is likely to emerge as the dominant one in the
near future is based on the idea of a relation. Operations on the database are performed by
the DBMS.
15.
16. In addition to the database management program and the network analysis programs, it is
expected that some new tools will emerge to assist the designer in arriving at the optimal
design. One such new tool that has appeared in the literature is known as a network editor.
The network consists of a graph whose vertices are network components, such as transformers
and loads, and edges that represent connections among the components. The features of the
network editor may include network objects, for example, feeder line sections, secondary line
sections, distribution transformers, or variable or fixed capacitors, control mechanisms, and
command functions. A primitive network object comprises a name, an object class
description, and a connection list. The control mechanisms may provide the planner with
natural tools for correct network construction and modification.
New Automated Tools
17. LOAD CHARACTERISTICS
Demand: “The demand of an installation or system is the load at the receiving terminals
averaged over a specified interval of time”. Here, the load may be given in kilowatts,
kilovars, kilovoltamperes, kiloamperes, or amperes.
Demand interval: It is the period over which the load is averaged. This selected Δt period
may be 15 min, 30 min, 1 h, or even longer. Of course, there may be situations where the 15
and 30 min demands are identical
Maximum demand: “The maximum demand of an installation or system is the greatest of
all demands which have occurred during the specified period of time”. The maximum
demand statement should also express the demand interval used to measure it. For example,
the specific demand might be the maximum of all demands such as daily, weekly, monthly,
or annual.
18. )is
Diversified demand (or coincident demand): It is the demand of the composite group,
as a whole, of somewhat unrelated loads over a specified period of time. Here, the
maximum diversified demand has an importance. It is the maximum sum of the
contributions of the individual demands to the diversified demand over a specific time
interval.
Utilization factor: It is “the ratio of the maximum demand of a system to the rated
capacity of the system”. Therefore, the utilization factor (Fu) is
Load: electrical power needed in KW or KVA
19. Plant factor: It is the ratio of the total actual energy produced or served over a designated
period of time to the energy that would have been produced or served if the plant (or unit)
had operated continuously at maximum rating. It is also known as the capacity factor or the
use factor.
20. Load factor: It is “the ratio of the average load over a designated period of time to the peak
load occurring on that period”. Therefore, the load factor Fld is average load
21. Diversity factor: It is “the ratio of the sum of the individual maximum demands of the
various subdivisions of a system to the maximum demand of the whole system”.
Therefore, the diversity factor (FD) is
is the maximum demand of load i, disregarding time of occurrence
where
coincident maximum demand of group of loads
22. Coincidence factor: It is “the ratio of the maximum coincident total demand of a group of
consumers to the sum of the maximum power demands of individual consumers comprising
the group both taken at the same point of supply for the same time”. Therefore, the
coincidence factor (Fc) is
23. Load diversity: It is “the difference between the sum of the peaks of two or more
individual loads and the peak of the combined load”. Therefore, the load diversity (LD)
is
Contribution factor: Manning defines ci as “the contribution factor of the ith load to the
group maximum demand.” It is given in per unit of the individual maximum demand of the
ith load. Therefore,
24. Coincidence factor is
That is, the coincidence factor is equal to the contribution factor.
Loss factor: It is “the ratio of the average power loss to the peak-load power loss during a
specified period of time”. Therefore, the loss factor (FLS) is
Note: is applicable for the copper losses of the system but not for the iron losses.
25. Load Curve
Definition: Load curve or chronological curve is the graphical representation of load
(in kW or MW) in proper time sequence and the time in hours. It shows the variation of
load on the power station. When the load curve is plotted for 24 hours a day, then it is
called daily load curve. If the one year is considered then, it is called annual load curve.
The load curve of the power system is not same all the day. It differs from day to day
and season to season. The load curve is mainly classified into two types, i.e., the
summer load curve and the winter load curve.
26. Information Obtained From Load Curve
The following are the information obtained from load curves.
•Load duration curve determines the load variation during different hours of the day.
•It indicates the peak load which determines the maximum demand on the power station.
•The area under the load curve gives the total energy generated in the period under
consideration.
•The area under the curve divided by the total numbers of hours gives the load.
•The ratio of the area under the load curve of the total area of the rectangle in which it is
contained gives the load factor.
•The ideal load curve is flat, but practically it is far from flat. For a flat load curve, the load
factor will be higher. Higher load factor means the more uniform load pattern with fewer
variations in load.
27.
28. Utility of Load Curve
The following are the utility of the load curve.
•Load curve decides the installed capacity of a power station.
• It is helpful in choosing the most economical sizes of the various generating units.
•The load curve estimates the generating cost.
•It decides the operating schedules of the power station, i.e., the sequence in which the
different generating units should run.
29. Definition: The load duration curve is defined as the curve between the load and time in
which the ordinates representing the load, plotted in the order of decreasing magnitude,
i.e., with the greatest load at the left, lesser loads towards the rights and the lowest loads
at the time extreme right. The load duration curve is shown in the figure below.
Load Duration Curve
30. This curve represents the same data as that of the load curve. The load duration curve is
constructed by selecting the maximum peak points and connecting them by a curve. The
load duration curve plotting for 24 hours of a day is called the daily load duration curve.
Similarly, the load duration curve plotted for a year is called the annual load curve.
31. Procedure for Plotting the Load Duration Curve
•From the data available from the load curve determines the maximum load and the
duration for which it occurs.
•Now take the next load and the total time during which this and the previous load
occurs.
•Plots the loads against the time during which it occurs.
•The load duration curves can be drawn for any duration of time, for example, a day or a
month or a year. The whole duration is taken as 100%.
Ex: Consider the daily load curve data of the power system
32. Time Load in MW
6.00 am to 8.00am 8
8.00 am to 1.00 noon 20
1.00 noon to 2.00
noon
5
2.00noon to 6.00 pm 30
6.00 pm to 6.00 am 8
Load in MW
Hours in a
day
Time in
percentage
30 4 4/5×100=16.
67%
20 4+5 9/24×100=3
7.5%
8 2+4+5+12
=23
23/24×100=
95.83%
5 4+5+2+12+1
= 24
24/24×100=
100%
33. information Available Form Load Duration Curve
The load duration curve gives the minimum load present throughout the specified
period.
It authorises the selection of base load and peak load power plants.
Any point on the load duration curve represents the total duration in hours for the
corresponding load and all loads of greater values.
The area under the load duration curve represents the energy associated with the
load duration curve.
The average demand during some specified time periods such as a day or a month
can be obtained from the load duration curve.