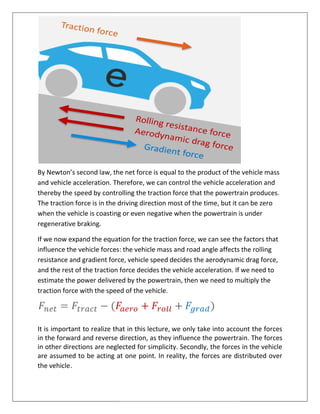
Project Report
Electric Vehicles
Sant Longowal Institute of Engineering
and Technology
2020
Ashwini Kumar
GEE/1740705
History of Electric Vehicle
It’s hard to pinpoint the invention of the electric car to one inventor or country.
Instead it was a series of breakthroughs -- from the battery to the electric motor -
- in the 1800s that led to the first electric vehicle on the road.
In the early part of the century, innovators in Hungary, the Netherlands and the
United States -- including a blacksmith from Vermont -- began toying with the
concept of a battery-powered vehicle and created some of the first small-scale
electric cars. And while Robert Anderson, a British inventor, developed the first
crude electric carriage around this same time, it wasn’t until the second half of
the 19th century that French and English inventors built some of the first practical
electric cars.
In the U.S., the first successful electric car made its debut around 1890 thanks to
William Morrison, a chemist who lived in Des Moines, Iowa. His six-passenger
vehicle capable of a top speed of 14 miles per hour was little more than an
electrified wagon, but it helped spark interest in electric vehicles.
Over the next few years, electric vehicles from different automakers began
popping up across the U.S. New York City even had a fleet of more than 60
electric taxis. By 1900, electric cars were at their heyday, accounting for around a
third of all vehicles on the road. During the next 10 years, they continued to show
strong sales.
Types of Electric Vehicles
Hybrid Electric Vehicles (HEVs):- HEVs are powered by both petrol and
electricity. The electric energy is generated by the car’s own braking system to
recharge the battery. This is called ‘regenerative braking’, a process where the
electric motor helps to slow the vehicle and uses some of the energy normally
converted to heat by the brakes.
Plug-in Hybrid Electric Vehicles (PHEVs):-HEVs start off using the electric
motor, then the petrol engine cuts in as load or speed rises. The two motors are
controlled by an internal computer which ensures the best economy for the
driving conditions. The Honda Civic Hybrid and Toyota Camry Hybrid are both
examples of HEVs. PHEVs have an electric motor range of between 50
before the petrol engine kicks in. Due to the added weight and complexity, the
electric motor range of a PHEV will generally be less than a BEV
Battery Electric Vehicles (BEVs):
with high-capacity battery packs. T
motor and all onboard electronics. BEVs do not emit any harmful emissions and
hazards caused by traditional gasoline
electricity from an external source. Electric Vehicl
according to the speed with which they recharge an EVs battery.
BEV is currently around 100
per day, the BEV can be a good option.
better as newer models hit the market. The next
to handle 300km on a single charge and the latest Tesla Model S has a range of
500km.
Sizing of the EV power train
Rolling resistance force
The rolling resistance force occurs due to the friction between the tires and the
driving surface. The rolling resistance force is zero at standstill.
starts moving, the rolling resistance force acts in the direction opposite to the
direction of motion and can be calculated by the rolling resistance
coefficient Cr multiplied by the normal force between the vehicle and the road.
For a flat surface, the normal force is the vehicle mass
gravity g.
In the case of a road with an inclination angle, the
weight m.g multiplied by the cosine of the road angle.
the rolling resistance force is independent of the vehicle speed, and it is always
opposite the driving direction.
frictional losses low. For modern cars, it’s typically around 0.01 to 0.02.
have an electric motor range of between 50
petrol engine kicks in. Due to the added weight and complexity, the
electric motor range of a PHEV will generally be less than a BEV
Battery Electric Vehicles (BEVs):- Battery electric vehicles store electricity onboard
capacity battery packs. Their battery power is used to run the electric
motor and all onboard electronics. BEVs do not emit any harmful emissions and
hazards caused by traditional gasoline – powered vehicles .BEVs are charged by
electricity from an external source. Electric Vehicle (EV) chargers are classified
according to the speed with which they recharge an EVs battery. The range of a
BEV is currently around 100-150km, and as most motorists drive around 35
a good option. The ranges of BEVs are getting better and
better as newer models hit the market. The next-gen Nissan Leaf should be able
to handle 300km on a single charge and the latest Tesla Model S has a range of
Sizing of the EV power train:-
Rolling resistance force
stance force occurs due to the friction between the tires and the
driving surface. The rolling resistance force is zero at standstill. When the vehicle
starts moving, the rolling resistance force acts in the direction opposite to the
d can be calculated by the rolling resistance
multiplied by the normal force between the vehicle and the road.
For a flat surface, the normal force is the vehicle mass m times the standard
In the case of a road with an inclination angle, the normal force becomes the
multiplied by the cosine of the road angle. It is important to note that
the rolling resistance force is independent of the vehicle speed, and it is always
e driving direction. The coefficient Cr should be low so as to keep the
frictional losses low. For modern cars, it’s typically around 0.01 to 0.02.
have an electric motor range of between 50-100km
petrol engine kicks in. Due to the added weight and complexity, the
Battery electric vehicles store electricity onboard
heir battery power is used to run the electric
motor and all onboard electronics. BEVs do not emit any harmful emissions and
powered vehicles .BEVs are charged by
e (EV) chargers are classified
The range of a
150km, and as most motorists drive around 35-70km
getting better and
gen Nissan Leaf should be able
to handle 300km on a single charge and the latest Tesla Model S has a range of
stance force occurs due to the friction between the tires and the
When the vehicle
starts moving, the rolling resistance force acts in the direction opposite to the
multiplied by the normal force between the vehicle and the road.
times the standard
force becomes the
It is important to note that
the rolling resistance force is independent of the vehicle speed, and it is always
should be low so as to keep the
frictional losses low. For modern cars, it’s typically around 0.01 to 0.02.
Aerodynamic drag force
As the vehicle speed increase,
motion as the air as is forced to flow around the moving vehicle.
calculated as the product of the aerodynamic drag coefficient
the vehicle Af, the air density
It is hence important to note that the aerodynamic drag in independent of vehicle
mass but has a strong dependence on the vehicle speed. That is why in a car, the
aerodynamic drag force is higher than the
is above about 70 to 80 km/h.
Secondly, the coefficient of drag is typically about 0.25 to 0.35 for a modern car.
SUVs, with their typically boxy shapes, have coefficients in the range of 0.35 to
0.45.
Gradient force
The third force that acts on a vehicle
vehicle is driving on an uphill
longitudinal component of gravitational force, namely
the inclination angle of the road. As seen earlier, the cosine c
gravity contributes to the normal force and the corresponding rolling resistance
force.
The gradient force and the angle
positive when driving uphill.
terms of tangent theta and have a value typically between plus or minus 10%.
If we now consider a vehicle moving on an inclined surface, then the aerodynamic
drag force, the rolling resistance force and the gradient force act on the vehicle. If
we now include the traction force provided by the vehicle powertrain, then the
net force on the vehicle, is the difference between the traction force and the sum
of the forces due to the aerodynamic drag, the rolling resistance, and the road
gradient.
force
As the vehicle speed increase, the aerodynamic drag force opposes the vehicle
motion as the air as is forced to flow around the moving vehicle. It can be
calculated as the product of the aerodynamic drag coefficient Cd the front area of
Af, the air density and the square of the vehicle speed v, divided by 2.
e important to note that the aerodynamic drag in independent of vehicle
mass but has a strong dependence on the vehicle speed. That is why in a car, the
aerodynamic drag force is higher than the rolling resistance force when the speed
80 km/h.
Secondly, the coefficient of drag is typically about 0.25 to 0.35 for a modern car.
SUVs, with their typically boxy shapes, have coefficients in the range of 0.35 to
The third force that acts on a vehicle is the gradient force, and it occurs when the
an uphill or a downhill road. The gradient force is due to the
longitudinal component of gravitational force, namely mgsin(theta)
the inclination angle of the road. As seen earlier, the cosine component of the
contributes to the normal force and the corresponding rolling resistance
The gradient force and the angle theta are negative when driving downhill,
positive when driving uphill. Road gradients are expressed as a percentag
and have a value typically between plus or minus 10%.
If we now consider a vehicle moving on an inclined surface, then the aerodynamic
drag force, the rolling resistance force and the gradient force act on the vehicle. If
w include the traction force provided by the vehicle powertrain, then the
net force on the vehicle, is the difference between the traction force and the sum
of the forces due to the aerodynamic drag, the rolling resistance, and the road
the aerodynamic drag force opposes the vehicle
It can be
the front area of
v, divided by 2.
e important to note that the aerodynamic drag in independent of vehicle
mass but has a strong dependence on the vehicle speed. That is why in a car, the
resistance force when the speed
Secondly, the coefficient of drag is typically about 0.25 to 0.35 for a modern car.
SUVs, with their typically boxy shapes, have coefficients in the range of 0.35 to
occurs when the
The gradient force is due to the
where theta is
omponent of the
contributes to the normal force and the corresponding rolling resistance
downhill, and
Road gradients are expressed as a percentage in
and have a value typically between plus or minus 10%.
If we now consider a vehicle moving on an inclined surface, then the aerodynamic
drag force, the rolling resistance force and the gradient force act on the vehicle. If
w include the traction force provided by the vehicle powertrain, then the
net force on the vehicle, is the difference between the traction force and the sum
of the forces due to the aerodynamic drag, the rolling resistance, and the road
By Newton’s second law, the net force is equal to the product of the vehicle mass
and vehicle acceleration. Therefore, we can control the vehicle acceleration and
thereby the speed by controlling the traction force that the powertrain produces.
The traction force is in the driving direction most of the time, but it can be zero
when the vehicle is coasting or even
regenerative braking.
If we now expand the equation for the traction force, we can see
influence the vehicle forces: the vehicle mass and road angle affects the rolling
resistance and gradient force, vehicle speed decides the aerodynamic drag force,
and the rest of the traction force decides the vehicle acceleration. If we need to
estimate the power delivered by the powertrain, then we need to multiply the
traction force with the speed
It is important to realize that in this
in the forward and reverse direction, as they influence the
in other directions are neglected for simplicity. Secondly, the forces in the vehicle
are assumed to be acting at one point. In reality, the forces are distributed over
the vehicle.
on’s second law, the net force is equal to the product of the vehicle mass
Therefore, we can control the vehicle acceleration and
thereby the speed by controlling the traction force that the powertrain produces.
is in the driving direction most of the time, but it can be zero
when the vehicle is coasting or even negative when the powertrain is under
If we now expand the equation for the traction force, we can see the factors that
he vehicle forces: the vehicle mass and road angle affects the rolling
resistance and gradient force, vehicle speed decides the aerodynamic drag force,
and the rest of the traction force decides the vehicle acceleration. If we need to
livered by the powertrain, then we need to multiply the
speed of the vehicle.
It is important to realize that in this lecture, we only take into account the forces
in the forward and reverse direction, as they influence the powertrain. The forces
in other directions are neglected for simplicity. Secondly, the forces in the vehicle
are assumed to be acting at one point. In reality, the forces are distributed over
on’s second law, the net force is equal to the product of the vehicle mass
Therefore, we can control the vehicle acceleration and
thereby the speed by controlling the traction force that the powertrain produces.
is in the driving direction most of the time, but it can be zero
when the powertrain is under
the factors that
he vehicle forces: the vehicle mass and road angle affects the rolling
resistance and gradient force, vehicle speed decides the aerodynamic drag force,
and the rest of the traction force decides the vehicle acceleration. If we need to
livered by the powertrain, then we need to multiply the
we only take into account the forces
powertrain. The forces
in other directions are neglected for simplicity. Secondly, the forces in the vehicle
are assumed to be acting at one point. In reality, the forces are distributed over
Let us now look at a force/speed diagram of a
frontal area of 2.5m^2 and the speed range of 0
the traction force, we can calculate the force at each speed level for zero vehicle
acceleration. Those points make
is close to zero, then the traction force is used to overcome the rolling resistance
force. As the speed increase, the traction force needed increases fast, as the
aerodynamic force increase with the square of the speed.
Next, let us investigate 3 road conditions, a flat road, a 5% gradient uphill, and a
5% gradient downhill. We can see in the downhill condition, the traction force
needed for low speeds is negative, as the gradient force is larger than combined
rolling resistance and aerodynamic drag forces. On the other hand, the uphill
gradient requires a significantly higher traction force for the same speed than the
0% or downhill gradient.
Let us now look at a force/speed diagram of a vehicle with a mass of 1.5 ton,
frontal area of 2.5m^2 and the speed range of 0-200 km/h. From the formula for
the traction force, we can calculate the force at each speed level for zero vehicle
make a force/speed curve of this car. When the speed
is close to zero, then the traction force is used to overcome the rolling resistance
force. As the speed increase, the traction force needed increases fast, as the
aerodynamic force increase with the square of the speed.
estigate 3 road conditions, a flat road, a 5% gradient uphill, and a
We can see in the downhill condition, the traction force
needed for low speeds is negative, as the gradient force is larger than combined
dynamic drag forces. On the other hand, the uphill
gradient requires a significantly higher traction force for the same speed than the
vehicle with a mass of 1.5 ton,
From the formula for
the traction force, we can calculate the force at each speed level for zero vehicle
ar. When the speed
is close to zero, then the traction force is used to overcome the rolling resistance
force. As the speed increase, the traction force needed increases fast, as the
estigate 3 road conditions, a flat road, a 5% gradient uphill, and a
We can see in the downhill condition, the traction force
needed for low speeds is negative, as the gradient force is larger than combined
dynamic drag forces. On the other hand, the uphill
gradient requires a significantly higher traction force for the same speed than the
Finally, let’s consider the case when the vehicle has a finite acceleration. This is
the speed/force curve for the same car with 0% gradient and zero acceleration.
Since the mass of the car is 1500kg, for every 1m/s2 acceleration, an extra 1500N
traction force from the powertrain would be required.
Besides the traction force, the EV battery
auxiliaries, like heating, air conditioning, lighting, wiper etc. Hence, the net power
delivered by the traction battery,
auxiliary power.
To conclude, the forces acting on
resistance force, the aerodynamic drag force and the gradient force. The drive
train provides the traction force, which can be controlled to change the vehicle
acceleration and hence the speed.
Finally, let’s consider the case when the vehicle has a finite acceleration. This is
eed/force curve for the same car with 0% gradient and zero acceleration.
Since the mass of the car is 1500kg, for every 1m/s2 acceleration, an extra 1500N
traction force from the powertrain would be required.
Besides the traction force, the EV battery also provides power for the vehicle
auxiliaries, like heating, air conditioning, lighting, wiper etc. Hence, the net power
delivered by the traction battery, Pbatt is the sum of the traction power
To conclude, the forces acting on a vehicle when it’s driving consist of the rolling
resistance force, the aerodynamic drag force and the gradient force. The drive
train provides the traction force, which can be controlled to change the vehicle
acceleration and hence the speed.
Finally, let’s consider the case when the vehicle has a finite acceleration. This is
eed/force curve for the same car with 0% gradient and zero acceleration.
Since the mass of the car is 1500kg, for every 1m/s2 acceleration, an extra 1500N
also provides power for the vehicle
auxiliaries, like heating, air conditioning, lighting, wiper etc. Hence, the net power
power and the
a vehicle when it’s driving consist of the rolling
resistance force, the aerodynamic drag force and the gradient force. The drive
train provides the traction force, which can be controlled to change the vehicle
Motor used in Electric Vehicles
Induction Motor :- The AC induction motor needs no permanent magnets.
Instead the magnetic field is produced by a current that flows through the
windings in the housing or stator. Now if you connect the stator to an alternating
current, this means the magnetic field in the stator will also alternate. If a three
phase AC input is used, a so called rotating magnetic field or RMF is produced.
The magnetic field from the stator will induce a voltage and current in the
windings of the rotor. That’s why it’s called the induction motor. This in turn leads
to the rotor producing its own magnetic field, and this magnetic field will make
the rotor turn so as to align itself with the magnetic field from the stator. The
rotor will follow this rotating magnetic field in the stator, without the need for a
commutator with brushes.
Permanent Magnet Motor :- If we construct a rotor with permanent magnets,
we no longer need to induce a magnetic field in the rotor. This avoids losses and
heat development in the rotor. Because of all this, permanent magnet motors are
currently the smallest and lightest electric motors you can buy. Because the rotor
is already magnetized it is always in sync with the rotating magnetic field. That’s
why permanent magnet motors are also classified as synchronous motors.
Synchronous reluctance motor :-The synchronous reluctance
motor has only recently been developed and seems to have best of both worlds.
It has a rotor that contains metal that is formed in such a way that it wants to
align itself naturally to the surrounding magnetic field. This means it doesn’t need
to produce its own electric field through induced currents, like the induction
motor, which means less losses. Finally, it doesn’t need permanent magnets
which makes it much cheaper than a permanent magnet motor.
Torque-speed characteristics of a motor
Configuration of motor layout
Single Motor Configuration
Double Motor Configuration
A number of motor configurations are possible for EV’s, which provides more
flexibility for the driveline layout. Single motor configurations use one motor that
drives either the front or rear axles.
With a dual motor configuration, two motors are used to drive the EV and this can
be done in different ways. One possibility is that one motor can power the front
axle and the other the rear axle. Second, both the motors can be placed on either
the front or rear axle to provide increased torque compared to the single motor
configuration. Alternately, the two motors can be used to drive the left and right
wheel independently on either the front or rear axle, meaning there is more
control over the vehicle when cornering/turning. Although, most EV
manufacturers currently adopt the single motor configuration, the dual motor
configuration has also been used for vehicle models with higher torque capability.
In-wheel motor configuration
Using a separate motor to drive each of the four wheels independently is another
possibility. This can be achieved using an in-wheel where the motor that is placed
within the wheel of the car. The in-wheel motors can be either geared or gearless,
as represented in the figure. The gearless option has the potential to improve the
overall efficiency of the driveline, but additional controller complexity and
hardware required make such a system more complex.
Isolation between EV battery and grid
Lead acid batteries :- This is a mature technology where limited progress has
been made in terms of energy and power density. Deep cycle batteries are
available, which have re-enforced electrodes to avoid separation and sludge
formation. Prospects for use in EVs are limited, due to low energy densities,
sensitivity to temperature and life cycle.
Nickel based batteries :- Nickel-metal hydride (NiMH) batteries are used
extensively for traction purposes, and are optimized for high energy content.
Nickel-cadmium (NiCd) batteries also show good potential for high specific energy
and specific power, although the presence of cadmium has raised some
environmental concerns.
High temperature batteries
Sodium-nickel chloride (NaNiCl or Zebra) batteries have been deployed in
numerous EV applications to date4. The high specific energy is attractive for long
range EVs. The high operating temperature (300°C) requires pre-heating before
use, which can use quite a lot of energy if parked regularly for long periods. For
this reason, this battery is considered more suitable to applications where the EV
is being used continuously (public transport and delivery vans etc.).
Metal air batteries
Aluminum-air (Al-air) and zinc-air (Zn-air) batteries both use oxygen absorbed
from the atmosphere on discharge and expel oxygen when being charged. The
energy density of these batteries is high but, lower power densities mean that
applications are limited. Al-air batteries consume the aluminum electrode, and
must be removed and replaced or reprocessed. Some applications have been
tested where fleets of EV delivery vehicles are running with Zn-air batteries,
where removable zinc cassettes can be replaced when discharged for recharged
units. The low specific power of metal air batteries may see these battery types
restricted to long distance delivery vehicles, but the advantages of regenerative
braking may be sacrificed.
Lithium based batteries
Lithium based batteries are classified by the type of active material. Two main
types exist, those with liquid (Li-ion-liquid) and those with polymer electrolyte (Li-
ion-polymer). The Li-ion-liquid type is generally preferred for EV applications.
Within the Li-ion-liquid type, there are three lithium materials, lithium cobalt, (or
lithium manganese oxides), lithium iron phosphate and lithium titanate.
Lithium manganese
Lithium manganese (LiMn2O4) offers a potentially lower cost solution. It has been
largely studied for electrical vehicle application, especially in Japan. The drawback
of this type of battery is the poor battery life due to the slight solubility of Mn.
Lithium iron phospate
Lithium iron phosphate (LiFePO4) batteries are manufactured by many companies
in the world and have gained credibility through their use in power tools. Lithium
iron phosphate cells have a much lower energy density than standard format
cells, but can be charged much faster—around twenty to thirty minutes.
Moreover, LiFePO4 has been recently considered that it features an improve
stability on overcharge which is good for safety, a very high power and has
potential for lower cost because they use iron.
Lithium titanate
Lithium titanate allows charging on the order of ten minutes and have been
shown to have an extremely long cycle life - on the order of 5000 full depth of
discharge cycles. Lithium titanate has high inherent safety because the graphite
anode of two other batteries is replaced with a titanium oxide.
Specific power limitation
The ability of a battery to deliver and accept energy at very high rates is limited by
the physical processes occurring within the battery cells. When current flows into
the battery, the reaction within the cell must occur at a corresponding rate1. This
means that the dynamics of the reaction at the electrode surface and the
transport of ions (kinetic properties) must occur at the same rate as the supplied
current. Because of the high currents associated with high power, the reaction
rate is unable to match the rate at which current is being supplied. As a result, the
capacity of the battery is reduced and joule heating occurs within the cell.
Specific energy limitation
The restricted energy content of batteries is one of the major drawbacks limiting
the successful implementation of EV technology. Considering the specific energy
of gasoline is 9.2kWh/kgcorresponding to more than 3kWh/kg useful specific
energy2, limitations of the battery powered EV become apparent. Two emerging
battery technologies addressing the specific energy limitations are lithium air (Li-
air) and lithium flour (Li-flour).
Basics of Electrical Vehicle Batteries
Voltage Rating:- Two very common rating that you can find to be marked on a
battery is its voltage rating and Ah Rating. Lead acid batteries are commonly of
12V and lithium batteries are of 3.7V. This is called the nominal voltage of a
battery. This does not mean the battery will provide 3.7V across its terminals all
the time. The value of voltage will vary based on the capacity of the battery. We
will discuss more on this later.
Ah rating or mAh rating: Next to the voltage rating another common
parameter is the Ah rating. The term Ah stands for Ampere hour. Some people
use mAh which is nothing but milli-Ampere hour, meaning 1Ah = 1000mAh. Ah
rating of a battery tells us about the capacity of the battery.
For example a 2Ah battery can give 2A for one hour, the same battery will give 1A
for 2 hours and if we take 4A from it, the battery will last only 30 minutes.
Run time = Ah Rating / Current rating
“When should I stop using battery?”
Cut-off Voltage:- The cut-off voltage is the minimum voltage of a battery below
which it should not be used. Say for a lithium cell with 3.7V its cut-off voltage will
be somewhere around 3.0V. This means that under no circumstances this battery
should be connected to load when its voltage goes below 3.0V. The value of cut-
off voltage of a battery can be found in its datasheet.
If a battery is discharged below this cut-off voltage it is called as over
discharging. This will damage the battery affecting its capacity and lifespan. Over
discharging a battery will disturb the chemistry of a battery which might lead to
smoking or fuming of batteries.
“When should I charge a battery?”
Max. Charge Voltage: - While cut-off voltage is the minimum voltage of a
battery, Max. Charge voltage is the maximum voltage that a battery can reach.
When we charge a battery its voltage gets increased, the value of voltage at which
we should stop charging is called as the max. Charge voltage for a lithium cell with
3.7V nominal voltage the maximum charge voltage will be 4.2V. This value can
also be found in the datasheet.
If a battery is charged more than this maximum charge voltage then it is called
as overcharging. Overcharging will also damage the battery permanently and
might also lead to fire hazards.
Open Circuit Voltage (OCV): Open circuit voltage is the value of voltage measured
across the positive and negative terminal of a battery in no load condition. The
OCV of a lithium battery should always be between 3.0V to 4.2V for a healthy
battery. The Cut-off voltage and max. Discharge voltage is measured during the
open circuit condition.
Terminal Voltage: The terminal Voltage is the value of voltage measured across
the battery in loaded condition. The value of OCV and Terminal voltage will not be
equal, because when a load is connected and current is drawn form a battery its
voltage tends to decrease based on the amount of current drawn.
Summary of equations
1. Coulombic Efficiency (ηC in %): The Coulombic efficiency is the ratio between
the discharge and charge capacity. The efficiency of a battery is not always
constant and it depends on the SOC, cell temperature, lifetime and current. If
Ich(t) and Idisch(t) are the charging and discharging currents. ηC = 100(
∫Idisch(t)dt)/ ∫Ich(t)dt.
2. Energy Efficiency (ηE in %): The energy efficiency is the ratio between the
discharge and charge energy. If Ich(t), Vch(t) and Idisch(t) , Vdisch(t) are the
charging and discharging currents and voltages as a function of time,
respectively, ηE = 100 * (∫Idisch(t)Vdisch(t)dt)/( ∫Ich(t)Vch(t)dt) ηE = 100 * Edisch/Ech ,
where Ech and Edisch are the energy delivered to the battery during charging and
energy extracted from the battery during discharging, respectively.
3. Charge/Discharge rate (C-rate): It is the ratio of the magnitude of current
drawn/fed to the battery, to the nominal ampere-hour of the battery. C-rate =
(Ich/Qnom)
4. Nominal power (Pnom, in W) : It is rated power of the battery for charging or
discharging derived as a product of the nominal voltage and current of the
battery. Pnom = InomVnom
5. Energy density or specific energy (Wh/L or Wh/kg): It is the capacity of the
battery per unit volume or unit weight.
6. Ampere-hour (Qnom, in Ah): An ampere hour is a unit of electric charge that
corresponds to the charge transferred by a steady current of one ampere
flowing for one hour, or 3600 coulombs. The commonly seen milliampere hour
(mAh) is one-thousandth of an ampere hour (3.6 coulombs). Enom = QnomVnom
7. State of charge, SOC (BSOC, in %): The battery state of charge (SoC) is defined as
the ratio between the amount of energy currently stored in the battery, Ebatt
and the total battery capacity, Enom. BSOC = (Ebatt / Enom)100
8. Coulombic Efficiency (ηC in %): The Coulombic efficiency is the ratio between
the discharge and charge capacity. The efficiency of a battery is not always
constant and it depends on the SOC, cell temperature, lifetime and current. If
Ich(t) and Idisch(t) are the charging and discharging currents. ηC = 100(
∫Idisch(t)dt)/ ∫Ich(t)dt.
9. Energy Efficiency (ηE in %): The energy efficiency is the ratio between the
discharge and charge energy. If Ich(t), Vch(t) and Idisch(t) , Vdisch(t) are the
charging and discharging currents and voltages as a function of time,
respectively, ηE = 100 * (∫Idisch(t)Vdisch(t)dt)/( ∫Ich(t)Vch(t)dt) ηE = 100 *
Edisch/Ech , where Ech and Edisch are the energy delivered to the battery during
charging and energy extracted from the battery during discharging,
respectively.
10. Charge/Discharge rate (C-rate): It is the ratio of the magnitude of current
drawn/fed to the battery, to the nominal ampere-hour of the battery. C-rate =
(Ich/Qnom) .
Hybrid energy storage
One method of achieving electrical energy storage with a high specific power is to
use ultracapacitors (UC). The use of UC’s alone would not suffice, as these
components display poor specific energy characteristics. The ideal solution is to
use a hybrid energy storage method in a parallel configuration as shown in the
figure. This type of set up combines the high specific power density of UC’s with
the higher specific energy of an electrochemical battery.
Range testing
Although car manufacturers often advertise both the range of the EV and its
battery capacity (in kWh), consumers tend to be mostly concerned with the
range. To standardize the advertised range of an EV, both the EU and the US have
developed their own method of determining the 'real world' range of an EV.
In the United States, the governmental Environmental Protection Agency (EPA) is
in charge of fuel economy tests. The last major update to its techniques was in
2008, and in 2017 there has been an update for cars from that year onward. The
test goes through five cycles emulating 'average driving': city, highway, high
speed, A/C, cold temperature.
In a laboratory, the car is placed on a dynamometer, which is a sort of treadmill
for cars. Through adopting the rotational resistance of the rollers, the influence of
wind can be emulated.
Battery lifetime
Predicting the aging effects of individual battery cells, and therefore battery
lifetime, is a complex task, but crucial if the reliability and usability of EV’s is to be
improved. According to Troltsch etal, the main aging mechanism is the growth of
a surface film, also known as the solid electrolyte interface (SEI), on the negative
electrode. Other physical effects occur over time, which affect the conductivity of
the electrolyte and hence increase the internal resistance. The net effect is a
decrease in battery capacity over time. The lifetime of the battery is the time
whereby the battery capacity is above a minimum accepted capacity. As
described in Handbook of Batteries2, this lifetime depends on the depth of
discharge (DOD), the number of cycles and the age.
State of Health
The state of health (SOH) of a battery system is a term used to describe the
energy content of the battery after consideration of aging effects. In terms of EV
performance, relating the State of Charge (SOC) to the SOH provides a more
accurate indication of the energy remaining in the battery and thus a more
accurate fuel gauge to the driver. This concept is explained with reference to the
Table below. Assuming an energy usage of 0.2kWh/km and a battery with a
capacity of 30kWh, a range of 150km is achieved. However as the battery ages
and the capacity decreases, the range decreases. If the battery energy indicator
does not consider this aging effects, the EV will have a shorter range than predict.
Why do we need a Battery Management System
(BMS)?
The Lithium-ion batteries have proved to be the battery of interest for Electric
Vehicle manufacturers because of its high charge density and low weight. Even
though these batteries pack in a lot of punch for its size they are highly unstable
in nature. It is very important that these batteries should never be over charged
or under discharge at any circumstance which brings in the need to monitor its
voltage and current. This process gets a bit tougher since there are a lot of cells
put together to form a battery pack in EV and every cell should be individually
monitored for its safety and efficient operation which requires a special dedicated
system called the Battery Management System. Also to get the maximum
efficiency from a battery pack, we should completely charge and discharge all the
cells at the same time at the same voltage which again calls in for a BMS.
Battery Management system (BMS) Design
Considerations:-
Accuracy: When a cell is being charged or discharged the voltage across it
increases or decreases gradually. Unfortunately the discharge curve (Voltage vs
time) of a lithium battery has flat re0gions hence the change in voltage is very
less. This change has to be measured accurately to calculate the value of SOC or
to use it for cell balancing. A well designed BMS could have accuracy as high as
±0.2mV but it should minimum have an accuracy of 1mV-2mV. Normally a 16-bit
ADC is used in the process.
Cell Balancing:- Another vital function of a BMS is to maintain cell balancing.
For example, in a pack of 4 cells connected in series the voltage of all the four
cells should always have equal. If one cell is less or high voltage than the other it
will affect the entire pack, say if one cell is at 3.5V while the other three is at 4V.
During charging these three cells will attain 4.2V while the other one would have
just reached 3.7V similarly this cell will be the first to discharge to 3V before the
other three. This way, because of this single cell all the other cells in the pack
cannot be used to its maximum potential thus compromising the efficiency.
Charging Control :- Apart from the discharging the charging process should also
be monitored by the BMS. Most batteries tend to get damaged or get reduced in
lifespan when charged inappropriately. For lithium battery charger a 2-stage
charger is used. The first stage is called the Constant Current (CC) during which
the charger outputs a constant current to charge the battery. When the battery
gets nearly full the second stage called the Constant Voltage (CV) stage is used
during which a constant voltage is supplied to the battery at a very low current.
The BMS should make sure both the voltage and current during charging does not
exceed permeable limits so as to not over charge or fast charge the batteries. The
maximum permissible charging voltage and charging current can be found in the
datasheet of the battery.
Data Logging:- It is important for the BMS to have a large memory bank since it
has to store a lot of data. Values like the Sate-of-health SOH can be calculated
only if the charging history of the battery is known. So the BMS has to track of the
charge cycles and charge time of the battery pack from the date of installation,
and interrupt these data when required. This also aids in providing after sales
service or analyzing a problem with the EV for the engineers.
Discharging Control:- The primary function of a BMS is to maintain the lithium
cells within the safe operating region. For example a typical Lithium 18650 cell will
have an under voltage rating of around 3V. It is the responsibility of the BMS to
make sure that none of the cells in the pack get discharged below 3V.
Galvanic Isolation:- The BMS acts as a bridge between the Battery pack and
the ECU of the EV. All the information collected by the BMS has to be sent to the
ECU to be displayed on the instrument cluster or on the dashboard. So the BMS
and the ECU should be continuously communicating most through the standard
protocol like CAN communication or LIN bus. The BMS design should be capable
of providing a galvanic isolation between the battery pack and the ECU.
Less Ideal Power: A BMS should be active and running even if the car is running
or charging or in ideal mode. This makes the BMS circuit to be powered
continuously and hence it is mandatory that the BMS consumes a very less power
so as not to drain the battery much. When a EV is left uncharged for weeks or
months the BMS and other circuitry tend to drain the battery by themselves and
eventually requires to be cranked or charged before next use. This problem still
remains common with even popular cars like Tesla.
Powered from the Battery itself:- The only power source available in the EV
is the battery itself. So a BMS should be designed to be powered by the same
battery which it is supposed to protect and maintain. This might sound simple but
it does increase the difficulty of the design of the BMS.
Processing Speed:- The BMS of an EV has to do a lot of number crunching to
calculate the value of SOC, SOH etc. There are many algorithms to do this, and
some even uses machine learning to get the task done. This makes the BMS a
processing hungry device. Apart from this it also has to measure the cell voltage
across hundreds of cells and notice the subtle changes almost immediately.
State-of-Charge (SOC) Determination: You can think of SOC as the fuel
indicator of the EV. It actually tells us the battery capacity of the pack in
percentage. Just like the one in our mobile phone. But it is not as easy as it
sounds. The voltage and charge/discharge current of the pack should always be
monitored to predict the capacity of the battery. Once the voltage and current is
measured there are a lot of algorithms that can be used to calculate the SOC of
the Battery pack. The most commonly used method is the coulomb counting
method; we will discuss more on this later in the article. Measuring the values and
calculating the SOC is also the responsibility of a BMS.
State-of-Health (SOC) Determination:- The capacity of the battery not only
depends on its voltage and current profile but also on its age and operating
temperature. The SOH measurement tells us about the age and expected life
cycle of the battery based on its usage history. This way we can know how much
the mileage (distance covered after full charge) of the EV reduces as the battery
ages and also we can know when the battery pack should be replaced. The SOH
should also be calculated and kept in track by the BMS.
There are lot of factors that are to be considered while designing a BMS. The
complete considerations depend on the exact end application in which the BMS
will be used. Apart from EV’s BMS are also used wherever a lithium battery pack is
involved such as a solar panel array, windmills, power walls etc. Irrespective of
the application a BMS design should consider all or many of the following factors.
Thermal Control:- The life and efficiency of a Lithium battery pack greatly
depends on the operating temperature. The battery tends to discharge faster in
hot climates compared with normal room temperatures. Adding to this the
consumption of high current would further increase the temperature. This calls
for a Thermal system (mostly oil) in a battery pack. This thermal system should
only be able to decrease the temperature but should also be able to increase the
temperature in cold climates if needed. The BMS is responsible for measuring the
individual cell temperature and control the thermal system accordingly to
maintain the overall temperature of the battery pack.
To deal with this problem the BMS has to implement something called cell
balancing. There are many types of cell balancing techniques, but the commonly
used ones are the active and passive type cell balancing. In passive balancing the
idea is that the cells with excess voltage will be forced discharge through a load
like resistor to reach the voltage value of the other cells. While in active balancing
the stronger cells will be used to charge the weaker cells to equalize their
potentials.
Powered from the Battery itself: The only power source available in the EV is the
battery itself. So a BMS should be designed to be powered by the same
battery which it is supposed to protect and maintain. This might sound simple but
it does increase the difficulty of the design of the BMS.
Less Ideal Power: - A BMS should be active and running even if the car is
running or charging or in ideal mode. This makes the BMS circuit to be powered
continuously and hence it is mandatory that the BMS consumes a very less power
so as not to drain the battery much. When a EV is left uncharged for weeks or
months the BMS and other circuitry tend to drain the battery by themselves and
eventually requires to be cranked or charged before next use. This problem still
remains common with even popular cars like Tesla.
Galvanic Isolation: The BMS acts as a bridge between the Battery pack and the
ECU of the EV. All the information collected by the BMS has to be sent to the ECU
to be displayed on the instrument cluster or on the dashboard. So the BMS and
the ECU should be continuously communicating most through the standard
protocol like CAN communication or LIN bus. The BMS design should be capable
of providing a galvanic isolation between the battery pack and the ECU.
Data Logging: It is important for the BMS to have a large memory bank since it
has to store a lot of data. Values like the Sate-of-health SOH can be calculated
only if the charging history of the battery is known. So the BMS has to track of the
charge cycles and charge time of the battery pack from the date of installation,
and interrupt these data when required. This also aids in providing after sales
service or analyzing a problem with the EV for the engineers.
Accuracy: When a cell is being charged or discharged the voltage across it
increases or decreases gradually. Unfortunately the discharge curve (Voltage vs
time) of a lithium battery has flat regions hence the change in voltage is very less.
This change has to be measured accurately to calculate the value of SOC or to use
it for cell balancing. A well designed BMS could have accuracy as high as ±0.2mV
but it should minimum have an accuracy of 1mV-2mV. Normally a 16-bit ADC is
used in the process.
Processing Speed: The BMS of an EV has to do a lot of number crunching to
calculate the value of SOC, SOH etc. There are many algorithms to do this, and
some even uses machine learning to get the task done. This makes the BMS a
processing hungry device. Apart from this it also has to measure the cell voltage
across hundreds of cells and notice the subtle changes almost immediately.
Battery state Estimation
The major computational power of a BMS is dedicated to estimate the Battery
state. This includes the measurement of SOC and SOH. SOC can be calculated
using the cell voltage, current, charging profile and discharging profile. SOH can
be calculated by using the number of charge cycle and performance of the
battery.
“How to measure the SOC of a Battery?”
There are many algorithms to measure the SOC of a battery, each having its own
input values. The most commonly used method for SOC is called the Coulomb
Counting a.k.a book keeping method. We will discuss more on that later. Apart
from that there are many other advanced and more sophisticated algorithms that
are listed below.
Basic Methods
Coulomb Counting method
Ampere-hour (Ah) method
Open-Circuit Voltage (OCV) method
Impedance / IR Measurement Method
Machine Learning Based Algorithms
Neural Network Fuzzy Logic
Support Vector Machine
Advanced Method
State-Space Model Estimation using Kalman Filter
BMS – Thermal Management
Apart from measuring the voltage, current and temperature and calculating SOC,
SOH etc the BMS has another important task of regulating the battery
temperature. A battery pack would drain faster if operated in higher or lower
temperatures. To prevent this cooling systems are used in the battery. The Tesla
for example uses liquid cooling where a tube is passed through the battery pack
to get in contact with all the cells. A coolant like water or Glycol is then passed
through the tubes. The temperature of the coolant is controlled by the BMS based
on the cell temperatures. Apart from this the batteries also use air or chemicals to
maintain the required temperature.
With this let us conclude the article here, there are still lots to know about BMS
and how they work. Today many silicon companies like Renesas, Texas
Instruments etc. have their own series of BMS IC’s and Tool kits which could do
the hardware pulling for you and you can use it without diving deep into all this.
With every new EV in the market the BMS evolves to get much smarter and easy
to use.
Wireless Electric Vehicle Charging System
Based on the application, Wireless charging systems for EV can be
distinguished into two categories,
1. Static Wireless Charging
2. Dynamic Wireless Charging
1. Static Wireless Charging
As the name indicates, the vehicle gets charged when it remains static. So here
we could simply park the EV at the parking spot or in garage which is incorporated
with WCS. Transmitter is fitted underneath the ground and receiver is arranged in
vehicle’s underneath. To charge the vehicle align the transmitter and receiver and
leave it for charging. The charging time depends on the AC supply power level,
distance between the transmitter & receiver and their pad sizes.
This SWCS is best to build in areas where EV is being parked for a certain time
interval.
Static Wireless Charging System
2.Dynamic Wireless Charging System (DWCS): As the name indicates here vehicle
get charged while in motion. The power transfers over the air from a stationary
transmitter to the receiver coil in a moving vehicle. By using DWCS EV's travelling
range could be improved with the continuous charging of its battery while driving
on roadways and highways. It reduces the need for large energy storage which
further reduce the weight of the vehicle.
Types of EVWCS
Based on operating Techniques EVWCS can be classified into four types
Capacitive Wireless Charging System (CWCS)
Permanent Magnetic Gear Wireless Charging System (PMWC)
Inductive Wireless Charging System (IWC)
Resonant Inductive Wireless Charging System (RIWC)
1. Capacitive Wireless Charging System (CWCS)
Wireless transfer of energy between transmitter and receiver is accomplished by
means of displacement current caused by the variation of electric field. Instead of
magnets or coils as transmitter and receiver, coupling capacitors are used here for
wireless transmission of power. The AC voltage first supplied to power factor
correction circuit to improve efficiency and to maintain the voltage levels and to
reduce the losses while transmitting the power. Then it is supplied to an H-bridge
for the High-frequency AC voltage generation and this high frequency AC is
applied to transmitting plate which causes the development of oscillating electric
field that causes displacement current at receiver plate by means of electro static
induction.
The AC Voltage at receiver side is converted to DC to feed the battery through
BMS by rectifier and filter circuits. Frequency, voltage, size of coupling capacitors
and air-gap between transmitter and receiver affects the amount of power
transferred. It’s operating frequency is between 100 to 600 KHz.
2. Permanent Magnet Gear Wireless Charging System (PMWC)
Here transmitter and receiver each consist of armature winding and synchronized
permanent magnets inside the winding. At transmitter side operation is similar to
motor operation. When we apply the AC current to transmitter winding it induces
mechanical torque on transmitter magnet causes it's rotation. Due to the
magnetic interaction change in transmitter, PM field causes torque on receiver
PM which results it's rotation in synchronous with transmitter magnet. Now
change in receiver permanent magnetic field causes the AC current production in
winding i.e, receiver acts as generator as mechanical power input to the receiver
PM converted into electrical output at receiver winding. The coupling of rotating
permanent magnets is referred as magnetic gear. The generated AC power at
receiver side fed to the battery after rectifying and filtering through power
converters.
3. Inductive Wireless Charging System (IWC)
The basic principle of IWC is Faraday's law of induction. Here wireless
transmission of power is achieved by mutual induction of magnetic field between
transmitter and receiver coil. When the main AC supply applied to the transmitter
coil, it creates AC magnetic field that passes through receiver coil and this
magnetic field moves electrons in receiver coil causes AC power output. This AC
output is rectified and filtered to Charge the EV’s energy storage system. The
amount of power transferred depends on frequency, mutual inductance and
distance between transmitter and receiver coil. Operating frequency of IWC is
between 19 to 50 KHz.
4. Resonant Inductive Wireless Charging System (RIWC)
Basically resonators having high Quality factor transmit energy at much higher
rate, so by operating at resonance, even with weaker magnetic fields we can
transmit the same amount of power as in IWC. The power can be transferred to
long distances without wires. Max transfer of power over the air happens when
the transmitter and receiver coils are tuned i.e., both coils resonant frequencies
should be matched. So to get good resonant frequencies, additional
compensation networks in the series and parallel combinations are added to the
transmitter and receiver coils. This additional compensation networks along with
improvement in resonant frequency also reduces the additional losses. Operating
frequency of RIWC is between 10 to 150 KHz.
What are the reasons for battery degradation?
It is difficult to point one particular reason for Battery Degradation, it can be
caused by multiple factors. Operating and storage conditions like Overcharging,
Deep discharging, charging with a high C rate, storing with full SOC, operating and
storing in high temperature are the major causes that affect the battery health
and leads to battery degradation. Internal chemical reactions like Damage of the
Crystalline Structure of anode, formation of SEI layer and corrosion also cause
battery degradation.
Effect of Overcharging and Deep Discharging EV Batteries:
Charging the battery to its maximum level and deep discharging it, may give long-
range but it stresses the battery. During charging and discharging as the anode
material absorbs and releases the lithium material, it’s volume will vary. Over the
cycling, these volume variations weaken the crystalline structured anode. During
the deep discharge of batteries, the variation of volume will be more which
causes micro-cracks on the anode. This exposes the new parts of anode particles
to electrolytes which results in the formation of SEI, in turn, SEI increases the
internal resistance of the battery and consumes some amount of lithium for its
formation resulting in irreversible capacity loss of the battery.
Effect of Temperature on Electric Vehicle Battery:
Basically for lithium-ion batteries optimal temperature range is between 15 °C–
35 °C. Operating out of this comfortable range will accelerate the degradation of
the battery. At low temperature ionic conductivity of the electrolyte and lithium-
ion diffusivity at electrodes will decrease. It takes more time to Charge the
batteries in low temperatures due to the slow down of lithium-ion intercalation
into the anodes. This will lead to the deposition of lithium ions on the electrode
surface and causes the battery degradation.
Operating at high temperature shortens the lifetime of lithium-ion batteries. High
temperature enhances the decomposition of conductive salt (lithium
Hexafluorophosphate) in electrolytes. And also increases the inorganic
compounds at the SEI layers. This increases the internal impedance of
batteries which further increases the internal temperature batteries. If such heat
left uncontrolled it not only causes battery degradation but also causes Thermal
runaway.
Another reason for battery degradation is corrosion. The presence of any trace of
water in manufacturing the battery leads to corrosion. LiPF6, the Most commonly
used lithium salt in the electrolyte is reactive to water and forms hydro fluoric
acid. This hydro fluoric acid is corrosive to metallic collector causes battery
degradation.
Basic DC-DC converter
The DC-DC converters illustrated in the figure above is used to interface two DC
systems and control the flow of power between them. Their basic function in a DC
environment is similar to that of transformers in AC systems. Unlike transformers,
the ratio of the input to the output, either voltage or current, can continuously be
varied by the control signal and this ratio can be higher or lower than unity. The
DC-DC converters are constructed of electronic switches and sometimes include
inductive and capacitive components, all of which are normally followed by a low-
pass filter.
Depending upon the direction of the output current and voltage, the converters
can be classified into five classes as shown in the figure. One-quadrant (classes A
and B), two-quadrant (classes C and D) and four-quadrant operation can be
realized.
Bidirectional power flow (2 quadrant converter) is required in automotive
applications. Let us assume that voltage Vin is the voltage of the DC link (500 V)
and voltage Vout is voltage of the battery (200V). The battery has to be charged
during slowing down (decelerating) the vehicle and discharged during driving and
accelerating (speeding up). Both voltages do not change their polarity. What is
changing polarity is the current. We need a converter working as a class C
(Figure).
Now that you have an understanding of how the simple DC-DC buck converter
works, we summarize the main equations for the converter here. These equations
are for continuous conduction mode, where the current always flows through the
inductor. Discontinuous conduction mode is out of the scope of this course. You
can find the equations on the next page.
Key equations for a buck converter.
V0 = DVin
T = 1/f
D = Ton/(T)
T = Ton + Toff
Where
V0 is the output voltage
D is the duty cycle of the switch
Vin is the input voltage
f is the switching frequency of the semiconductor switch
T is the time period of the semiconductor switch
Ton is the ON time of the semiconductor switch
Toff is the OFF time of the semiconductor
Key equations for a boost converter
V0 = Vin/(1-D)
T = 1/f
D = Ton/(T)
T = Ton + Toff
where
V0 is the output voltage
D is the duty cycle of the switch
Vin is the input voltage
f is the switching frequency of the semiconductor switch
T is the time period of the semiconductor switch
Ton is the ON time of the semiconductor switch
Toff is the OFF time of the semiconductor switch.
DC-DC converter: driving and regenerative
breaking.
In a battery-powered electric vehicle, regenerative braking (also called
regenerative breaking) is the conversion of the vehicle’s kinetic energy into
chemical energy stored in the battery, where it can be used later to drive the
vehicle. It is braking because it also serves to slow the vehicle. It is regenerative
because the energy is recaptured in the battery where it can be used again.
A torque command is derived from the position of the throttle pedal. The motor
controller converts this torque command into the appropriate 3-phase voltage
and current waveforms to produce the commanded torque in the motor in the
most efficient way. The torque command can be positive or negative. When the
torque serves to slow the vehicle then energy is returned to the battery and
presto - we have regenerative braking!
So a good proportion of the energy you lose by braking is returned to the
batteries and can be reused when you start off again as shown in Figure 1. In
practice, regenerative brakes take time to slow cars down ands have power
limitations based on the rated power of the motor, power electronics and battery.
So, most vehicles that use them also have ordinary (friction) brakes working
alongside. That's one reason why regenerative brakes doesn't save 100% of our
braking energy.
In case of driving the vehicle forward, the opposite occurs and energy from the
battery is used by the battery converter and motor drive to power the motor with
a positive torque command.
Power converters
From a power conversion perspective, generators used in wind turbines typically
produce variable frequency AC power. Two back to back AC-to-DC and DC-to-AC
power converters are used to convert the variable frequency AC power to high
voltage or medium voltage 50Hz or 60Hz AC power used for long distance power
transmission. This power is then stepped down to low voltage AC power, and the
EV can then be charged using AC or DC charging.
The simplest way to realize a solar powered EV charging station is to use a solar
inverter. A DC- to-DC power converter operates the solar panels at the maximum
power point. Then, a DC-AC inverter converts the DC power to 50Hz or 60Hz AC
power for AC charging of the EV. There is, however, one disadvantage with this
method. Photovoltaic panels and the EV battery are both fundamentally direct
current or DC by nature. And in this method, the DC power is unnecessarily
converted to AC and back.
Hence, a more efficient way to charge EV from PV is to use an isolated DC-to-DC
converter and directly charge the EV from PV using DC charging as shown in the
fiqure.
There are three power converters, a DC-to-DC converter for the solar panels, a
DC-DC isolated converter for the electric car and a DC-to-AC inverter to connect
to the AC grid.
Using this design, direct DC charging of EV from PV can be realized.
Secondly, if there is no electric car, then the system acts as a solar inverter and
feeds PV power to the grid.
Third, if there is no solar power, the system operates as a conventional DC
charger and charges the EV from the grid.
Finally, the charger is bidirectional and capable of vehicle-to-grid. So the EV can
not only charge from the grid, it can feed power back to the grid as well.
The unique aspect of combining solar charging and vehicle-to-grid is that the
electric car battery can now be used as a storage for renewable electricity.
Overcoming variability in renewable energy
generation
The main challenge with powering electric cars from renewable energy is the
variability in generation.
Using a combination of solar and wind
A solution to overcome this variation is to size the wind and solar installation such
that we are guaranteed of sufficient energy even when the sunshine and wind are
minimal. The disadvantage is that this can cause overproduction and wastage of
power when the solar insolation and/or wind speeds are maximum. By optimally
sizing a PV and wind hybrid system, then the variability in PV generation can be
partially balanced by the variability in wind generation resulting in a net system
with minimal wastage of power.
In the graph, we can see a system with different percentage of total renewable
generation (40% to 100%) and which percentage of that is wind or solar
generation. It can be seen that the energy wastage increases as more renewables
are used to supply the load due to mismatch between renewable generation and
load demand. However, the power wastage can be drastically reduced when an
optimally combination of both wind and solar generation is used.
Future of electric vehicles
 World BEV
After entering commercial markets in the first half of the decade, electric car sales
have soared. Only about 17 000 electric cars were on the world’s roads in 2010.
By 2019, that number had swelled to 7.2 million, 47% of which were in The
People’s Republic of China (“China”). Nine countries had more than 100 000
electric cars on the road. At least 20 countries reached market shares above 1%.
The 2.1 million electric car sales in 2019 represent a 6% growth from the previous
year, down from year-on-year sales growth at least above 30% since 2016. Three
underlying reasons explain this trend:
 Car markets contracted. Total passenger car sales volumes were depressed in
2019 in many key countries. In the 2010s, fast-growing markets such as China and
India for all types of vehicles had lower sales in 2019 than in 2018. Against this
backdrop of sluggish sales in 2019,the 2.6% market share of electric cars in
worldwide car sales constitutes a record. In particular, China (at 4.9%) and Europe
(at 3.5%) achieved new records in electric vehicle market share in 2019.
 Purchase subsidies were reduced in key markets. China cut electric car purchase
subsidies by about half in 2019 (as part of a gradual phase out of direct incentives
set out in 2016). The US federal tax credit programme ran out for key electric
vehicle automakers such as General Motors and Tesla (the tax credit is applicable
up to a 200 000 sales cap per automaker). These actions contributed to a
significant drop in electric car sales in China in the second half of 2019, and a 10%
drop in the United States over the year. With 90% of global electric car sales
concentrated in China, Europe and the United States, this affected global sales
and overshadowed the notable 50% sales increase in Europe in 2019, thus slowing
the growth trend.
 Consumer expectations of further technology improvements and new models.
Today’s consumer profile in the electric car market is evolving from early adopters
and technophile purchasers to mass adoption. Significant improvements in
technology and a wider variety of electric car models on offer have stimulated
consumer purchase decisions. The 2018-19 versions of some common electric car
models display a battery energy density that is 20-100% higher than were their
counterparts in 2012. Further, battery costs have decreased by more than 85%
since 2010. The delivery of new mass-market models such as the Tesla Model 3
caused a spike in sales in 2018 in key markets such as the United States.
Automakers have announced a diversified menu of electric cars, many of which
are expected in 2020 or 2021. For the next five years, automakers have
announced plans to release another 200 new electric car models, many of which
are in the popular sport utility vehicle market segment. As improvements in
technical performance and cost reductions continue, consumers are placed in the
position of being attracted to a product but wondering if it would be wise to wait
for the “latest and greatest model.

Electric Vehicles

  • 1.
    Project Report Electric Vehicles SantLongowal Institute of Engineering and Technology 2020 Ashwini Kumar GEE/1740705
  • 2.
    History of ElectricVehicle It’s hard to pinpoint the invention of the electric car to one inventor or country. Instead it was a series of breakthroughs -- from the battery to the electric motor - - in the 1800s that led to the first electric vehicle on the road. In the early part of the century, innovators in Hungary, the Netherlands and the United States -- including a blacksmith from Vermont -- began toying with the concept of a battery-powered vehicle and created some of the first small-scale electric cars. And while Robert Anderson, a British inventor, developed the first crude electric carriage around this same time, it wasn’t until the second half of the 19th century that French and English inventors built some of the first practical electric cars. In the U.S., the first successful electric car made its debut around 1890 thanks to William Morrison, a chemist who lived in Des Moines, Iowa. His six-passenger vehicle capable of a top speed of 14 miles per hour was little more than an electrified wagon, but it helped spark interest in electric vehicles. Over the next few years, electric vehicles from different automakers began popping up across the U.S. New York City even had a fleet of more than 60 electric taxis. By 1900, electric cars were at their heyday, accounting for around a third of all vehicles on the road. During the next 10 years, they continued to show strong sales. Types of Electric Vehicles Hybrid Electric Vehicles (HEVs):- HEVs are powered by both petrol and electricity. The electric energy is generated by the car’s own braking system to recharge the battery. This is called ‘regenerative braking’, a process where the electric motor helps to slow the vehicle and uses some of the energy normally converted to heat by the brakes. Plug-in Hybrid Electric Vehicles (PHEVs):-HEVs start off using the electric motor, then the petrol engine cuts in as load or speed rises. The two motors are controlled by an internal computer which ensures the best economy for the driving conditions. The Honda Civic Hybrid and Toyota Camry Hybrid are both
  • 3.
    examples of HEVs.PHEVs have an electric motor range of between 50 before the petrol engine kicks in. Due to the added weight and complexity, the electric motor range of a PHEV will generally be less than a BEV Battery Electric Vehicles (BEVs): with high-capacity battery packs. T motor and all onboard electronics. BEVs do not emit any harmful emissions and hazards caused by traditional gasoline electricity from an external source. Electric Vehicl according to the speed with which they recharge an EVs battery. BEV is currently around 100 per day, the BEV can be a good option. better as newer models hit the market. The next to handle 300km on a single charge and the latest Tesla Model S has a range of 500km. Sizing of the EV power train Rolling resistance force The rolling resistance force occurs due to the friction between the tires and the driving surface. The rolling resistance force is zero at standstill. starts moving, the rolling resistance force acts in the direction opposite to the direction of motion and can be calculated by the rolling resistance coefficient Cr multiplied by the normal force between the vehicle and the road. For a flat surface, the normal force is the vehicle mass gravity g. In the case of a road with an inclination angle, the weight m.g multiplied by the cosine of the road angle. the rolling resistance force is independent of the vehicle speed, and it is always opposite the driving direction. frictional losses low. For modern cars, it’s typically around 0.01 to 0.02. have an electric motor range of between 50 petrol engine kicks in. Due to the added weight and complexity, the electric motor range of a PHEV will generally be less than a BEV Battery Electric Vehicles (BEVs):- Battery electric vehicles store electricity onboard capacity battery packs. Their battery power is used to run the electric motor and all onboard electronics. BEVs do not emit any harmful emissions and hazards caused by traditional gasoline – powered vehicles .BEVs are charged by electricity from an external source. Electric Vehicle (EV) chargers are classified according to the speed with which they recharge an EVs battery. The range of a BEV is currently around 100-150km, and as most motorists drive around 35 a good option. The ranges of BEVs are getting better and better as newer models hit the market. The next-gen Nissan Leaf should be able to handle 300km on a single charge and the latest Tesla Model S has a range of Sizing of the EV power train:- Rolling resistance force stance force occurs due to the friction between the tires and the driving surface. The rolling resistance force is zero at standstill. When the vehicle starts moving, the rolling resistance force acts in the direction opposite to the d can be calculated by the rolling resistance multiplied by the normal force between the vehicle and the road. For a flat surface, the normal force is the vehicle mass m times the standard In the case of a road with an inclination angle, the normal force becomes the multiplied by the cosine of the road angle. It is important to note that the rolling resistance force is independent of the vehicle speed, and it is always e driving direction. The coefficient Cr should be low so as to keep the frictional losses low. For modern cars, it’s typically around 0.01 to 0.02. have an electric motor range of between 50-100km petrol engine kicks in. Due to the added weight and complexity, the Battery electric vehicles store electricity onboard heir battery power is used to run the electric motor and all onboard electronics. BEVs do not emit any harmful emissions and powered vehicles .BEVs are charged by e (EV) chargers are classified The range of a 150km, and as most motorists drive around 35-70km getting better and gen Nissan Leaf should be able to handle 300km on a single charge and the latest Tesla Model S has a range of stance force occurs due to the friction between the tires and the When the vehicle starts moving, the rolling resistance force acts in the direction opposite to the multiplied by the normal force between the vehicle and the road. times the standard force becomes the It is important to note that the rolling resistance force is independent of the vehicle speed, and it is always should be low so as to keep the frictional losses low. For modern cars, it’s typically around 0.01 to 0.02.
  • 4.
    Aerodynamic drag force Asthe vehicle speed increase, motion as the air as is forced to flow around the moving vehicle. calculated as the product of the aerodynamic drag coefficient the vehicle Af, the air density It is hence important to note that the aerodynamic drag in independent of vehicle mass but has a strong dependence on the vehicle speed. That is why in a car, the aerodynamic drag force is higher than the is above about 70 to 80 km/h. Secondly, the coefficient of drag is typically about 0.25 to 0.35 for a modern car. SUVs, with their typically boxy shapes, have coefficients in the range of 0.35 to 0.45. Gradient force The third force that acts on a vehicle vehicle is driving on an uphill longitudinal component of gravitational force, namely the inclination angle of the road. As seen earlier, the cosine c gravity contributes to the normal force and the corresponding rolling resistance force. The gradient force and the angle positive when driving uphill. terms of tangent theta and have a value typically between plus or minus 10%. If we now consider a vehicle moving on an inclined surface, then the aerodynamic drag force, the rolling resistance force and the gradient force act on the vehicle. If we now include the traction force provided by the vehicle powertrain, then the net force on the vehicle, is the difference between the traction force and the sum of the forces due to the aerodynamic drag, the rolling resistance, and the road gradient. force As the vehicle speed increase, the aerodynamic drag force opposes the vehicle motion as the air as is forced to flow around the moving vehicle. It can be calculated as the product of the aerodynamic drag coefficient Cd the front area of Af, the air density and the square of the vehicle speed v, divided by 2. e important to note that the aerodynamic drag in independent of vehicle mass but has a strong dependence on the vehicle speed. That is why in a car, the aerodynamic drag force is higher than the rolling resistance force when the speed 80 km/h. Secondly, the coefficient of drag is typically about 0.25 to 0.35 for a modern car. SUVs, with their typically boxy shapes, have coefficients in the range of 0.35 to The third force that acts on a vehicle is the gradient force, and it occurs when the an uphill or a downhill road. The gradient force is due to the longitudinal component of gravitational force, namely mgsin(theta) the inclination angle of the road. As seen earlier, the cosine component of the contributes to the normal force and the corresponding rolling resistance The gradient force and the angle theta are negative when driving downhill, positive when driving uphill. Road gradients are expressed as a percentag and have a value typically between plus or minus 10%. If we now consider a vehicle moving on an inclined surface, then the aerodynamic drag force, the rolling resistance force and the gradient force act on the vehicle. If w include the traction force provided by the vehicle powertrain, then the net force on the vehicle, is the difference between the traction force and the sum of the forces due to the aerodynamic drag, the rolling resistance, and the road the aerodynamic drag force opposes the vehicle It can be the front area of v, divided by 2. e important to note that the aerodynamic drag in independent of vehicle mass but has a strong dependence on the vehicle speed. That is why in a car, the resistance force when the speed Secondly, the coefficient of drag is typically about 0.25 to 0.35 for a modern car. SUVs, with their typically boxy shapes, have coefficients in the range of 0.35 to occurs when the The gradient force is due to the where theta is omponent of the contributes to the normal force and the corresponding rolling resistance downhill, and Road gradients are expressed as a percentage in and have a value typically between plus or minus 10%. If we now consider a vehicle moving on an inclined surface, then the aerodynamic drag force, the rolling resistance force and the gradient force act on the vehicle. If w include the traction force provided by the vehicle powertrain, then the net force on the vehicle, is the difference between the traction force and the sum of the forces due to the aerodynamic drag, the rolling resistance, and the road
  • 5.
    By Newton’s secondlaw, the net force is equal to the product of the vehicle mass and vehicle acceleration. Therefore, we can control the vehicle acceleration and thereby the speed by controlling the traction force that the powertrain produces. The traction force is in the driving direction most of the time, but it can be zero when the vehicle is coasting or even regenerative braking. If we now expand the equation for the traction force, we can see influence the vehicle forces: the vehicle mass and road angle affects the rolling resistance and gradient force, vehicle speed decides the aerodynamic drag force, and the rest of the traction force decides the vehicle acceleration. If we need to estimate the power delivered by the powertrain, then we need to multiply the traction force with the speed It is important to realize that in this in the forward and reverse direction, as they influence the in other directions are neglected for simplicity. Secondly, the forces in the vehicle are assumed to be acting at one point. In reality, the forces are distributed over the vehicle. on’s second law, the net force is equal to the product of the vehicle mass Therefore, we can control the vehicle acceleration and thereby the speed by controlling the traction force that the powertrain produces. is in the driving direction most of the time, but it can be zero when the vehicle is coasting or even negative when the powertrain is under If we now expand the equation for the traction force, we can see the factors that he vehicle forces: the vehicle mass and road angle affects the rolling resistance and gradient force, vehicle speed decides the aerodynamic drag force, and the rest of the traction force decides the vehicle acceleration. If we need to livered by the powertrain, then we need to multiply the speed of the vehicle. It is important to realize that in this lecture, we only take into account the forces in the forward and reverse direction, as they influence the powertrain. The forces in other directions are neglected for simplicity. Secondly, the forces in the vehicle are assumed to be acting at one point. In reality, the forces are distributed over on’s second law, the net force is equal to the product of the vehicle mass Therefore, we can control the vehicle acceleration and thereby the speed by controlling the traction force that the powertrain produces. is in the driving direction most of the time, but it can be zero when the powertrain is under the factors that he vehicle forces: the vehicle mass and road angle affects the rolling resistance and gradient force, vehicle speed decides the aerodynamic drag force, and the rest of the traction force decides the vehicle acceleration. If we need to livered by the powertrain, then we need to multiply the we only take into account the forces powertrain. The forces in other directions are neglected for simplicity. Secondly, the forces in the vehicle are assumed to be acting at one point. In reality, the forces are distributed over
  • 6.
    Let us nowlook at a force/speed diagram of a frontal area of 2.5m^2 and the speed range of 0 the traction force, we can calculate the force at each speed level for zero vehicle acceleration. Those points make is close to zero, then the traction force is used to overcome the rolling resistance force. As the speed increase, the traction force needed increases fast, as the aerodynamic force increase with the square of the speed. Next, let us investigate 3 road conditions, a flat road, a 5% gradient uphill, and a 5% gradient downhill. We can see in the downhill condition, the traction force needed for low speeds is negative, as the gradient force is larger than combined rolling resistance and aerodynamic drag forces. On the other hand, the uphill gradient requires a significantly higher traction force for the same speed than the 0% or downhill gradient. Let us now look at a force/speed diagram of a vehicle with a mass of 1.5 ton, frontal area of 2.5m^2 and the speed range of 0-200 km/h. From the formula for the traction force, we can calculate the force at each speed level for zero vehicle make a force/speed curve of this car. When the speed is close to zero, then the traction force is used to overcome the rolling resistance force. As the speed increase, the traction force needed increases fast, as the aerodynamic force increase with the square of the speed. estigate 3 road conditions, a flat road, a 5% gradient uphill, and a We can see in the downhill condition, the traction force needed for low speeds is negative, as the gradient force is larger than combined dynamic drag forces. On the other hand, the uphill gradient requires a significantly higher traction force for the same speed than the vehicle with a mass of 1.5 ton, From the formula for the traction force, we can calculate the force at each speed level for zero vehicle ar. When the speed is close to zero, then the traction force is used to overcome the rolling resistance force. As the speed increase, the traction force needed increases fast, as the estigate 3 road conditions, a flat road, a 5% gradient uphill, and a We can see in the downhill condition, the traction force needed for low speeds is negative, as the gradient force is larger than combined dynamic drag forces. On the other hand, the uphill gradient requires a significantly higher traction force for the same speed than the
  • 7.
    Finally, let’s considerthe case when the vehicle has a finite acceleration. This is the speed/force curve for the same car with 0% gradient and zero acceleration. Since the mass of the car is 1500kg, for every 1m/s2 acceleration, an extra 1500N traction force from the powertrain would be required. Besides the traction force, the EV battery auxiliaries, like heating, air conditioning, lighting, wiper etc. Hence, the net power delivered by the traction battery, auxiliary power. To conclude, the forces acting on resistance force, the aerodynamic drag force and the gradient force. The drive train provides the traction force, which can be controlled to change the vehicle acceleration and hence the speed. Finally, let’s consider the case when the vehicle has a finite acceleration. This is eed/force curve for the same car with 0% gradient and zero acceleration. Since the mass of the car is 1500kg, for every 1m/s2 acceleration, an extra 1500N traction force from the powertrain would be required. Besides the traction force, the EV battery also provides power for the vehicle auxiliaries, like heating, air conditioning, lighting, wiper etc. Hence, the net power delivered by the traction battery, Pbatt is the sum of the traction power To conclude, the forces acting on a vehicle when it’s driving consist of the rolling resistance force, the aerodynamic drag force and the gradient force. The drive train provides the traction force, which can be controlled to change the vehicle acceleration and hence the speed. Finally, let’s consider the case when the vehicle has a finite acceleration. This is eed/force curve for the same car with 0% gradient and zero acceleration. Since the mass of the car is 1500kg, for every 1m/s2 acceleration, an extra 1500N also provides power for the vehicle auxiliaries, like heating, air conditioning, lighting, wiper etc. Hence, the net power power and the a vehicle when it’s driving consist of the rolling resistance force, the aerodynamic drag force and the gradient force. The drive train provides the traction force, which can be controlled to change the vehicle
  • 8.
    Motor used inElectric Vehicles Induction Motor :- The AC induction motor needs no permanent magnets. Instead the magnetic field is produced by a current that flows through the windings in the housing or stator. Now if you connect the stator to an alternating current, this means the magnetic field in the stator will also alternate. If a three phase AC input is used, a so called rotating magnetic field or RMF is produced. The magnetic field from the stator will induce a voltage and current in the windings of the rotor. That’s why it’s called the induction motor. This in turn leads to the rotor producing its own magnetic field, and this magnetic field will make the rotor turn so as to align itself with the magnetic field from the stator. The rotor will follow this rotating magnetic field in the stator, without the need for a commutator with brushes. Permanent Magnet Motor :- If we construct a rotor with permanent magnets, we no longer need to induce a magnetic field in the rotor. This avoids losses and heat development in the rotor. Because of all this, permanent magnet motors are currently the smallest and lightest electric motors you can buy. Because the rotor is already magnetized it is always in sync with the rotating magnetic field. That’s why permanent magnet motors are also classified as synchronous motors.
  • 9.
    Synchronous reluctance motor:-The synchronous reluctance motor has only recently been developed and seems to have best of both worlds. It has a rotor that contains metal that is formed in such a way that it wants to align itself naturally to the surrounding magnetic field. This means it doesn’t need to produce its own electric field through induced currents, like the induction motor, which means less losses. Finally, it doesn’t need permanent magnets which makes it much cheaper than a permanent magnet motor.
  • 10.
  • 11.
    Configuration of motorlayout Single Motor Configuration Double Motor Configuration
  • 12.
    A number ofmotor configurations are possible for EV’s, which provides more flexibility for the driveline layout. Single motor configurations use one motor that drives either the front or rear axles. With a dual motor configuration, two motors are used to drive the EV and this can be done in different ways. One possibility is that one motor can power the front axle and the other the rear axle. Second, both the motors can be placed on either the front or rear axle to provide increased torque compared to the single motor configuration. Alternately, the two motors can be used to drive the left and right wheel independently on either the front or rear axle, meaning there is more control over the vehicle when cornering/turning. Although, most EV manufacturers currently adopt the single motor configuration, the dual motor configuration has also been used for vehicle models with higher torque capability. In-wheel motor configuration Using a separate motor to drive each of the four wheels independently is another possibility. This can be achieved using an in-wheel where the motor that is placed within the wheel of the car. The in-wheel motors can be either geared or gearless, as represented in the figure. The gearless option has the potential to improve the overall efficiency of the driveline, but additional controller complexity and hardware required make such a system more complex.
  • 13.
    Isolation between EVbattery and grid Lead acid batteries :- This is a mature technology where limited progress has been made in terms of energy and power density. Deep cycle batteries are available, which have re-enforced electrodes to avoid separation and sludge formation. Prospects for use in EVs are limited, due to low energy densities, sensitivity to temperature and life cycle. Nickel based batteries :- Nickel-metal hydride (NiMH) batteries are used extensively for traction purposes, and are optimized for high energy content. Nickel-cadmium (NiCd) batteries also show good potential for high specific energy and specific power, although the presence of cadmium has raised some environmental concerns. High temperature batteries Sodium-nickel chloride (NaNiCl or Zebra) batteries have been deployed in numerous EV applications to date4. The high specific energy is attractive for long range EVs. The high operating temperature (300°C) requires pre-heating before use, which can use quite a lot of energy if parked regularly for long periods. For this reason, this battery is considered more suitable to applications where the EV is being used continuously (public transport and delivery vans etc.). Metal air batteries Aluminum-air (Al-air) and zinc-air (Zn-air) batteries both use oxygen absorbed from the atmosphere on discharge and expel oxygen when being charged. The energy density of these batteries is high but, lower power densities mean that applications are limited. Al-air batteries consume the aluminum electrode, and must be removed and replaced or reprocessed. Some applications have been tested where fleets of EV delivery vehicles are running with Zn-air batteries, where removable zinc cassettes can be replaced when discharged for recharged units. The low specific power of metal air batteries may see these battery types
  • 14.
    restricted to longdistance delivery vehicles, but the advantages of regenerative braking may be sacrificed. Lithium based batteries Lithium based batteries are classified by the type of active material. Two main types exist, those with liquid (Li-ion-liquid) and those with polymer electrolyte (Li- ion-polymer). The Li-ion-liquid type is generally preferred for EV applications. Within the Li-ion-liquid type, there are three lithium materials, lithium cobalt, (or lithium manganese oxides), lithium iron phosphate and lithium titanate. Lithium manganese Lithium manganese (LiMn2O4) offers a potentially lower cost solution. It has been largely studied for electrical vehicle application, especially in Japan. The drawback of this type of battery is the poor battery life due to the slight solubility of Mn. Lithium iron phospate Lithium iron phosphate (LiFePO4) batteries are manufactured by many companies in the world and have gained credibility through their use in power tools. Lithium iron phosphate cells have a much lower energy density than standard format cells, but can be charged much faster—around twenty to thirty minutes. Moreover, LiFePO4 has been recently considered that it features an improve stability on overcharge which is good for safety, a very high power and has potential for lower cost because they use iron. Lithium titanate Lithium titanate allows charging on the order of ten minutes and have been shown to have an extremely long cycle life - on the order of 5000 full depth of discharge cycles. Lithium titanate has high inherent safety because the graphite anode of two other batteries is replaced with a titanium oxide. Specific power limitation The ability of a battery to deliver and accept energy at very high rates is limited by the physical processes occurring within the battery cells. When current flows into the battery, the reaction within the cell must occur at a corresponding rate1. This means that the dynamics of the reaction at the electrode surface and the transport of ions (kinetic properties) must occur at the same rate as the supplied current. Because of the high currents associated with high power, the reaction rate is unable to match the rate at which current is being supplied. As a result, the capacity of the battery is reduced and joule heating occurs within the cell. Specific energy limitation The restricted energy content of batteries is one of the major drawbacks limiting the successful implementation of EV technology. Considering the specific energy of gasoline is 9.2kWh/kgcorresponding to more than 3kWh/kg useful specific energy2, limitations of the battery powered EV become apparent. Two emerging
  • 15.
    battery technologies addressingthe specific energy limitations are lithium air (Li- air) and lithium flour (Li-flour). Basics of Electrical Vehicle Batteries Voltage Rating:- Two very common rating that you can find to be marked on a battery is its voltage rating and Ah Rating. Lead acid batteries are commonly of 12V and lithium batteries are of 3.7V. This is called the nominal voltage of a battery. This does not mean the battery will provide 3.7V across its terminals all the time. The value of voltage will vary based on the capacity of the battery. We will discuss more on this later. Ah rating or mAh rating: Next to the voltage rating another common parameter is the Ah rating. The term Ah stands for Ampere hour. Some people use mAh which is nothing but milli-Ampere hour, meaning 1Ah = 1000mAh. Ah rating of a battery tells us about the capacity of the battery. For example a 2Ah battery can give 2A for one hour, the same battery will give 1A for 2 hours and if we take 4A from it, the battery will last only 30 minutes. Run time = Ah Rating / Current rating “When should I stop using battery?” Cut-off Voltage:- The cut-off voltage is the minimum voltage of a battery below which it should not be used. Say for a lithium cell with 3.7V its cut-off voltage will be somewhere around 3.0V. This means that under no circumstances this battery should be connected to load when its voltage goes below 3.0V. The value of cut- off voltage of a battery can be found in its datasheet. If a battery is discharged below this cut-off voltage it is called as over discharging. This will damage the battery affecting its capacity and lifespan. Over discharging a battery will disturb the chemistry of a battery which might lead to smoking or fuming of batteries.
  • 16.
    “When should Icharge a battery?” Max. Charge Voltage: - While cut-off voltage is the minimum voltage of a battery, Max. Charge voltage is the maximum voltage that a battery can reach. When we charge a battery its voltage gets increased, the value of voltage at which we should stop charging is called as the max. Charge voltage for a lithium cell with 3.7V nominal voltage the maximum charge voltage will be 4.2V. This value can also be found in the datasheet. If a battery is charged more than this maximum charge voltage then it is called as overcharging. Overcharging will also damage the battery permanently and might also lead to fire hazards. Open Circuit Voltage (OCV): Open circuit voltage is the value of voltage measured across the positive and negative terminal of a battery in no load condition. The OCV of a lithium battery should always be between 3.0V to 4.2V for a healthy battery. The Cut-off voltage and max. Discharge voltage is measured during the open circuit condition. Terminal Voltage: The terminal Voltage is the value of voltage measured across the battery in loaded condition. The value of OCV and Terminal voltage will not be equal, because when a load is connected and current is drawn form a battery its voltage tends to decrease based on the amount of current drawn. Summary of equations 1. Coulombic Efficiency (ηC in %): The Coulombic efficiency is the ratio between the discharge and charge capacity. The efficiency of a battery is not always constant and it depends on the SOC, cell temperature, lifetime and current. If Ich(t) and Idisch(t) are the charging and discharging currents. ηC = 100( ∫Idisch(t)dt)/ ∫Ich(t)dt. 2. Energy Efficiency (ηE in %): The energy efficiency is the ratio between the discharge and charge energy. If Ich(t), Vch(t) and Idisch(t) , Vdisch(t) are the charging and discharging currents and voltages as a function of time, respectively, ηE = 100 * (∫Idisch(t)Vdisch(t)dt)/( ∫Ich(t)Vch(t)dt) ηE = 100 * Edisch/Ech , where Ech and Edisch are the energy delivered to the battery during charging and energy extracted from the battery during discharging, respectively.
  • 17.
    3. Charge/Discharge rate(C-rate): It is the ratio of the magnitude of current drawn/fed to the battery, to the nominal ampere-hour of the battery. C-rate = (Ich/Qnom) 4. Nominal power (Pnom, in W) : It is rated power of the battery for charging or discharging derived as a product of the nominal voltage and current of the battery. Pnom = InomVnom 5. Energy density or specific energy (Wh/L or Wh/kg): It is the capacity of the battery per unit volume or unit weight. 6. Ampere-hour (Qnom, in Ah): An ampere hour is a unit of electric charge that corresponds to the charge transferred by a steady current of one ampere flowing for one hour, or 3600 coulombs. The commonly seen milliampere hour (mAh) is one-thousandth of an ampere hour (3.6 coulombs). Enom = QnomVnom 7. State of charge, SOC (BSOC, in %): The battery state of charge (SoC) is defined as the ratio between the amount of energy currently stored in the battery, Ebatt and the total battery capacity, Enom. BSOC = (Ebatt / Enom)100 8. Coulombic Efficiency (ηC in %): The Coulombic efficiency is the ratio between the discharge and charge capacity. The efficiency of a battery is not always constant and it depends on the SOC, cell temperature, lifetime and current. If Ich(t) and Idisch(t) are the charging and discharging currents. ηC = 100( ∫Idisch(t)dt)/ ∫Ich(t)dt. 9. Energy Efficiency (ηE in %): The energy efficiency is the ratio between the discharge and charge energy. If Ich(t), Vch(t) and Idisch(t) , Vdisch(t) are the charging and discharging currents and voltages as a function of time, respectively, ηE = 100 * (∫Idisch(t)Vdisch(t)dt)/( ∫Ich(t)Vch(t)dt) ηE = 100 * Edisch/Ech , where Ech and Edisch are the energy delivered to the battery during charging and energy extracted from the battery during discharging, respectively. 10. Charge/Discharge rate (C-rate): It is the ratio of the magnitude of current drawn/fed to the battery, to the nominal ampere-hour of the battery. C-rate = (Ich/Qnom) . Hybrid energy storage One method of achieving electrical energy storage with a high specific power is to use ultracapacitors (UC). The use of UC’s alone would not suffice, as these components display poor specific energy characteristics. The ideal solution is to use a hybrid energy storage method in a parallel configuration as shown in the figure. This type of set up combines the high specific power density of UC’s with the higher specific energy of an electrochemical battery.
  • 18.
    Range testing Although carmanufacturers often advertise both the range of the EV and its battery capacity (in kWh), consumers tend to be mostly concerned with the range. To standardize the advertised range of an EV, both the EU and the US have developed their own method of determining the 'real world' range of an EV. In the United States, the governmental Environmental Protection Agency (EPA) is in charge of fuel economy tests. The last major update to its techniques was in 2008, and in 2017 there has been an update for cars from that year onward. The test goes through five cycles emulating 'average driving': city, highway, high speed, A/C, cold temperature. In a laboratory, the car is placed on a dynamometer, which is a sort of treadmill for cars. Through adopting the rotational resistance of the rollers, the influence of wind can be emulated. Battery lifetime Predicting the aging effects of individual battery cells, and therefore battery lifetime, is a complex task, but crucial if the reliability and usability of EV’s is to be improved. According to Troltsch etal, the main aging mechanism is the growth of a surface film, also known as the solid electrolyte interface (SEI), on the negative electrode. Other physical effects occur over time, which affect the conductivity of the electrolyte and hence increase the internal resistance. The net effect is a decrease in battery capacity over time. The lifetime of the battery is the time whereby the battery capacity is above a minimum accepted capacity. As described in Handbook of Batteries2, this lifetime depends on the depth of discharge (DOD), the number of cycles and the age. State of Health The state of health (SOH) of a battery system is a term used to describe the energy content of the battery after consideration of aging effects. In terms of EV performance, relating the State of Charge (SOC) to the SOH provides a more accurate indication of the energy remaining in the battery and thus a more accurate fuel gauge to the driver. This concept is explained with reference to the Table below. Assuming an energy usage of 0.2kWh/km and a battery with a capacity of 30kWh, a range of 150km is achieved. However as the battery ages
  • 19.
    and the capacitydecreases, the range decreases. If the battery energy indicator does not consider this aging effects, the EV will have a shorter range than predict. Why do we need a Battery Management System (BMS)? The Lithium-ion batteries have proved to be the battery of interest for Electric Vehicle manufacturers because of its high charge density and low weight. Even though these batteries pack in a lot of punch for its size they are highly unstable in nature. It is very important that these batteries should never be over charged or under discharge at any circumstance which brings in the need to monitor its voltage and current. This process gets a bit tougher since there are a lot of cells put together to form a battery pack in EV and every cell should be individually monitored for its safety and efficient operation which requires a special dedicated system called the Battery Management System. Also to get the maximum efficiency from a battery pack, we should completely charge and discharge all the cells at the same time at the same voltage which again calls in for a BMS. Battery Management system (BMS) Design Considerations:- Accuracy: When a cell is being charged or discharged the voltage across it increases or decreases gradually. Unfortunately the discharge curve (Voltage vs time) of a lithium battery has flat re0gions hence the change in voltage is very less. This change has to be measured accurately to calculate the value of SOC or to use it for cell balancing. A well designed BMS could have accuracy as high as ±0.2mV but it should minimum have an accuracy of 1mV-2mV. Normally a 16-bit ADC is used in the process. Cell Balancing:- Another vital function of a BMS is to maintain cell balancing. For example, in a pack of 4 cells connected in series the voltage of all the four cells should always have equal. If one cell is less or high voltage than the other it will affect the entire pack, say if one cell is at 3.5V while the other three is at 4V. During charging these three cells will attain 4.2V while the other one would have just reached 3.7V similarly this cell will be the first to discharge to 3V before the
  • 20.
    other three. Thisway, because of this single cell all the other cells in the pack cannot be used to its maximum potential thus compromising the efficiency. Charging Control :- Apart from the discharging the charging process should also be monitored by the BMS. Most batteries tend to get damaged or get reduced in lifespan when charged inappropriately. For lithium battery charger a 2-stage charger is used. The first stage is called the Constant Current (CC) during which the charger outputs a constant current to charge the battery. When the battery gets nearly full the second stage called the Constant Voltage (CV) stage is used during which a constant voltage is supplied to the battery at a very low current. The BMS should make sure both the voltage and current during charging does not exceed permeable limits so as to not over charge or fast charge the batteries. The maximum permissible charging voltage and charging current can be found in the datasheet of the battery. Data Logging:- It is important for the BMS to have a large memory bank since it has to store a lot of data. Values like the Sate-of-health SOH can be calculated only if the charging history of the battery is known. So the BMS has to track of the charge cycles and charge time of the battery pack from the date of installation, and interrupt these data when required. This also aids in providing after sales service or analyzing a problem with the EV for the engineers. Discharging Control:- The primary function of a BMS is to maintain the lithium cells within the safe operating region. For example a typical Lithium 18650 cell will have an under voltage rating of around 3V. It is the responsibility of the BMS to make sure that none of the cells in the pack get discharged below 3V. Galvanic Isolation:- The BMS acts as a bridge between the Battery pack and the ECU of the EV. All the information collected by the BMS has to be sent to the ECU to be displayed on the instrument cluster or on the dashboard. So the BMS and the ECU should be continuously communicating most through the standard protocol like CAN communication or LIN bus. The BMS design should be capable of providing a galvanic isolation between the battery pack and the ECU. Less Ideal Power: A BMS should be active and running even if the car is running or charging or in ideal mode. This makes the BMS circuit to be powered continuously and hence it is mandatory that the BMS consumes a very less power so as not to drain the battery much. When a EV is left uncharged for weeks or
  • 21.
    months the BMSand other circuitry tend to drain the battery by themselves and eventually requires to be cranked or charged before next use. This problem still remains common with even popular cars like Tesla. Powered from the Battery itself:- The only power source available in the EV is the battery itself. So a BMS should be designed to be powered by the same battery which it is supposed to protect and maintain. This might sound simple but it does increase the difficulty of the design of the BMS. Processing Speed:- The BMS of an EV has to do a lot of number crunching to calculate the value of SOC, SOH etc. There are many algorithms to do this, and some even uses machine learning to get the task done. This makes the BMS a processing hungry device. Apart from this it also has to measure the cell voltage across hundreds of cells and notice the subtle changes almost immediately. State-of-Charge (SOC) Determination: You can think of SOC as the fuel indicator of the EV. It actually tells us the battery capacity of the pack in percentage. Just like the one in our mobile phone. But it is not as easy as it sounds. The voltage and charge/discharge current of the pack should always be monitored to predict the capacity of the battery. Once the voltage and current is measured there are a lot of algorithms that can be used to calculate the SOC of the Battery pack. The most commonly used method is the coulomb counting method; we will discuss more on this later in the article. Measuring the values and calculating the SOC is also the responsibility of a BMS. State-of-Health (SOC) Determination:- The capacity of the battery not only depends on its voltage and current profile but also on its age and operating temperature. The SOH measurement tells us about the age and expected life cycle of the battery based on its usage history. This way we can know how much the mileage (distance covered after full charge) of the EV reduces as the battery ages and also we can know when the battery pack should be replaced. The SOH should also be calculated and kept in track by the BMS. There are lot of factors that are to be considered while designing a BMS. The complete considerations depend on the exact end application in which the BMS will be used. Apart from EV’s BMS are also used wherever a lithium battery pack is involved such as a solar panel array, windmills, power walls etc. Irrespective of the application a BMS design should consider all or many of the following factors.
  • 22.
    Thermal Control:- Thelife and efficiency of a Lithium battery pack greatly depends on the operating temperature. The battery tends to discharge faster in hot climates compared with normal room temperatures. Adding to this the consumption of high current would further increase the temperature. This calls for a Thermal system (mostly oil) in a battery pack. This thermal system should only be able to decrease the temperature but should also be able to increase the temperature in cold climates if needed. The BMS is responsible for measuring the individual cell temperature and control the thermal system accordingly to maintain the overall temperature of the battery pack. To deal with this problem the BMS has to implement something called cell balancing. There are many types of cell balancing techniques, but the commonly used ones are the active and passive type cell balancing. In passive balancing the idea is that the cells with excess voltage will be forced discharge through a load like resistor to reach the voltage value of the other cells. While in active balancing the stronger cells will be used to charge the weaker cells to equalize their potentials. Powered from the Battery itself: The only power source available in the EV is the battery itself. So a BMS should be designed to be powered by the same battery which it is supposed to protect and maintain. This might sound simple but it does increase the difficulty of the design of the BMS. Less Ideal Power: - A BMS should be active and running even if the car is running or charging or in ideal mode. This makes the BMS circuit to be powered continuously and hence it is mandatory that the BMS consumes a very less power so as not to drain the battery much. When a EV is left uncharged for weeks or months the BMS and other circuitry tend to drain the battery by themselves and eventually requires to be cranked or charged before next use. This problem still remains common with even popular cars like Tesla. Galvanic Isolation: The BMS acts as a bridge between the Battery pack and the ECU of the EV. All the information collected by the BMS has to be sent to the ECU to be displayed on the instrument cluster or on the dashboard. So the BMS and the ECU should be continuously communicating most through the standard protocol like CAN communication or LIN bus. The BMS design should be capable of providing a galvanic isolation between the battery pack and the ECU.
  • 23.
    Data Logging: Itis important for the BMS to have a large memory bank since it has to store a lot of data. Values like the Sate-of-health SOH can be calculated only if the charging history of the battery is known. So the BMS has to track of the charge cycles and charge time of the battery pack from the date of installation, and interrupt these data when required. This also aids in providing after sales service or analyzing a problem with the EV for the engineers. Accuracy: When a cell is being charged or discharged the voltage across it increases or decreases gradually. Unfortunately the discharge curve (Voltage vs time) of a lithium battery has flat regions hence the change in voltage is very less. This change has to be measured accurately to calculate the value of SOC or to use it for cell balancing. A well designed BMS could have accuracy as high as ±0.2mV but it should minimum have an accuracy of 1mV-2mV. Normally a 16-bit ADC is used in the process. Processing Speed: The BMS of an EV has to do a lot of number crunching to calculate the value of SOC, SOH etc. There are many algorithms to do this, and some even uses machine learning to get the task done. This makes the BMS a processing hungry device. Apart from this it also has to measure the cell voltage across hundreds of cells and notice the subtle changes almost immediately. Battery state Estimation The major computational power of a BMS is dedicated to estimate the Battery state. This includes the measurement of SOC and SOH. SOC can be calculated using the cell voltage, current, charging profile and discharging profile. SOH can be calculated by using the number of charge cycle and performance of the battery. “How to measure the SOC of a Battery?” There are many algorithms to measure the SOC of a battery, each having its own input values. The most commonly used method for SOC is called the Coulomb Counting a.k.a book keeping method. We will discuss more on that later. Apart from that there are many other advanced and more sophisticated algorithms that are listed below.
  • 24.
    Basic Methods Coulomb Countingmethod Ampere-hour (Ah) method Open-Circuit Voltage (OCV) method Impedance / IR Measurement Method Machine Learning Based Algorithms Neural Network Fuzzy Logic Support Vector Machine Advanced Method State-Space Model Estimation using Kalman Filter BMS – Thermal Management Apart from measuring the voltage, current and temperature and calculating SOC, SOH etc the BMS has another important task of regulating the battery temperature. A battery pack would drain faster if operated in higher or lower temperatures. To prevent this cooling systems are used in the battery. The Tesla for example uses liquid cooling where a tube is passed through the battery pack to get in contact with all the cells. A coolant like water or Glycol is then passed through the tubes. The temperature of the coolant is controlled by the BMS based on the cell temperatures. Apart from this the batteries also use air or chemicals to maintain the required temperature. With this let us conclude the article here, there are still lots to know about BMS and how they work. Today many silicon companies like Renesas, Texas Instruments etc. have their own series of BMS IC’s and Tool kits which could do the hardware pulling for you and you can use it without diving deep into all this. With every new EV in the market the BMS evolves to get much smarter and easy to use.
  • 25.
    Wireless Electric VehicleCharging System Based on the application, Wireless charging systems for EV can be distinguished into two categories, 1. Static Wireless Charging 2. Dynamic Wireless Charging 1. Static Wireless Charging As the name indicates, the vehicle gets charged when it remains static. So here we could simply park the EV at the parking spot or in garage which is incorporated with WCS. Transmitter is fitted underneath the ground and receiver is arranged in vehicle’s underneath. To charge the vehicle align the transmitter and receiver and leave it for charging. The charging time depends on the AC supply power level, distance between the transmitter & receiver and their pad sizes. This SWCS is best to build in areas where EV is being parked for a certain time interval.
  • 26.
    Static Wireless ChargingSystem 2.Dynamic Wireless Charging System (DWCS): As the name indicates here vehicle get charged while in motion. The power transfers over the air from a stationary transmitter to the receiver coil in a moving vehicle. By using DWCS EV's travelling range could be improved with the continuous charging of its battery while driving on roadways and highways. It reduces the need for large energy storage which further reduce the weight of the vehicle.
  • 27.
    Types of EVWCS Basedon operating Techniques EVWCS can be classified into four types Capacitive Wireless Charging System (CWCS) Permanent Magnetic Gear Wireless Charging System (PMWC) Inductive Wireless Charging System (IWC) Resonant Inductive Wireless Charging System (RIWC) 1. Capacitive Wireless Charging System (CWCS) Wireless transfer of energy between transmitter and receiver is accomplished by means of displacement current caused by the variation of electric field. Instead of magnets or coils as transmitter and receiver, coupling capacitors are used here for wireless transmission of power. The AC voltage first supplied to power factor correction circuit to improve efficiency and to maintain the voltage levels and to reduce the losses while transmitting the power. Then it is supplied to an H-bridge for the High-frequency AC voltage generation and this high frequency AC is applied to transmitting plate which causes the development of oscillating electric field that causes displacement current at receiver plate by means of electro static induction.
  • 28.
    The AC Voltageat receiver side is converted to DC to feed the battery through BMS by rectifier and filter circuits. Frequency, voltage, size of coupling capacitors and air-gap between transmitter and receiver affects the amount of power transferred. It’s operating frequency is between 100 to 600 KHz. 2. Permanent Magnet Gear Wireless Charging System (PMWC) Here transmitter and receiver each consist of armature winding and synchronized permanent magnets inside the winding. At transmitter side operation is similar to motor operation. When we apply the AC current to transmitter winding it induces mechanical torque on transmitter magnet causes it's rotation. Due to the magnetic interaction change in transmitter, PM field causes torque on receiver PM which results it's rotation in synchronous with transmitter magnet. Now change in receiver permanent magnetic field causes the AC current production in winding i.e, receiver acts as generator as mechanical power input to the receiver PM converted into electrical output at receiver winding. The coupling of rotating permanent magnets is referred as magnetic gear. The generated AC power at receiver side fed to the battery after rectifying and filtering through power converters. 3. Inductive Wireless Charging System (IWC) The basic principle of IWC is Faraday's law of induction. Here wireless transmission of power is achieved by mutual induction of magnetic field between transmitter and receiver coil. When the main AC supply applied to the transmitter coil, it creates AC magnetic field that passes through receiver coil and this magnetic field moves electrons in receiver coil causes AC power output. This AC output is rectified and filtered to Charge the EV’s energy storage system. The amount of power transferred depends on frequency, mutual inductance and distance between transmitter and receiver coil. Operating frequency of IWC is between 19 to 50 KHz. 4. Resonant Inductive Wireless Charging System (RIWC) Basically resonators having high Quality factor transmit energy at much higher rate, so by operating at resonance, even with weaker magnetic fields we can transmit the same amount of power as in IWC. The power can be transferred to long distances without wires. Max transfer of power over the air happens when the transmitter and receiver coils are tuned i.e., both coils resonant frequencies
  • 29.
    should be matched.So to get good resonant frequencies, additional compensation networks in the series and parallel combinations are added to the transmitter and receiver coils. This additional compensation networks along with improvement in resonant frequency also reduces the additional losses. Operating frequency of RIWC is between 10 to 150 KHz. What are the reasons for battery degradation? It is difficult to point one particular reason for Battery Degradation, it can be caused by multiple factors. Operating and storage conditions like Overcharging, Deep discharging, charging with a high C rate, storing with full SOC, operating and storing in high temperature are the major causes that affect the battery health and leads to battery degradation. Internal chemical reactions like Damage of the Crystalline Structure of anode, formation of SEI layer and corrosion also cause battery degradation. Effect of Overcharging and Deep Discharging EV Batteries: Charging the battery to its maximum level and deep discharging it, may give long- range but it stresses the battery. During charging and discharging as the anode material absorbs and releases the lithium material, it’s volume will vary. Over the cycling, these volume variations weaken the crystalline structured anode. During the deep discharge of batteries, the variation of volume will be more which causes micro-cracks on the anode. This exposes the new parts of anode particles to electrolytes which results in the formation of SEI, in turn, SEI increases the internal resistance of the battery and consumes some amount of lithium for its formation resulting in irreversible capacity loss of the battery. Effect of Temperature on Electric Vehicle Battery: Basically for lithium-ion batteries optimal temperature range is between 15 °C– 35 °C. Operating out of this comfortable range will accelerate the degradation of the battery. At low temperature ionic conductivity of the electrolyte and lithium- ion diffusivity at electrodes will decrease. It takes more time to Charge the batteries in low temperatures due to the slow down of lithium-ion intercalation into the anodes. This will lead to the deposition of lithium ions on the electrode surface and causes the battery degradation. Operating at high temperature shortens the lifetime of lithium-ion batteries. High temperature enhances the decomposition of conductive salt (lithium
  • 30.
    Hexafluorophosphate) in electrolytes.And also increases the inorganic compounds at the SEI layers. This increases the internal impedance of batteries which further increases the internal temperature batteries. If such heat left uncontrolled it not only causes battery degradation but also causes Thermal runaway. Another reason for battery degradation is corrosion. The presence of any trace of water in manufacturing the battery leads to corrosion. LiPF6, the Most commonly used lithium salt in the electrolyte is reactive to water and forms hydro fluoric acid. This hydro fluoric acid is corrosive to metallic collector causes battery degradation. Basic DC-DC converter The DC-DC converters illustrated in the figure above is used to interface two DC systems and control the flow of power between them. Their basic function in a DC environment is similar to that of transformers in AC systems. Unlike transformers, the ratio of the input to the output, either voltage or current, can continuously be varied by the control signal and this ratio can be higher or lower than unity. The DC-DC converters are constructed of electronic switches and sometimes include inductive and capacitive components, all of which are normally followed by a low- pass filter.
  • 31.
    Depending upon thedirection of the output current and voltage, the converters can be classified into five classes as shown in the figure. One-quadrant (classes A and B), two-quadrant (classes C and D) and four-quadrant operation can be realized. Bidirectional power flow (2 quadrant converter) is required in automotive applications. Let us assume that voltage Vin is the voltage of the DC link (500 V) and voltage Vout is voltage of the battery (200V). The battery has to be charged during slowing down (decelerating) the vehicle and discharged during driving and accelerating (speeding up). Both voltages do not change their polarity. What is changing polarity is the current. We need a converter working as a class C (Figure). Now that you have an understanding of how the simple DC-DC buck converter works, we summarize the main equations for the converter here. These equations are for continuous conduction mode, where the current always flows through the inductor. Discontinuous conduction mode is out of the scope of this course. You can find the equations on the next page. Key equations for a buck converter. V0 = DVin T = 1/f D = Ton/(T) T = Ton + Toff Where V0 is the output voltage D is the duty cycle of the switch
  • 32.
    Vin is theinput voltage f is the switching frequency of the semiconductor switch T is the time period of the semiconductor switch Ton is the ON time of the semiconductor switch Toff is the OFF time of the semiconductor Key equations for a boost converter V0 = Vin/(1-D) T = 1/f D = Ton/(T) T = Ton + Toff where V0 is the output voltage D is the duty cycle of the switch Vin is the input voltage f is the switching frequency of the semiconductor switch T is the time period of the semiconductor switch Ton is the ON time of the semiconductor switch Toff is the OFF time of the semiconductor switch. DC-DC converter: driving and regenerative breaking. In a battery-powered electric vehicle, regenerative braking (also called regenerative breaking) is the conversion of the vehicle’s kinetic energy into chemical energy stored in the battery, where it can be used later to drive the vehicle. It is braking because it also serves to slow the vehicle. It is regenerative because the energy is recaptured in the battery where it can be used again. A torque command is derived from the position of the throttle pedal. The motor controller converts this torque command into the appropriate 3-phase voltage and current waveforms to produce the commanded torque in the motor in the
  • 33.
    most efficient way.The torque command can be positive or negative. When the torque serves to slow the vehicle then energy is returned to the battery and presto - we have regenerative braking! So a good proportion of the energy you lose by braking is returned to the batteries and can be reused when you start off again as shown in Figure 1. In practice, regenerative brakes take time to slow cars down ands have power limitations based on the rated power of the motor, power electronics and battery. So, most vehicles that use them also have ordinary (friction) brakes working alongside. That's one reason why regenerative brakes doesn't save 100% of our braking energy. In case of driving the vehicle forward, the opposite occurs and energy from the battery is used by the battery converter and motor drive to power the motor with a positive torque command. Power converters From a power conversion perspective, generators used in wind turbines typically produce variable frequency AC power. Two back to back AC-to-DC and DC-to-AC power converters are used to convert the variable frequency AC power to high voltage or medium voltage 50Hz or 60Hz AC power used for long distance power transmission. This power is then stepped down to low voltage AC power, and the EV can then be charged using AC or DC charging. The simplest way to realize a solar powered EV charging station is to use a solar inverter. A DC- to-DC power converter operates the solar panels at the maximum power point. Then, a DC-AC inverter converts the DC power to 50Hz or 60Hz AC power for AC charging of the EV. There is, however, one disadvantage with this method. Photovoltaic panels and the EV battery are both fundamentally direct current or DC by nature. And in this method, the DC power is unnecessarily converted to AC and back. Hence, a more efficient way to charge EV from PV is to use an isolated DC-to-DC converter and directly charge the EV from PV using DC charging as shown in the fiqure.
  • 34.
    There are threepower converters, a DC-to-DC converter for the solar panels, a DC-DC isolated converter for the electric car and a DC-to-AC inverter to connect to the AC grid. Using this design, direct DC charging of EV from PV can be realized. Secondly, if there is no electric car, then the system acts as a solar inverter and feeds PV power to the grid. Third, if there is no solar power, the system operates as a conventional DC charger and charges the EV from the grid. Finally, the charger is bidirectional and capable of vehicle-to-grid. So the EV can not only charge from the grid, it can feed power back to the grid as well. The unique aspect of combining solar charging and vehicle-to-grid is that the electric car battery can now be used as a storage for renewable electricity.
  • 35.
    Overcoming variability inrenewable energy generation The main challenge with powering electric cars from renewable energy is the variability in generation. Using a combination of solar and wind A solution to overcome this variation is to size the wind and solar installation such that we are guaranteed of sufficient energy even when the sunshine and wind are minimal. The disadvantage is that this can cause overproduction and wastage of power when the solar insolation and/or wind speeds are maximum. By optimally sizing a PV and wind hybrid system, then the variability in PV generation can be partially balanced by the variability in wind generation resulting in a net system with minimal wastage of power. In the graph, we can see a system with different percentage of total renewable generation (40% to 100%) and which percentage of that is wind or solar generation. It can be seen that the energy wastage increases as more renewables are used to supply the load due to mismatch between renewable generation and load demand. However, the power wastage can be drastically reduced when an optimally combination of both wind and solar generation is used. Future of electric vehicles  World BEV After entering commercial markets in the first half of the decade, electric car sales have soared. Only about 17 000 electric cars were on the world’s roads in 2010. By 2019, that number had swelled to 7.2 million, 47% of which were in The People’s Republic of China (“China”). Nine countries had more than 100 000 electric cars on the road. At least 20 countries reached market shares above 1%. The 2.1 million electric car sales in 2019 represent a 6% growth from the previous year, down from year-on-year sales growth at least above 30% since 2016. Three underlying reasons explain this trend:  Car markets contracted. Total passenger car sales volumes were depressed in 2019 in many key countries. In the 2010s, fast-growing markets such as China and India for all types of vehicles had lower sales in 2019 than in 2018. Against this backdrop of sluggish sales in 2019,the 2.6% market share of electric cars in
  • 36.
    worldwide car salesconstitutes a record. In particular, China (at 4.9%) and Europe (at 3.5%) achieved new records in electric vehicle market share in 2019.  Purchase subsidies were reduced in key markets. China cut electric car purchase subsidies by about half in 2019 (as part of a gradual phase out of direct incentives set out in 2016). The US federal tax credit programme ran out for key electric vehicle automakers such as General Motors and Tesla (the tax credit is applicable up to a 200 000 sales cap per automaker). These actions contributed to a significant drop in electric car sales in China in the second half of 2019, and a 10% drop in the United States over the year. With 90% of global electric car sales concentrated in China, Europe and the United States, this affected global sales and overshadowed the notable 50% sales increase in Europe in 2019, thus slowing the growth trend.  Consumer expectations of further technology improvements and new models. Today’s consumer profile in the electric car market is evolving from early adopters and technophile purchasers to mass adoption. Significant improvements in technology and a wider variety of electric car models on offer have stimulated consumer purchase decisions. The 2018-19 versions of some common electric car models display a battery energy density that is 20-100% higher than were their counterparts in 2012. Further, battery costs have decreased by more than 85% since 2010. The delivery of new mass-market models such as the Tesla Model 3 caused a spike in sales in 2018 in key markets such as the United States. Automakers have announced a diversified menu of electric cars, many of which are expected in 2020 or 2021. For the next five years, automakers have announced plans to release another 200 new electric car models, many of which are in the popular sport utility vehicle market segment. As improvements in technical performance and cost reductions continue, consumers are placed in the position of being attracted to a product but wondering if it would be wise to wait for the “latest and greatest model.