Downloaded 132 times
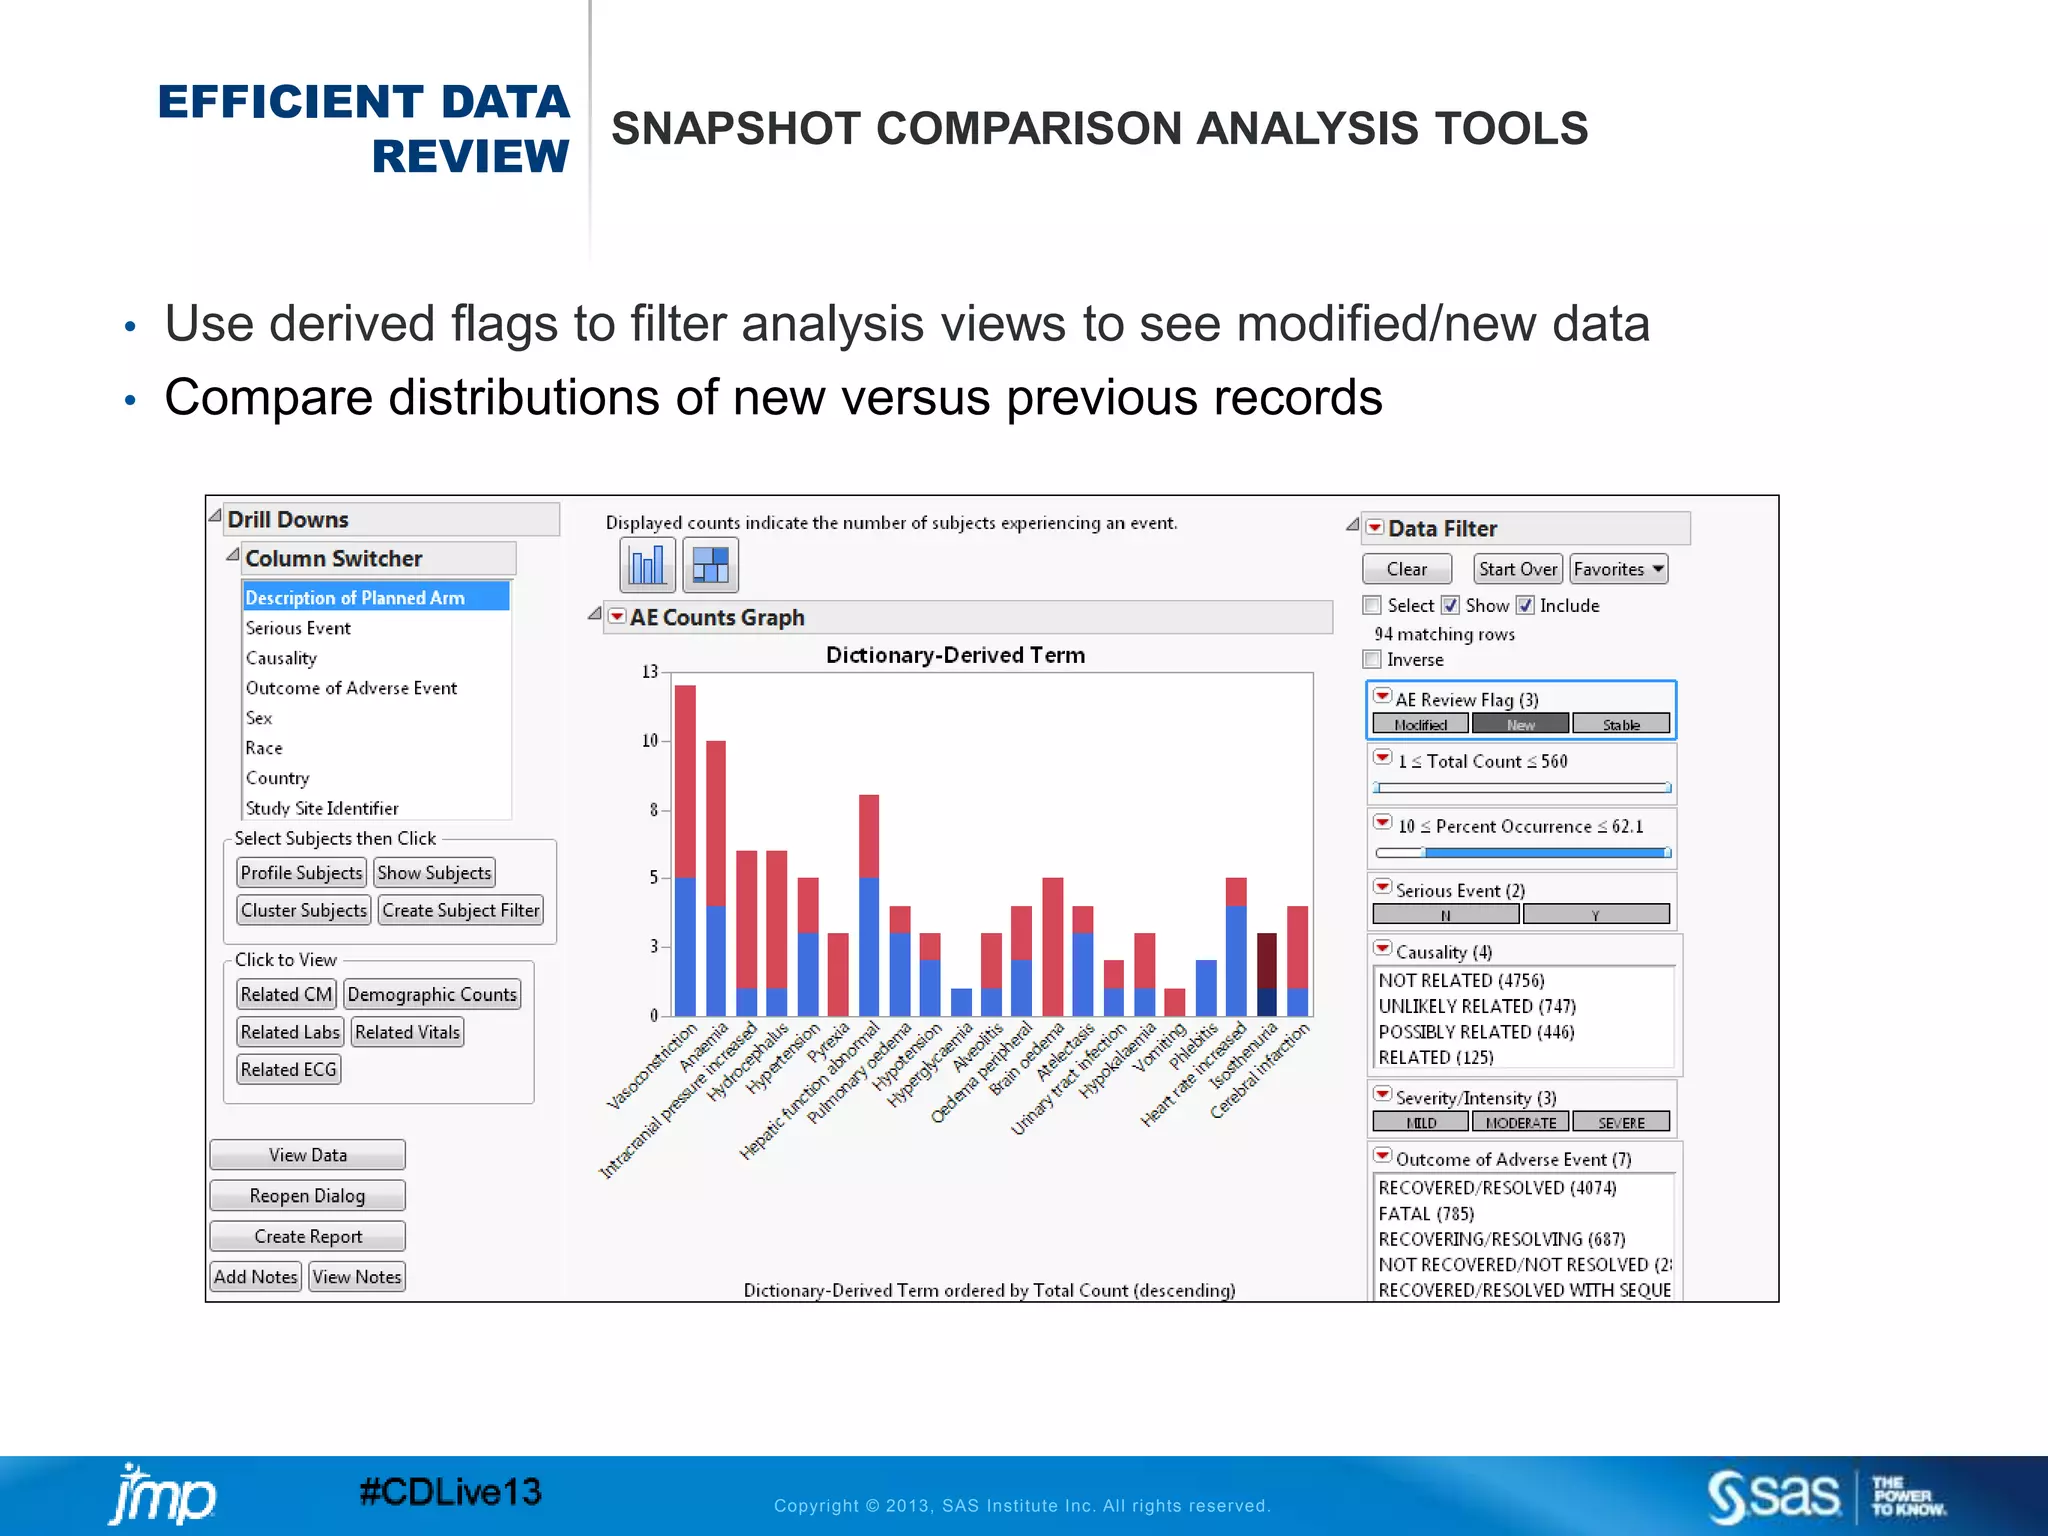

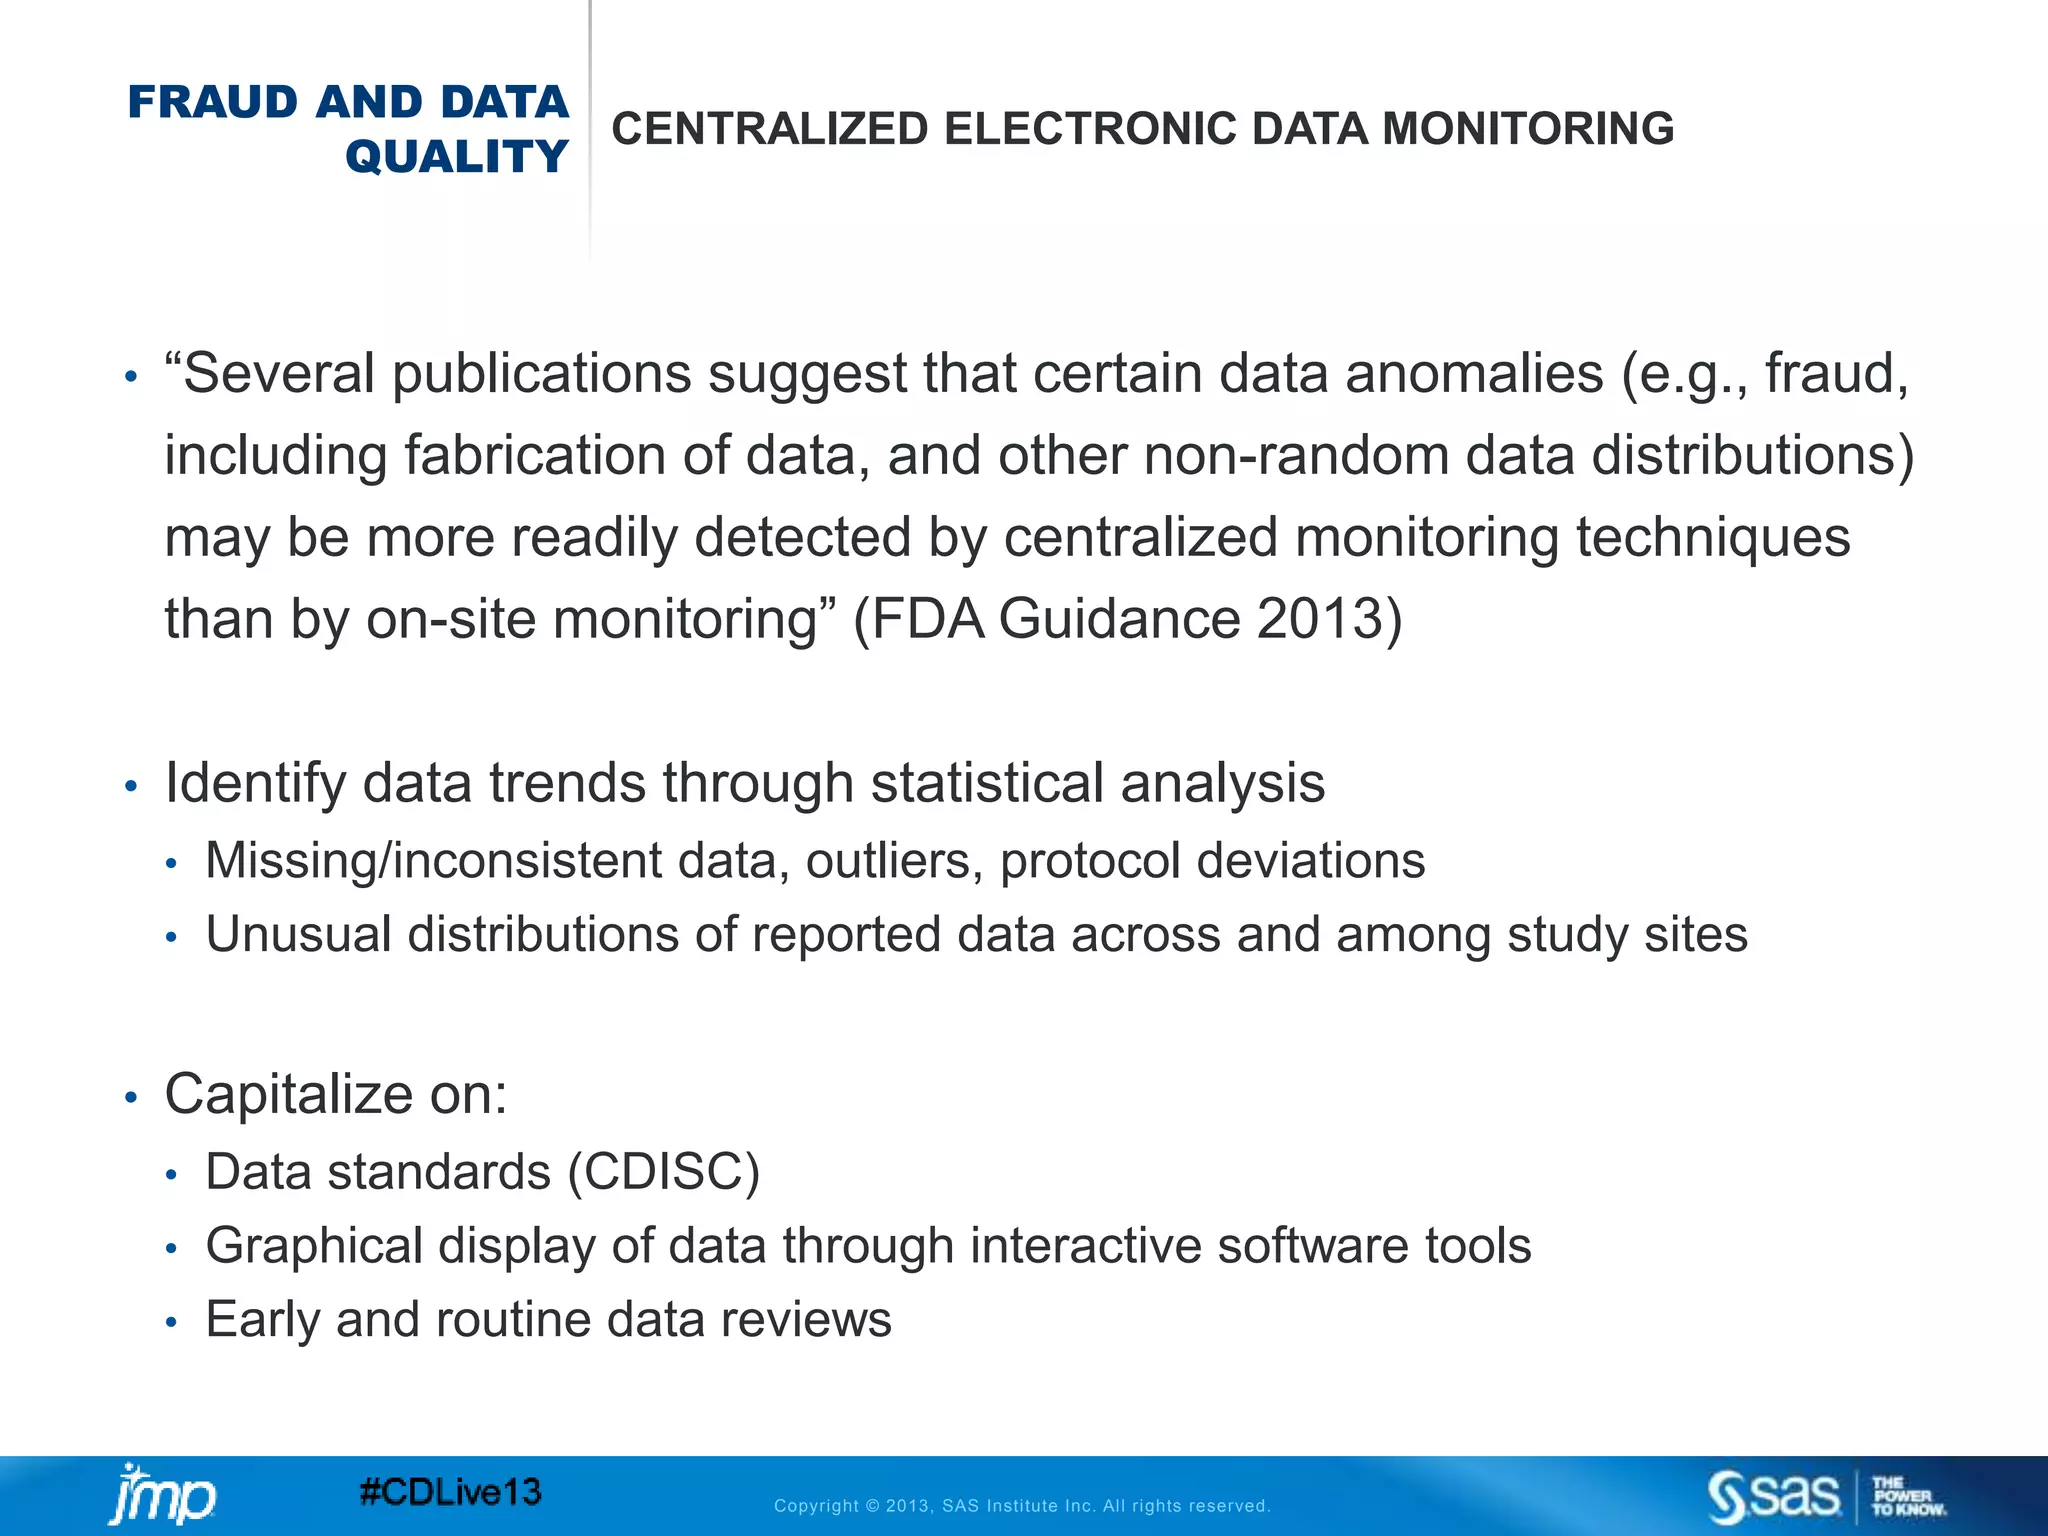
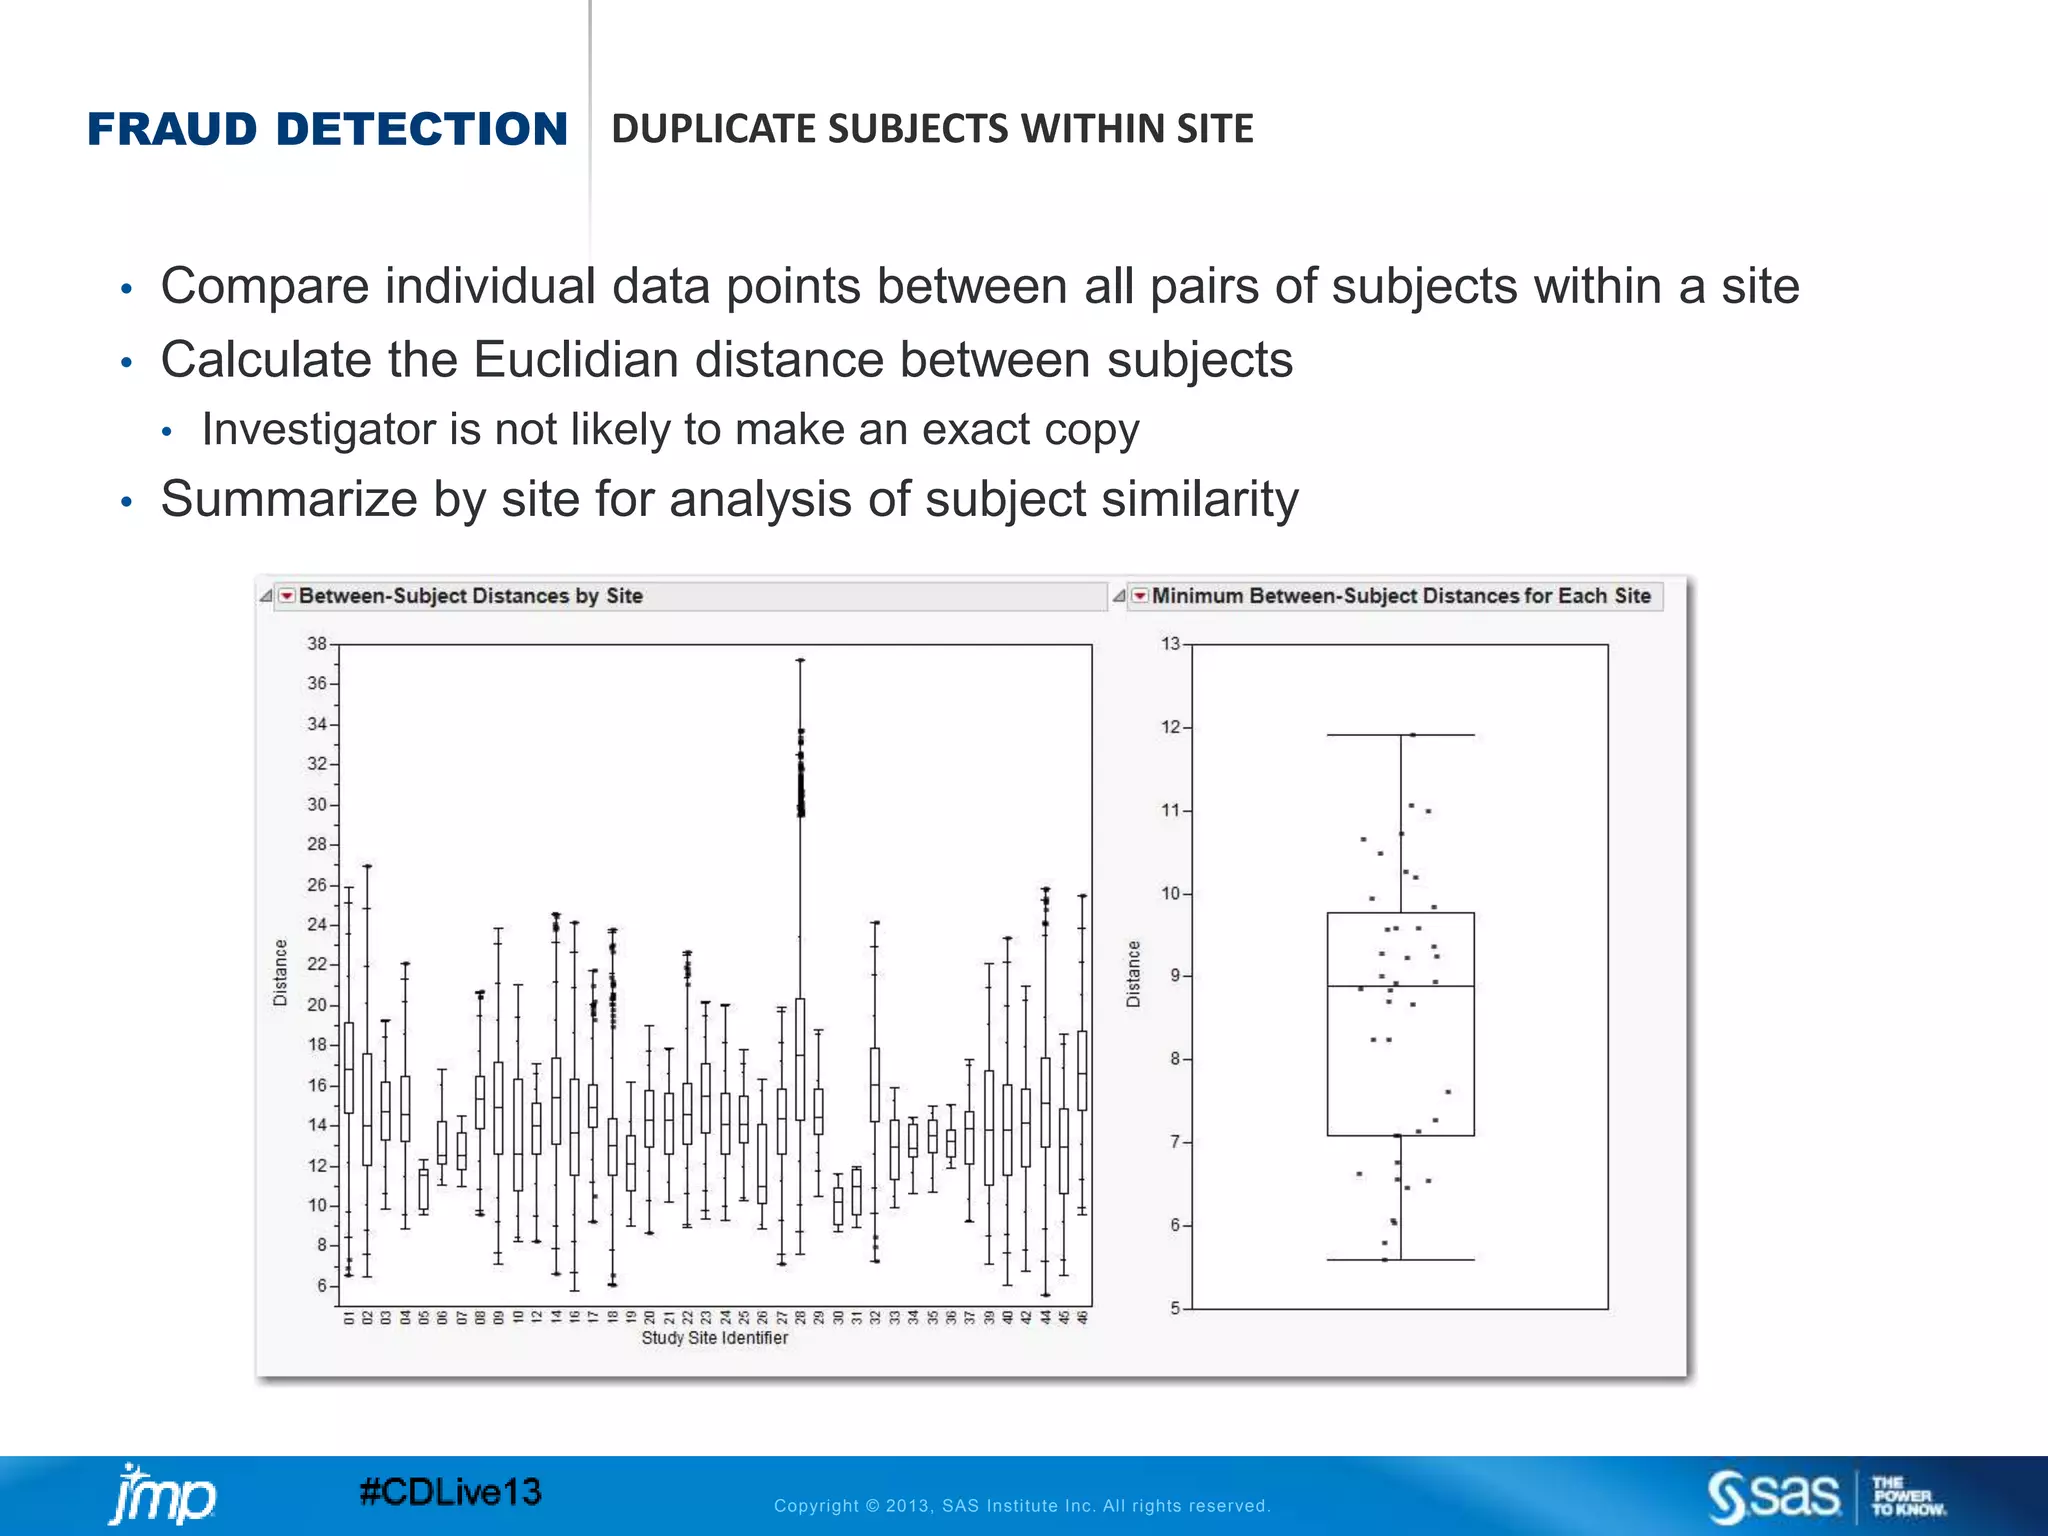
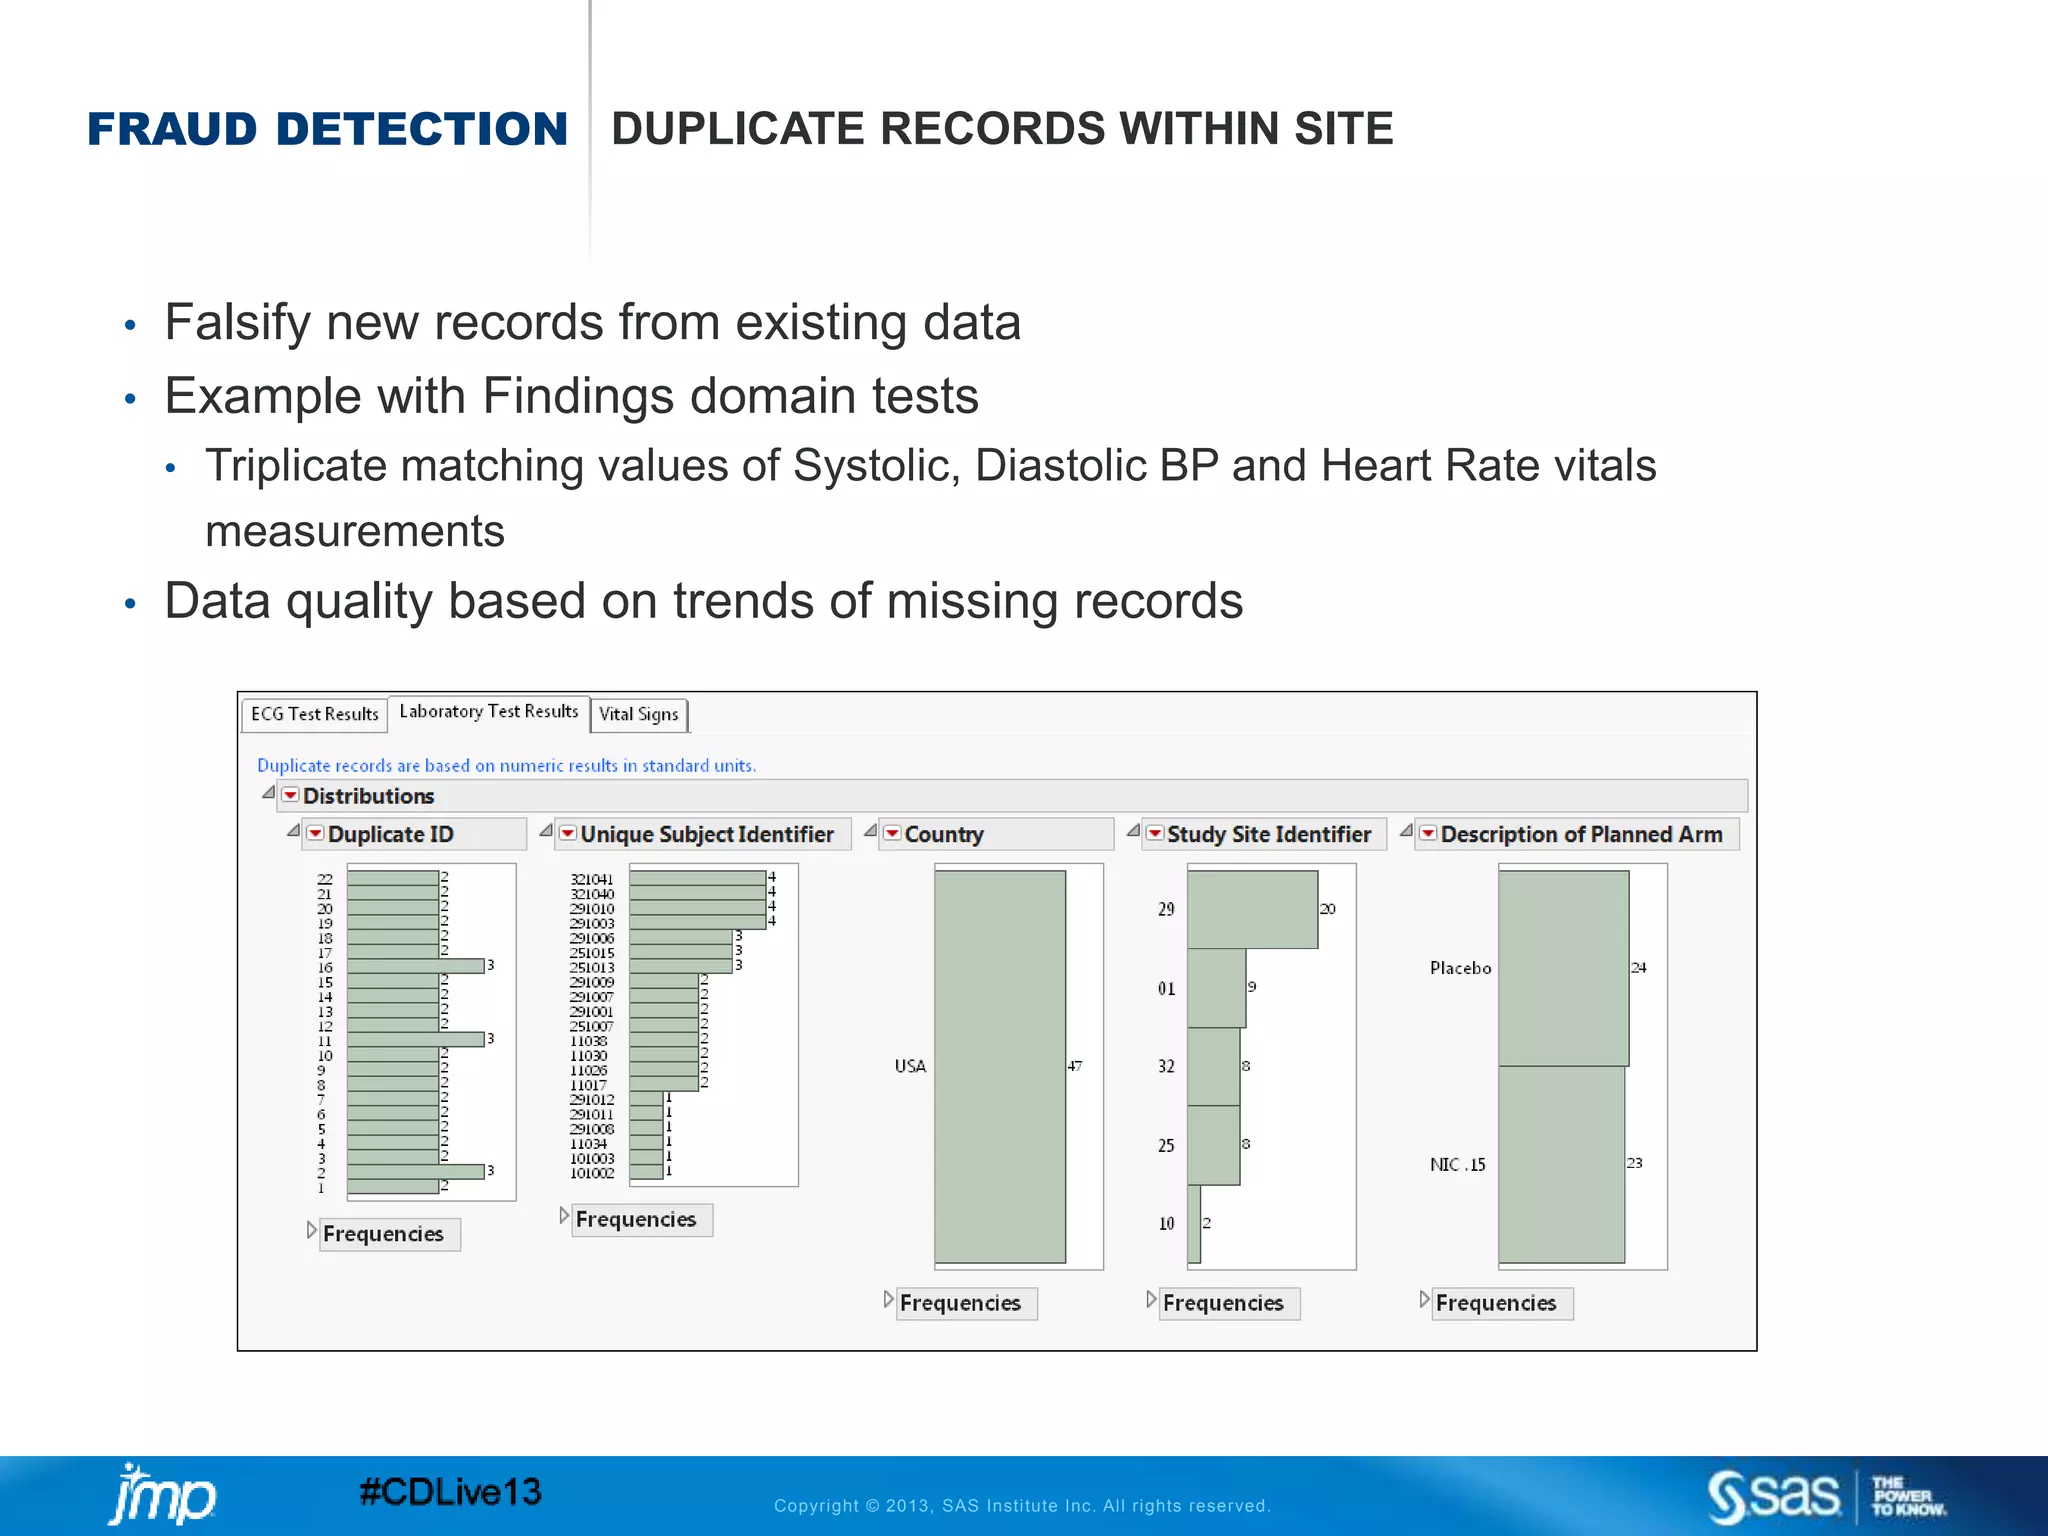
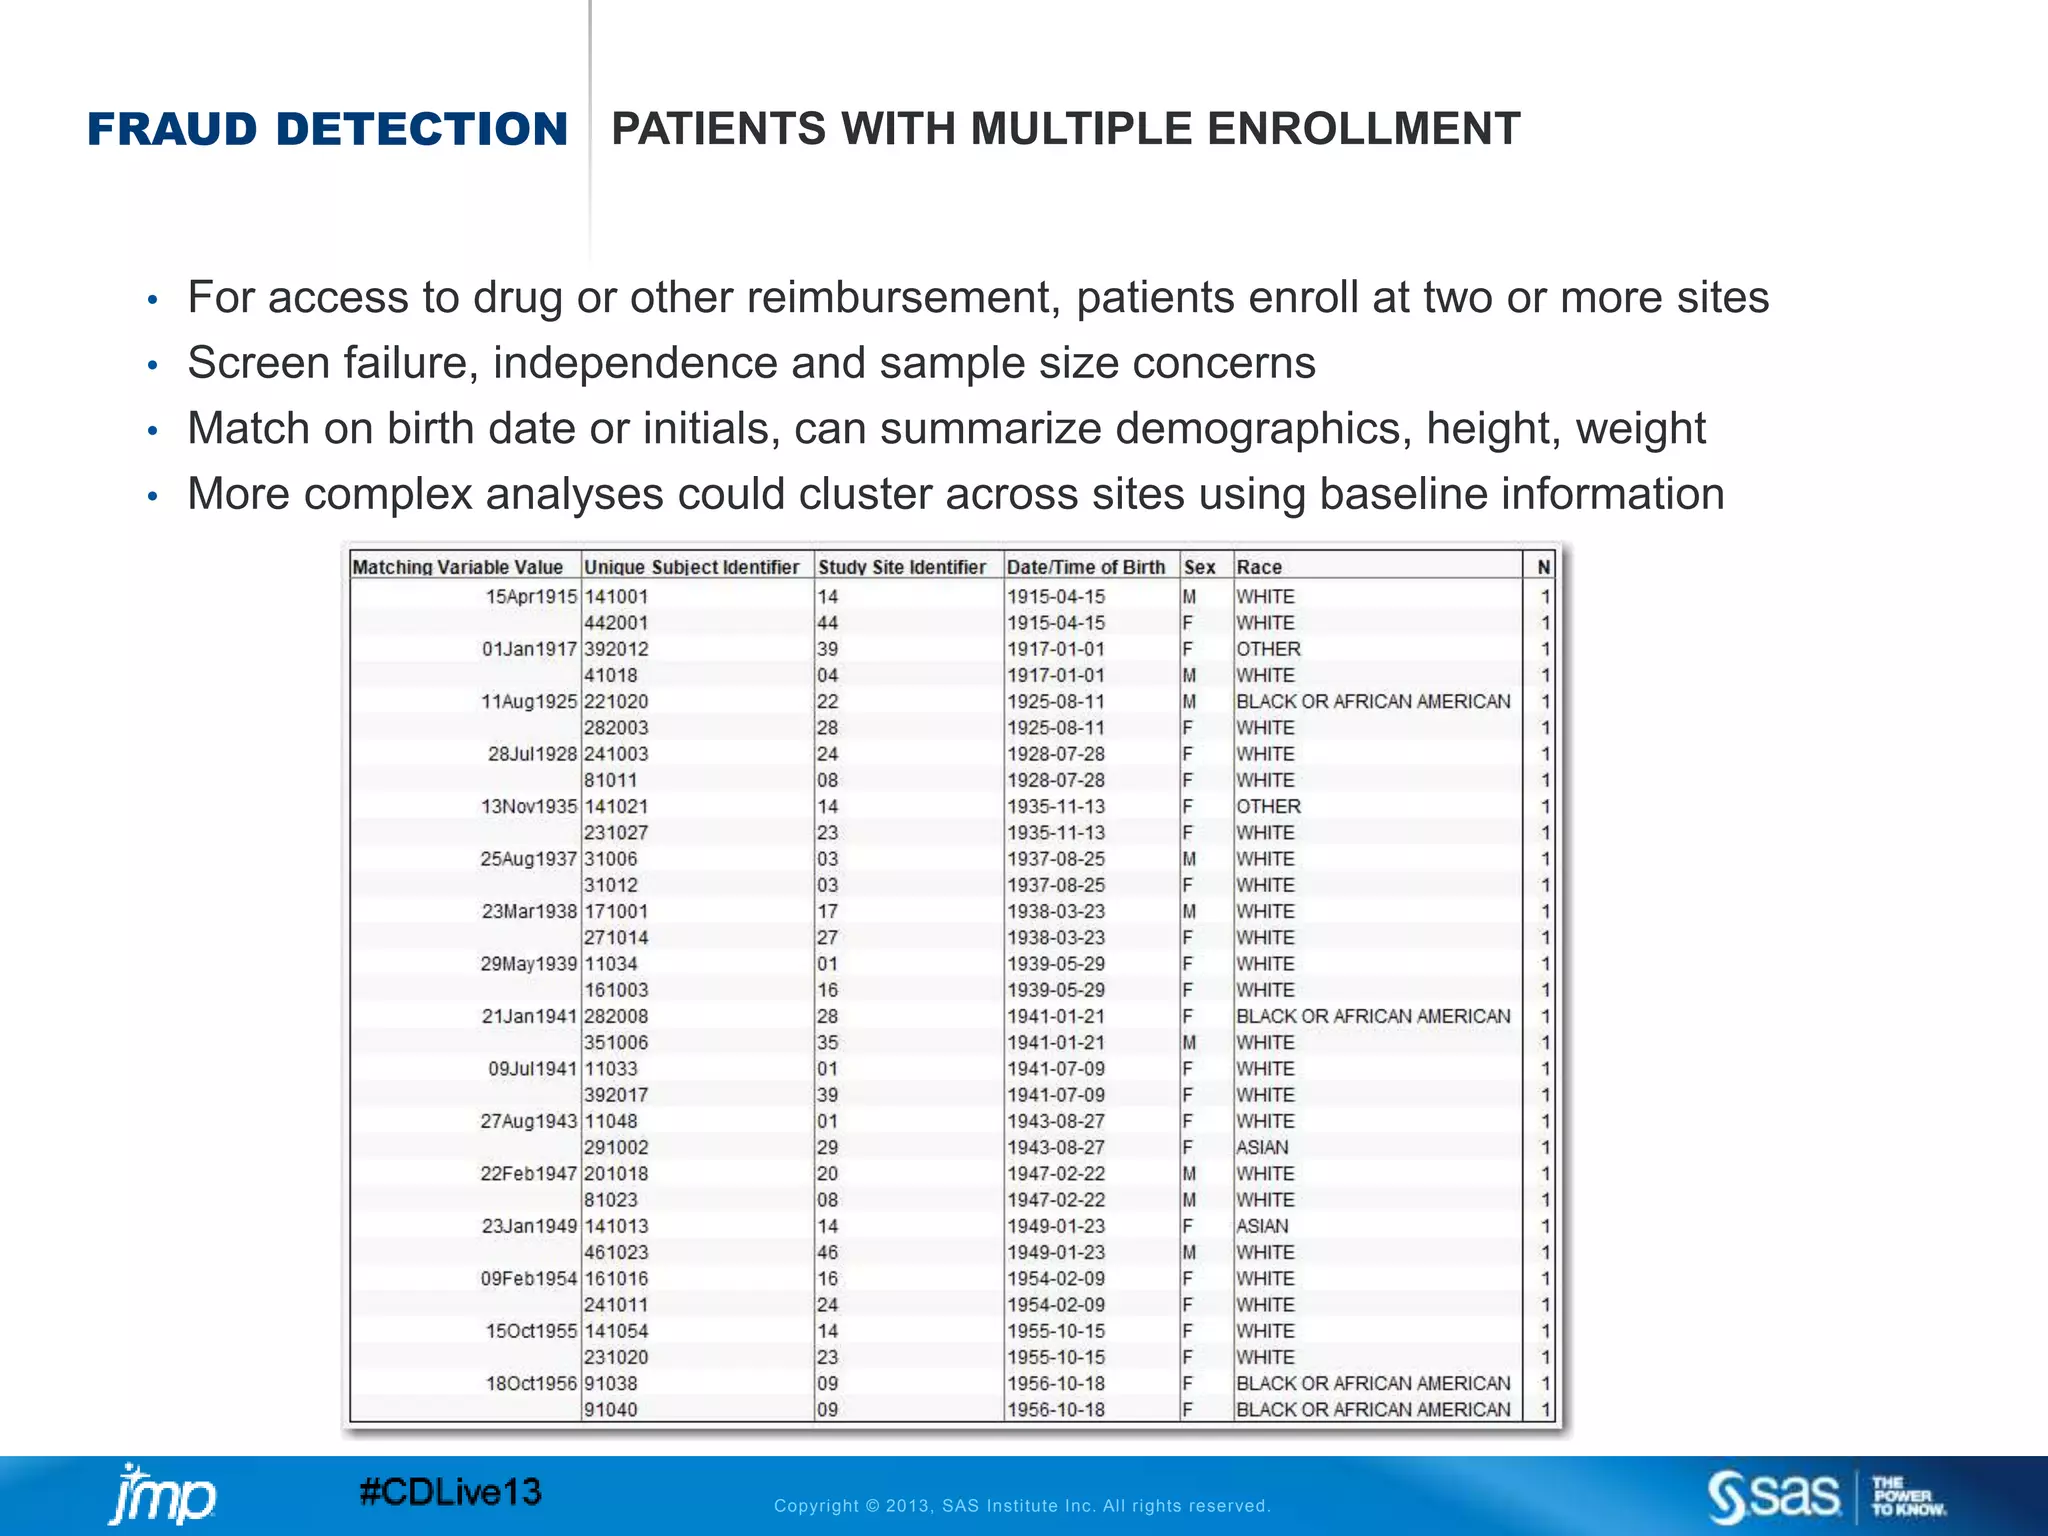
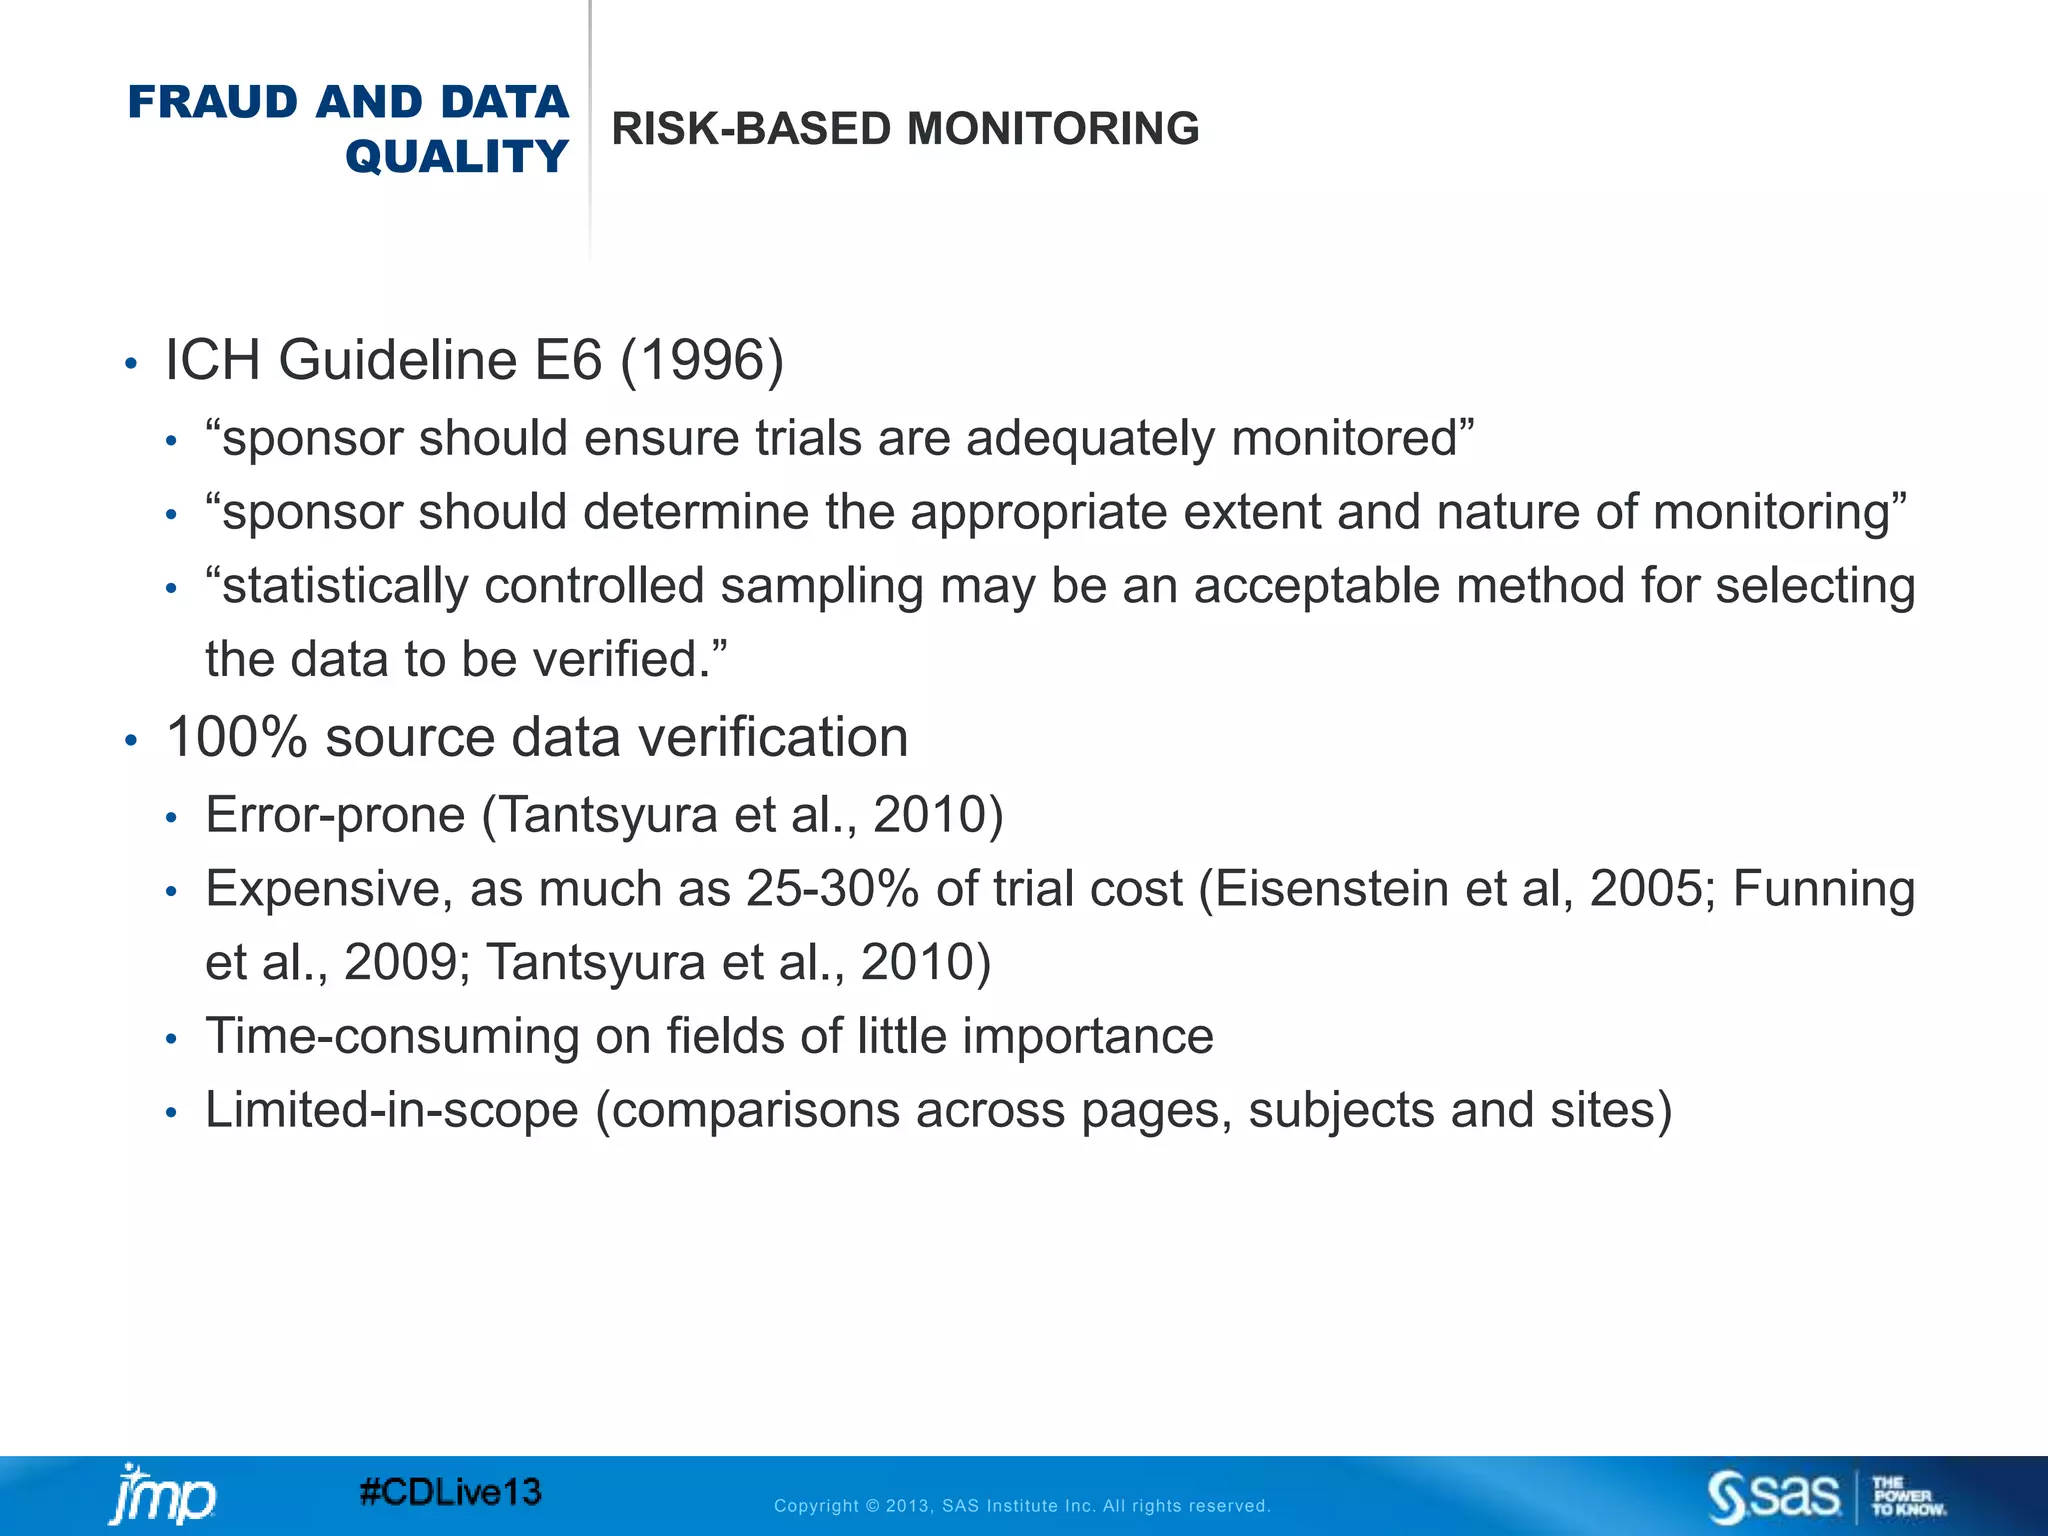
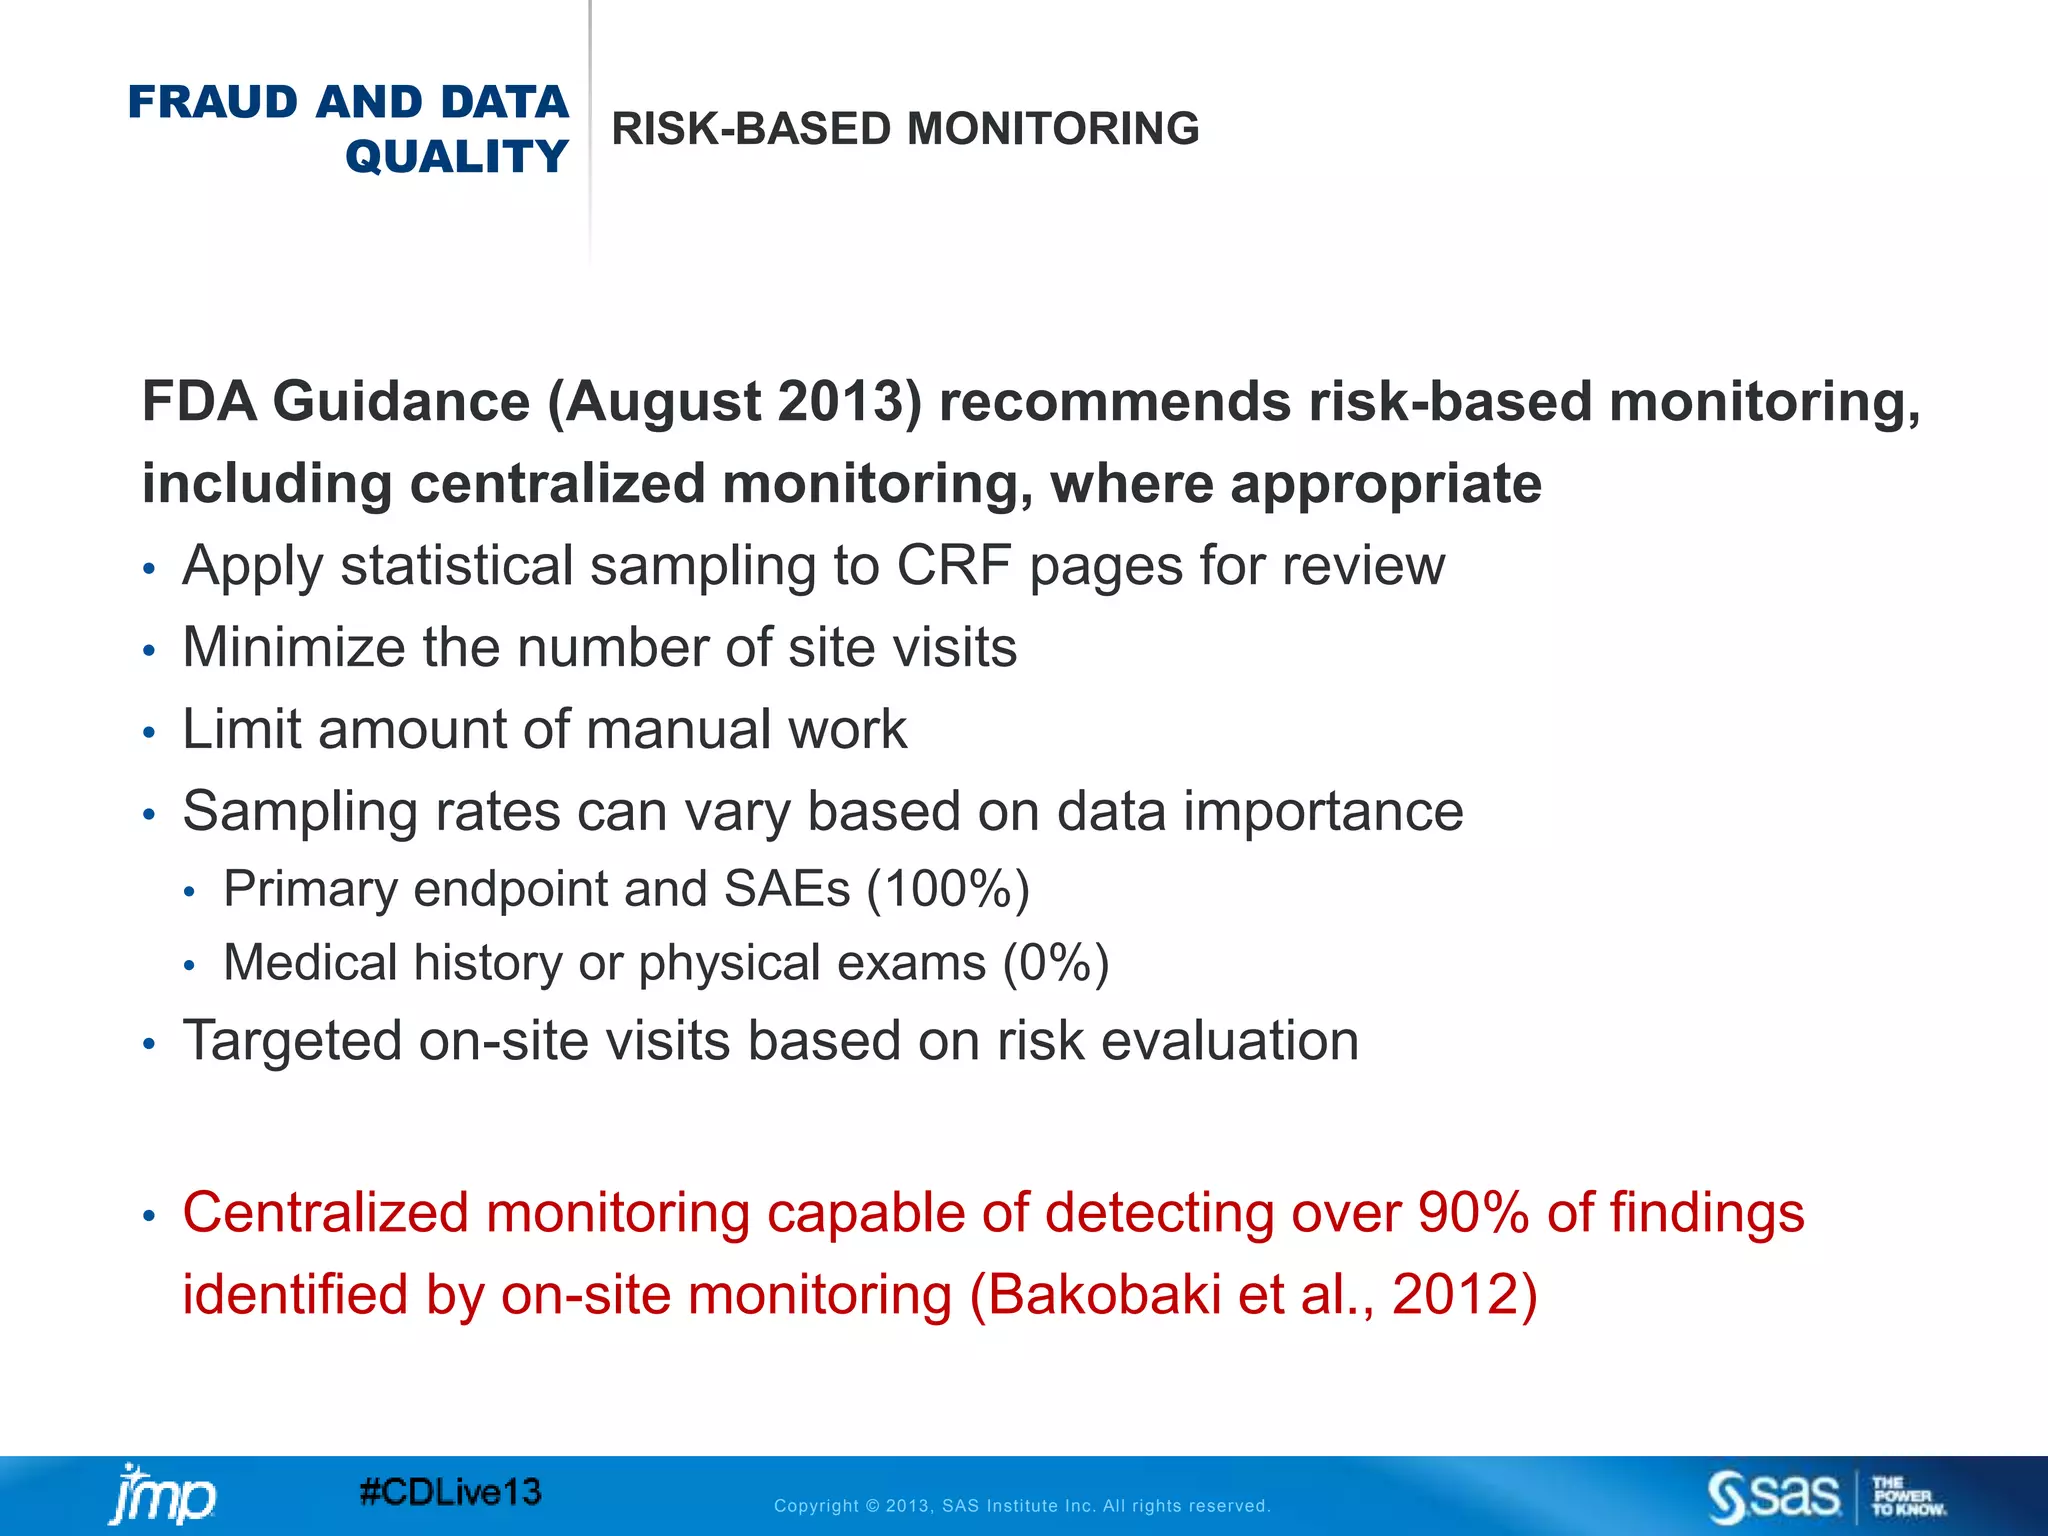

The document discusses efficient data review practices and quality assurance in clinical trials, emphasizing the importance of statistical analysis and data visualization. It outlines issues such as data collection inefficiencies, fraud detection methods, and the significance of centralized electronic monitoring. The use of snapshot comparison tools and risk-based monitoring is highlighted as essential for enhancing data review and ensuring clinical trial integrity.


![Bayesian estimations of strong toxic signals [compatibility mode]](https://cdn.slidesharecdn.com/ss_thumbnails/bayesianestimationsofstrongtoxicsignalscompatibilitymode-120927005019-phpapp02-thumbnail.jpg?width=640&height=640&fit=bounds)


