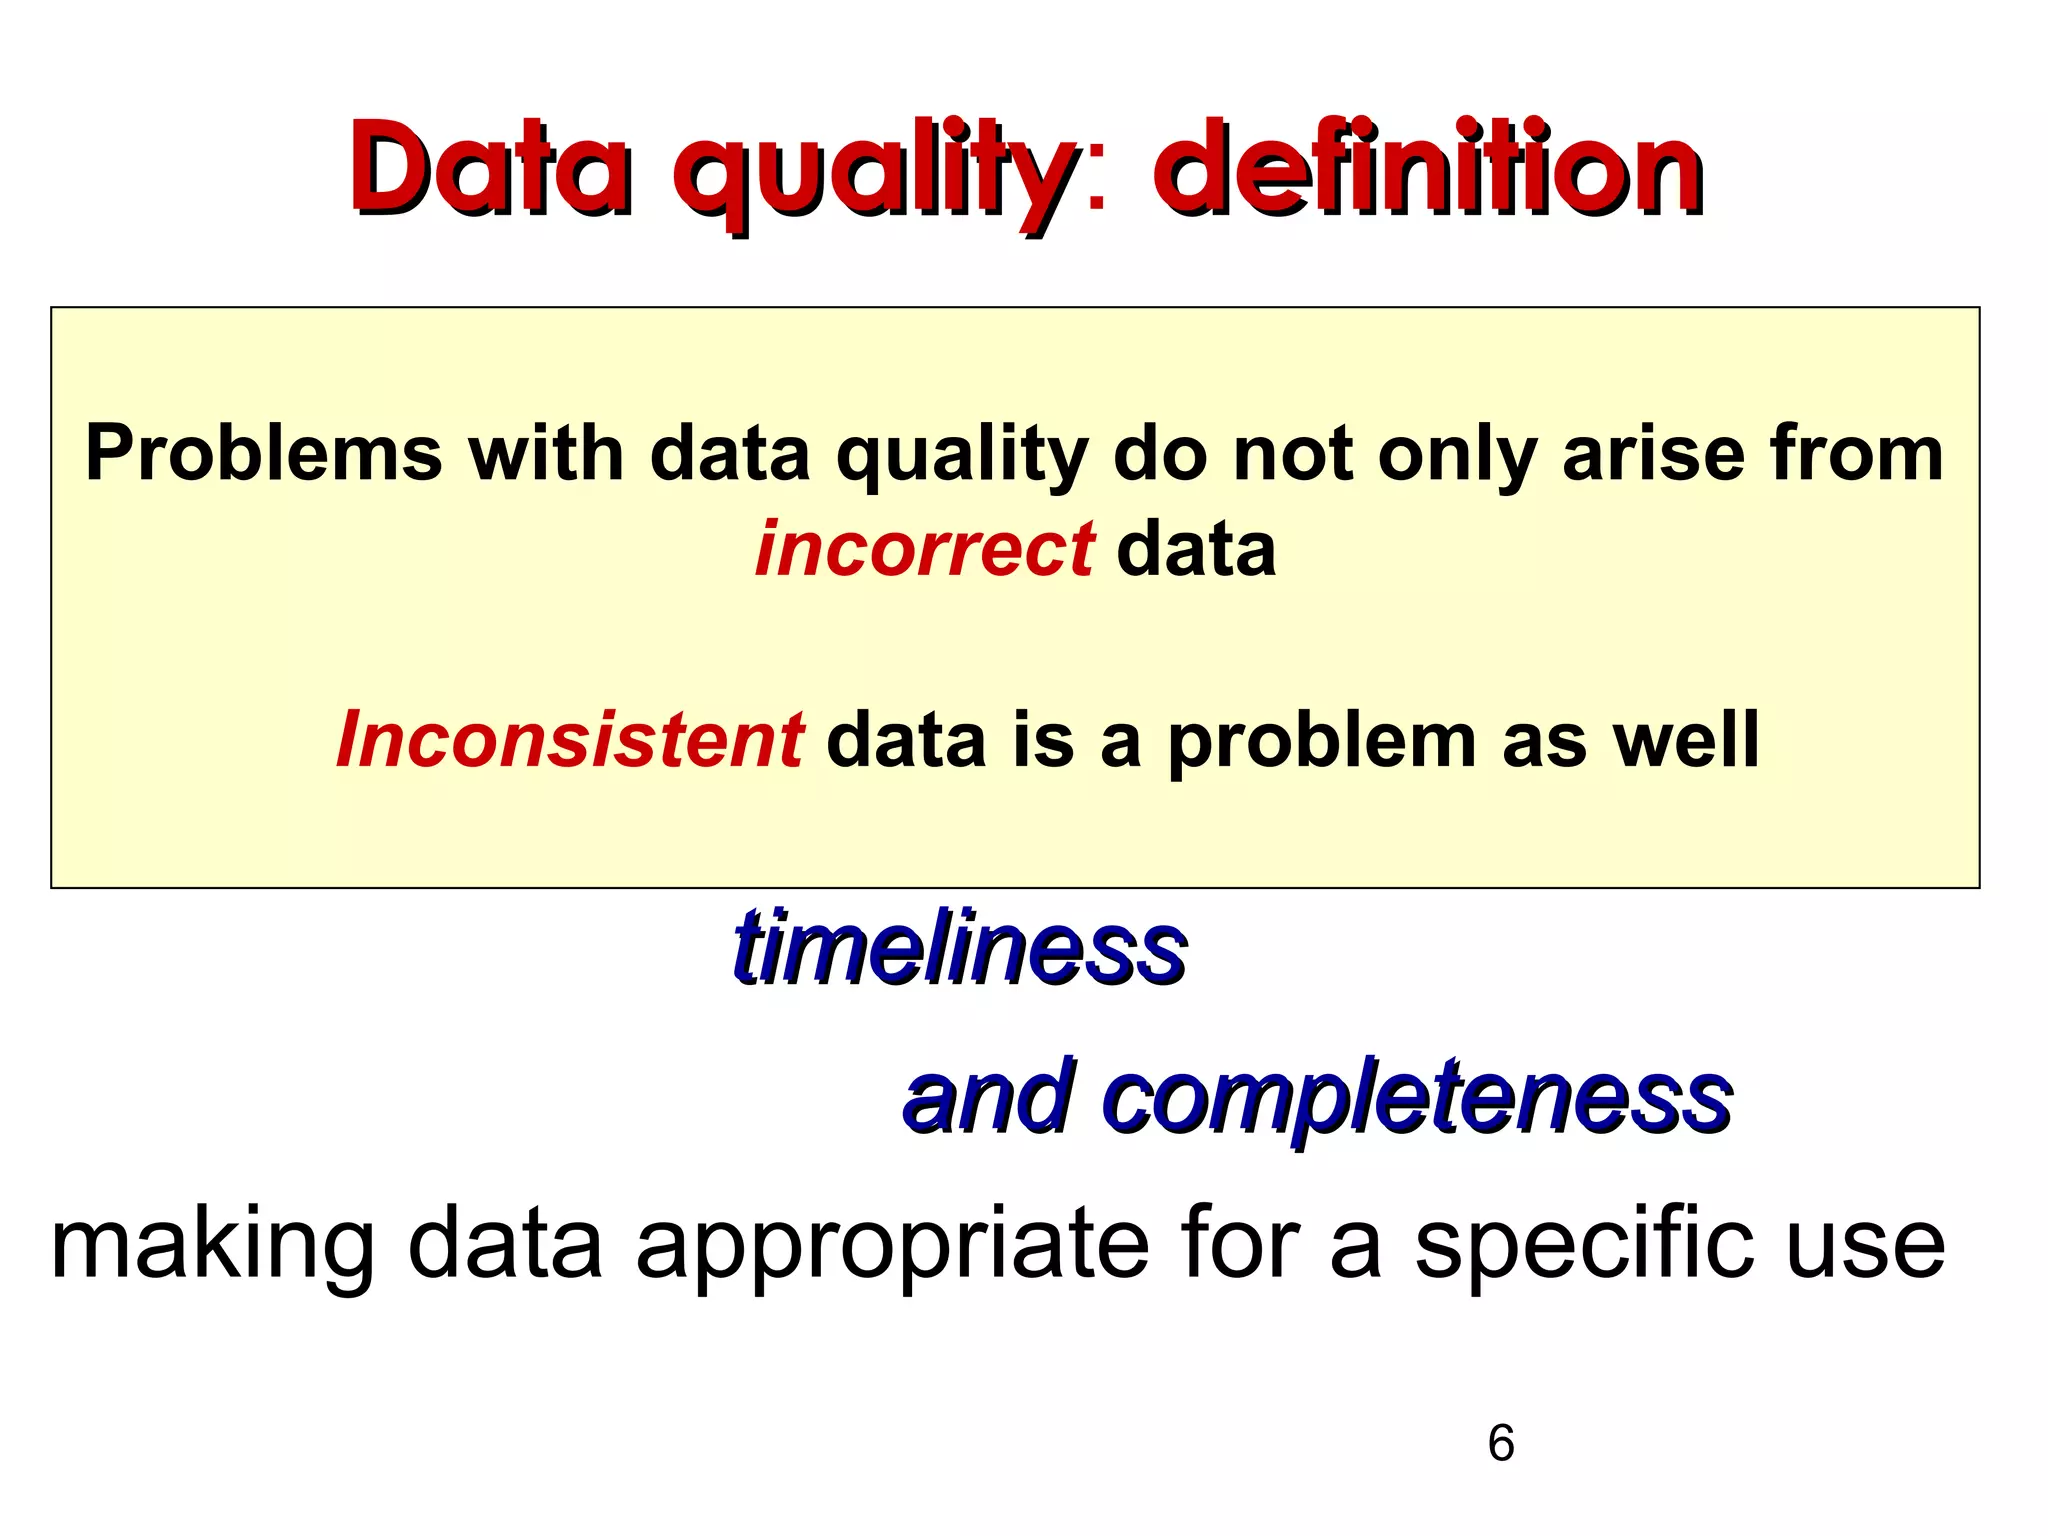
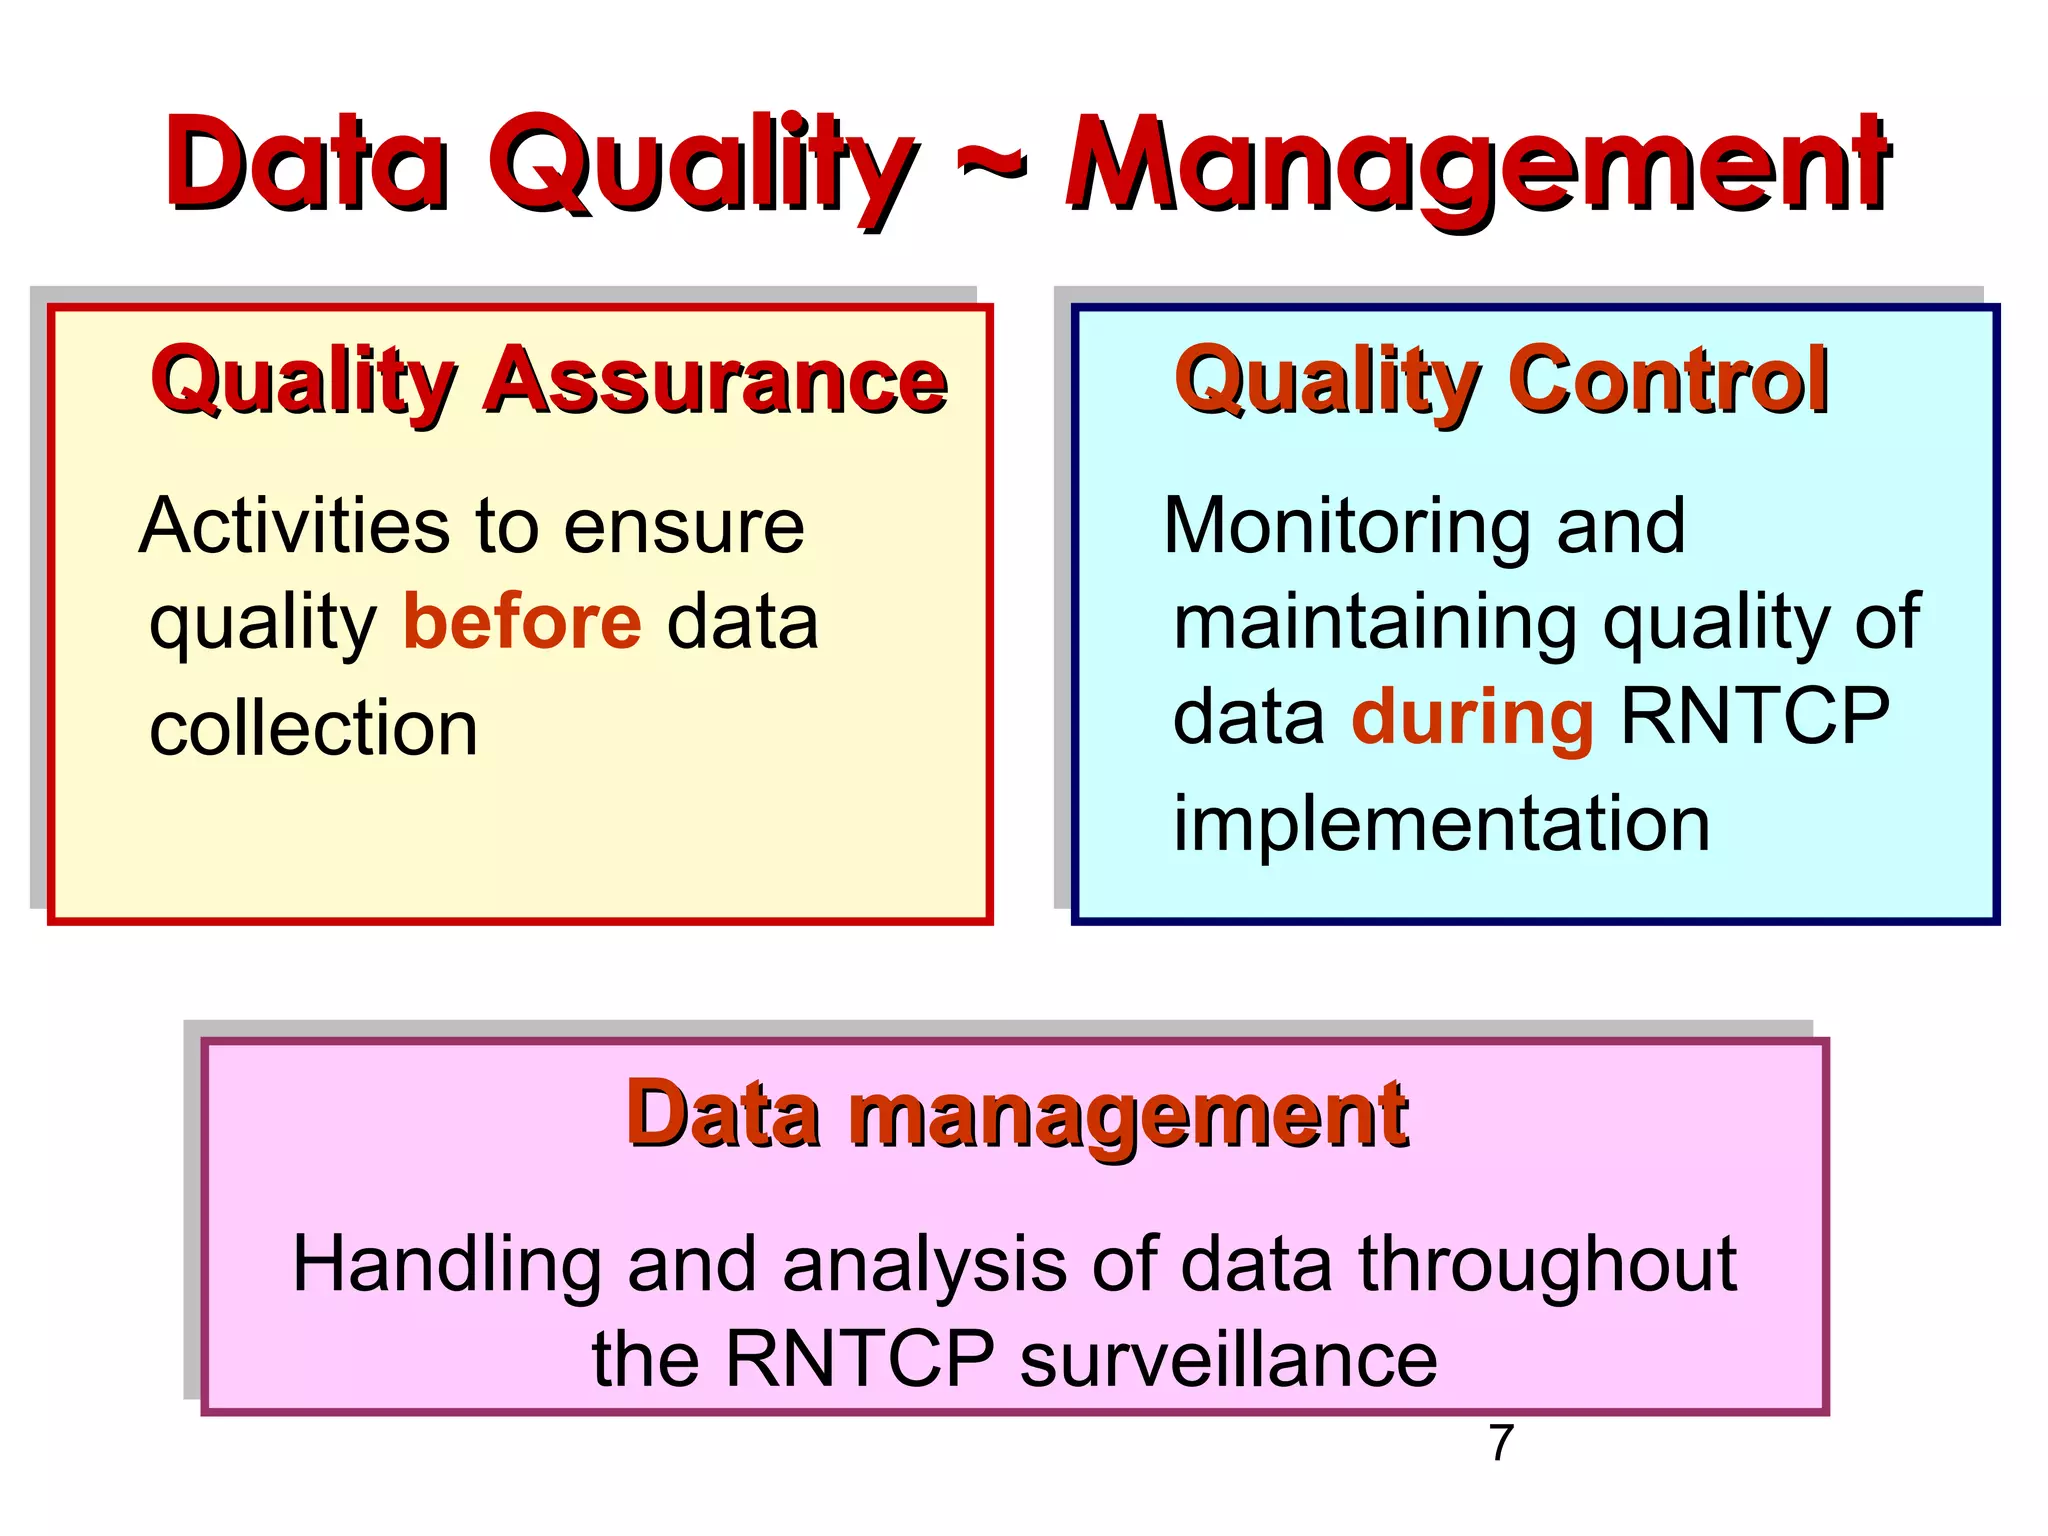
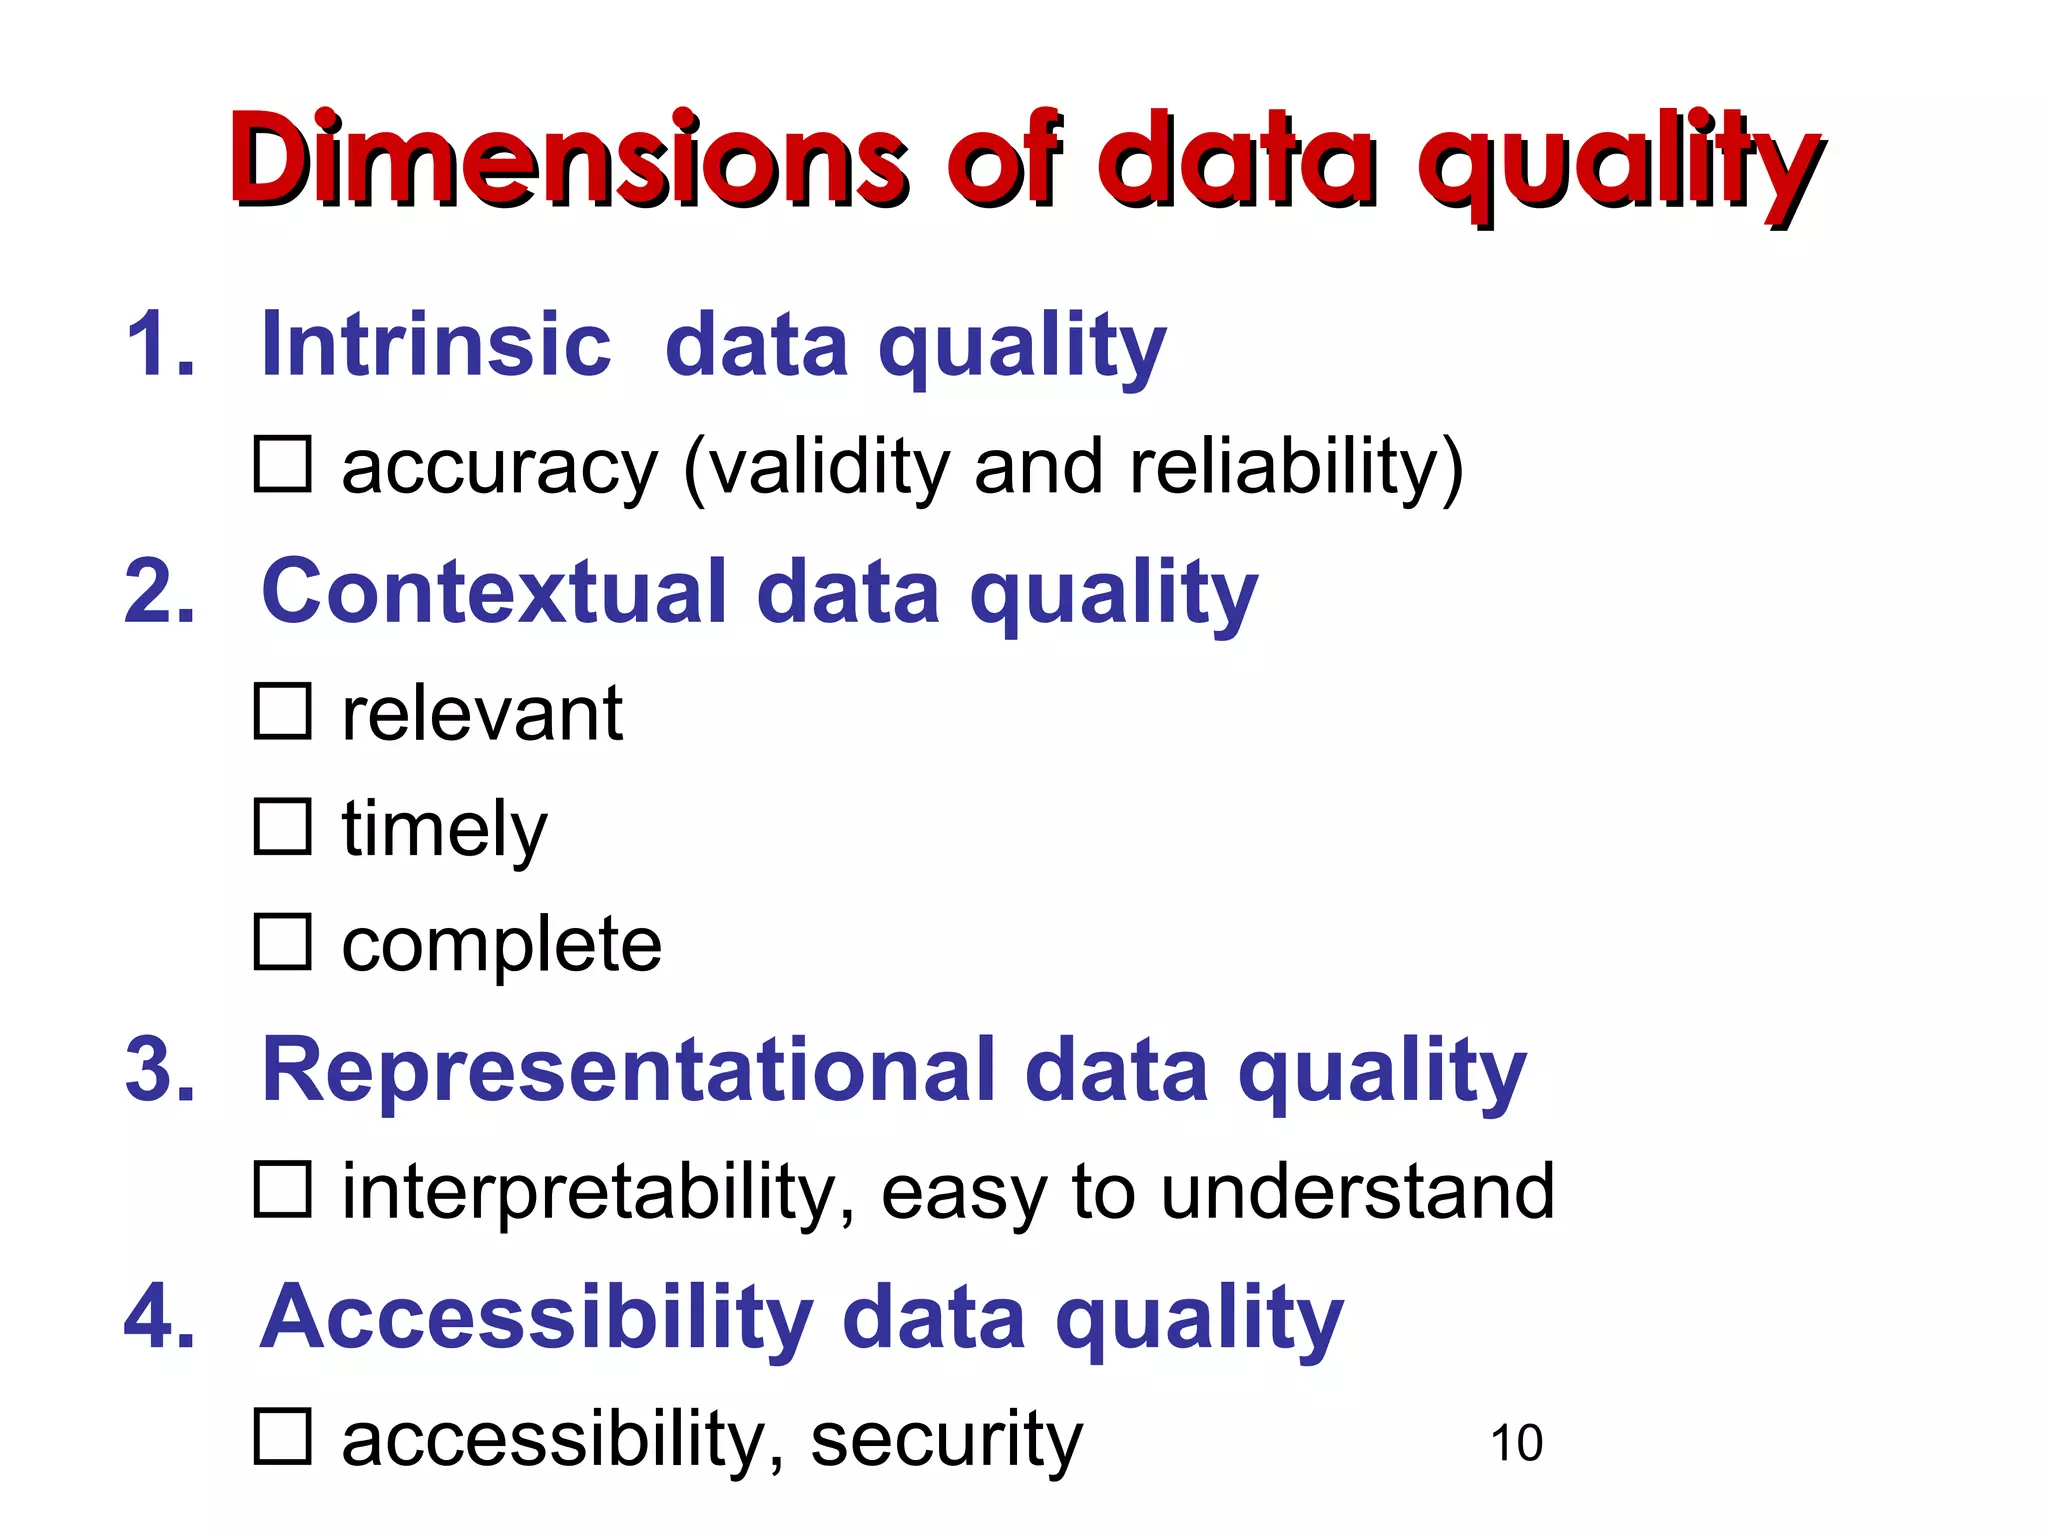
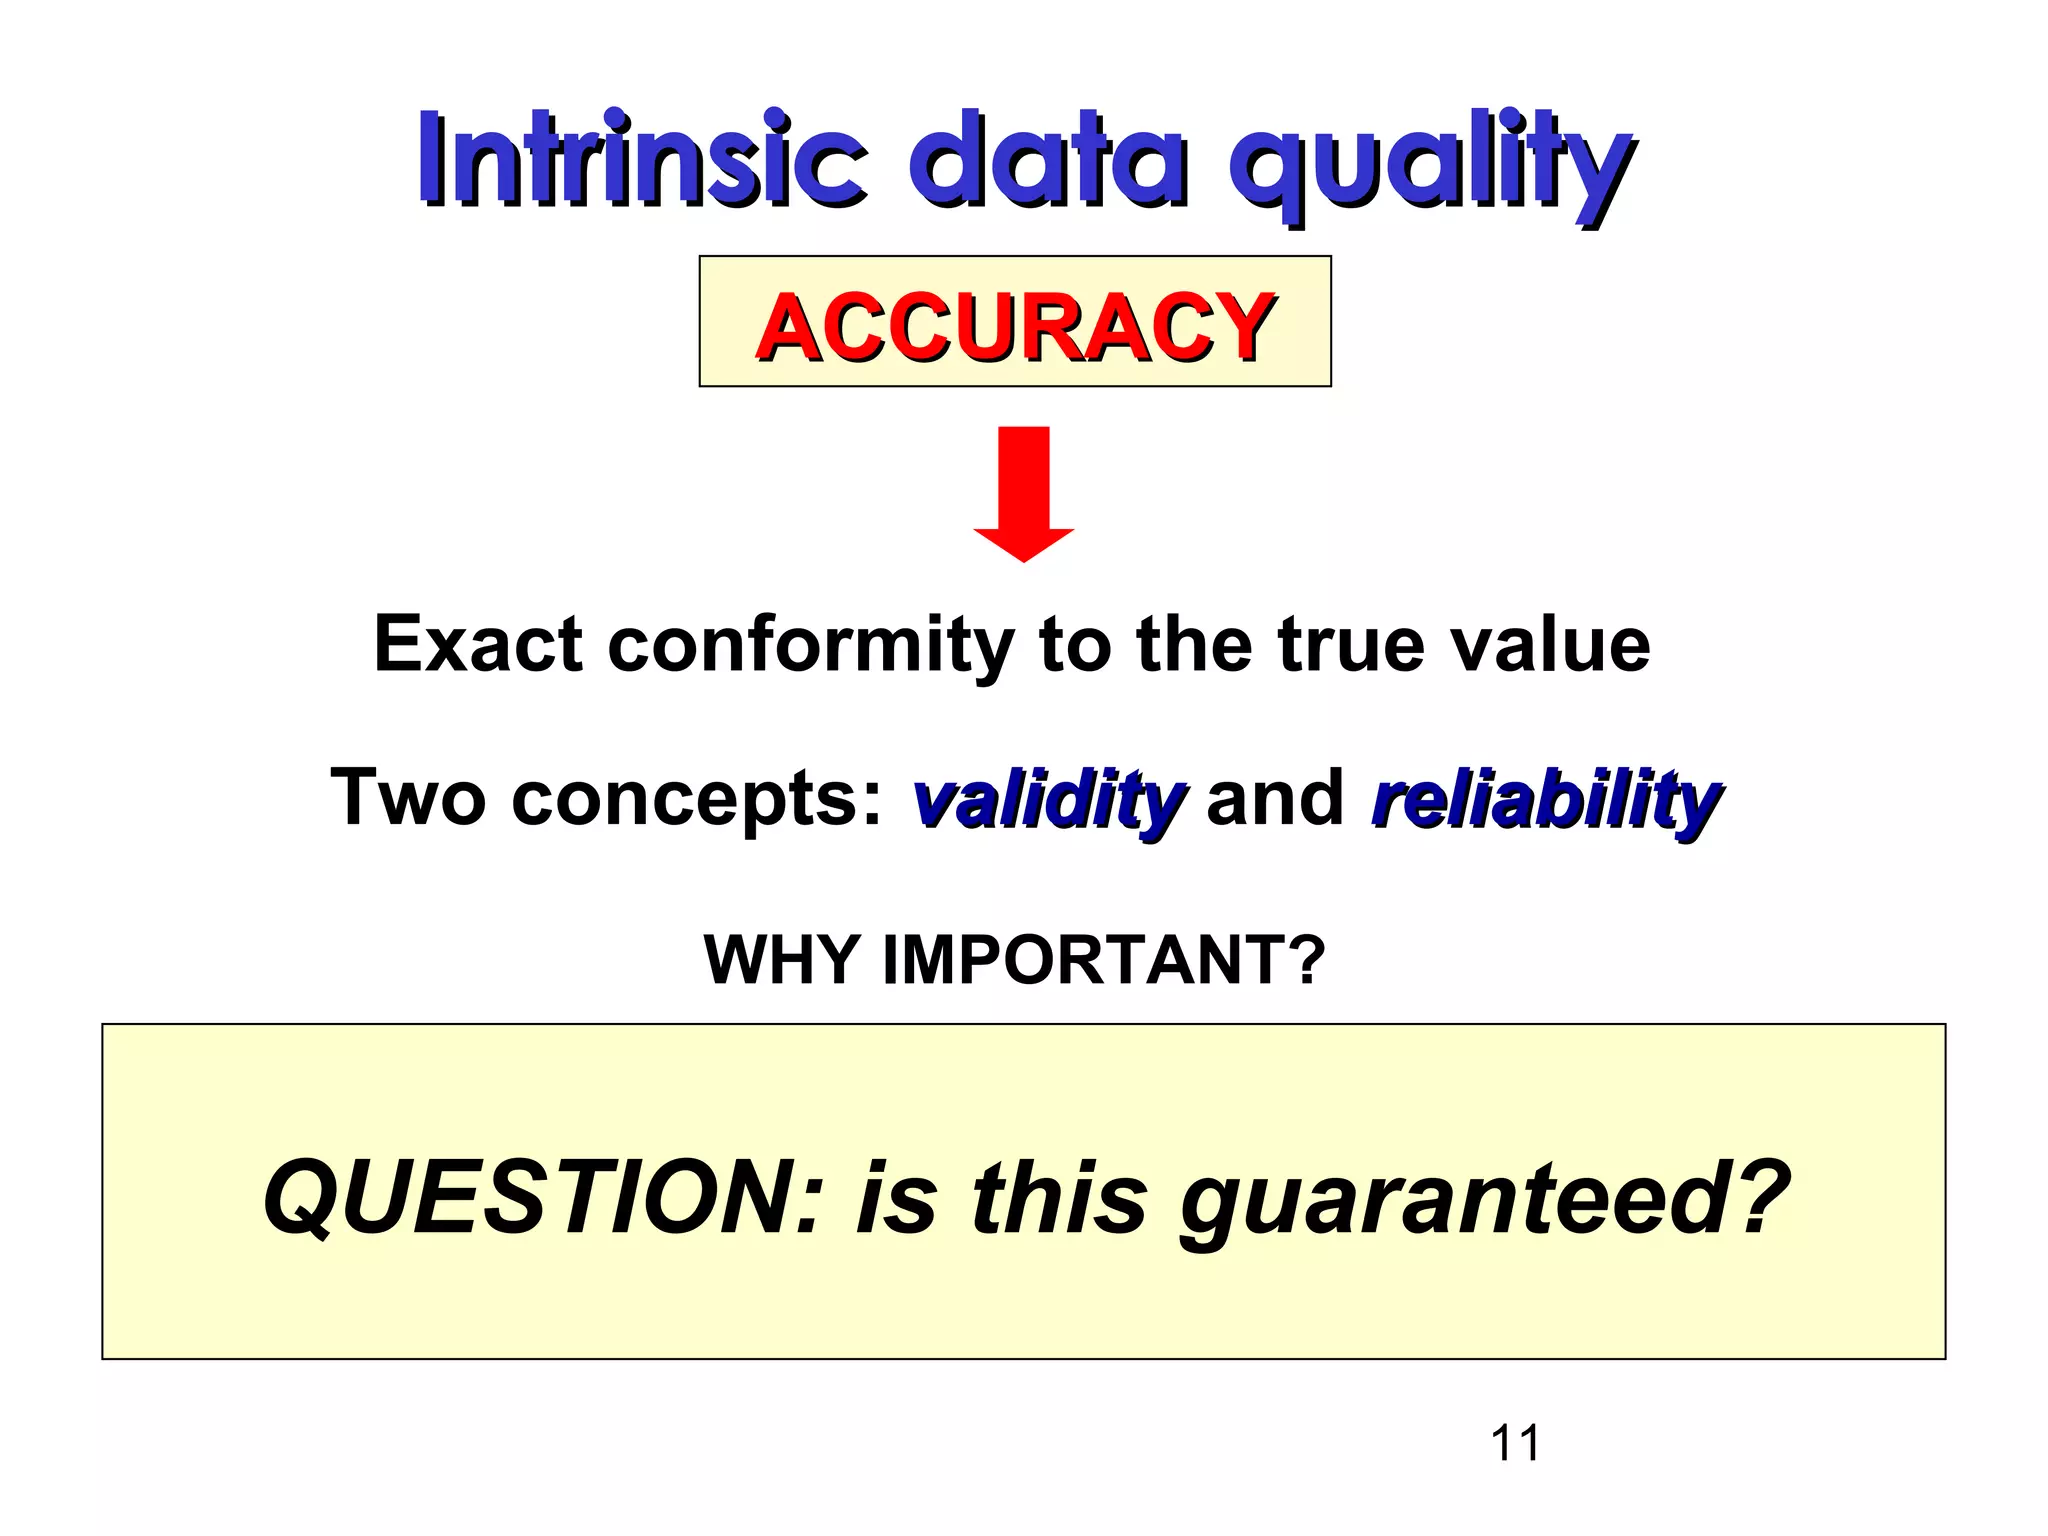
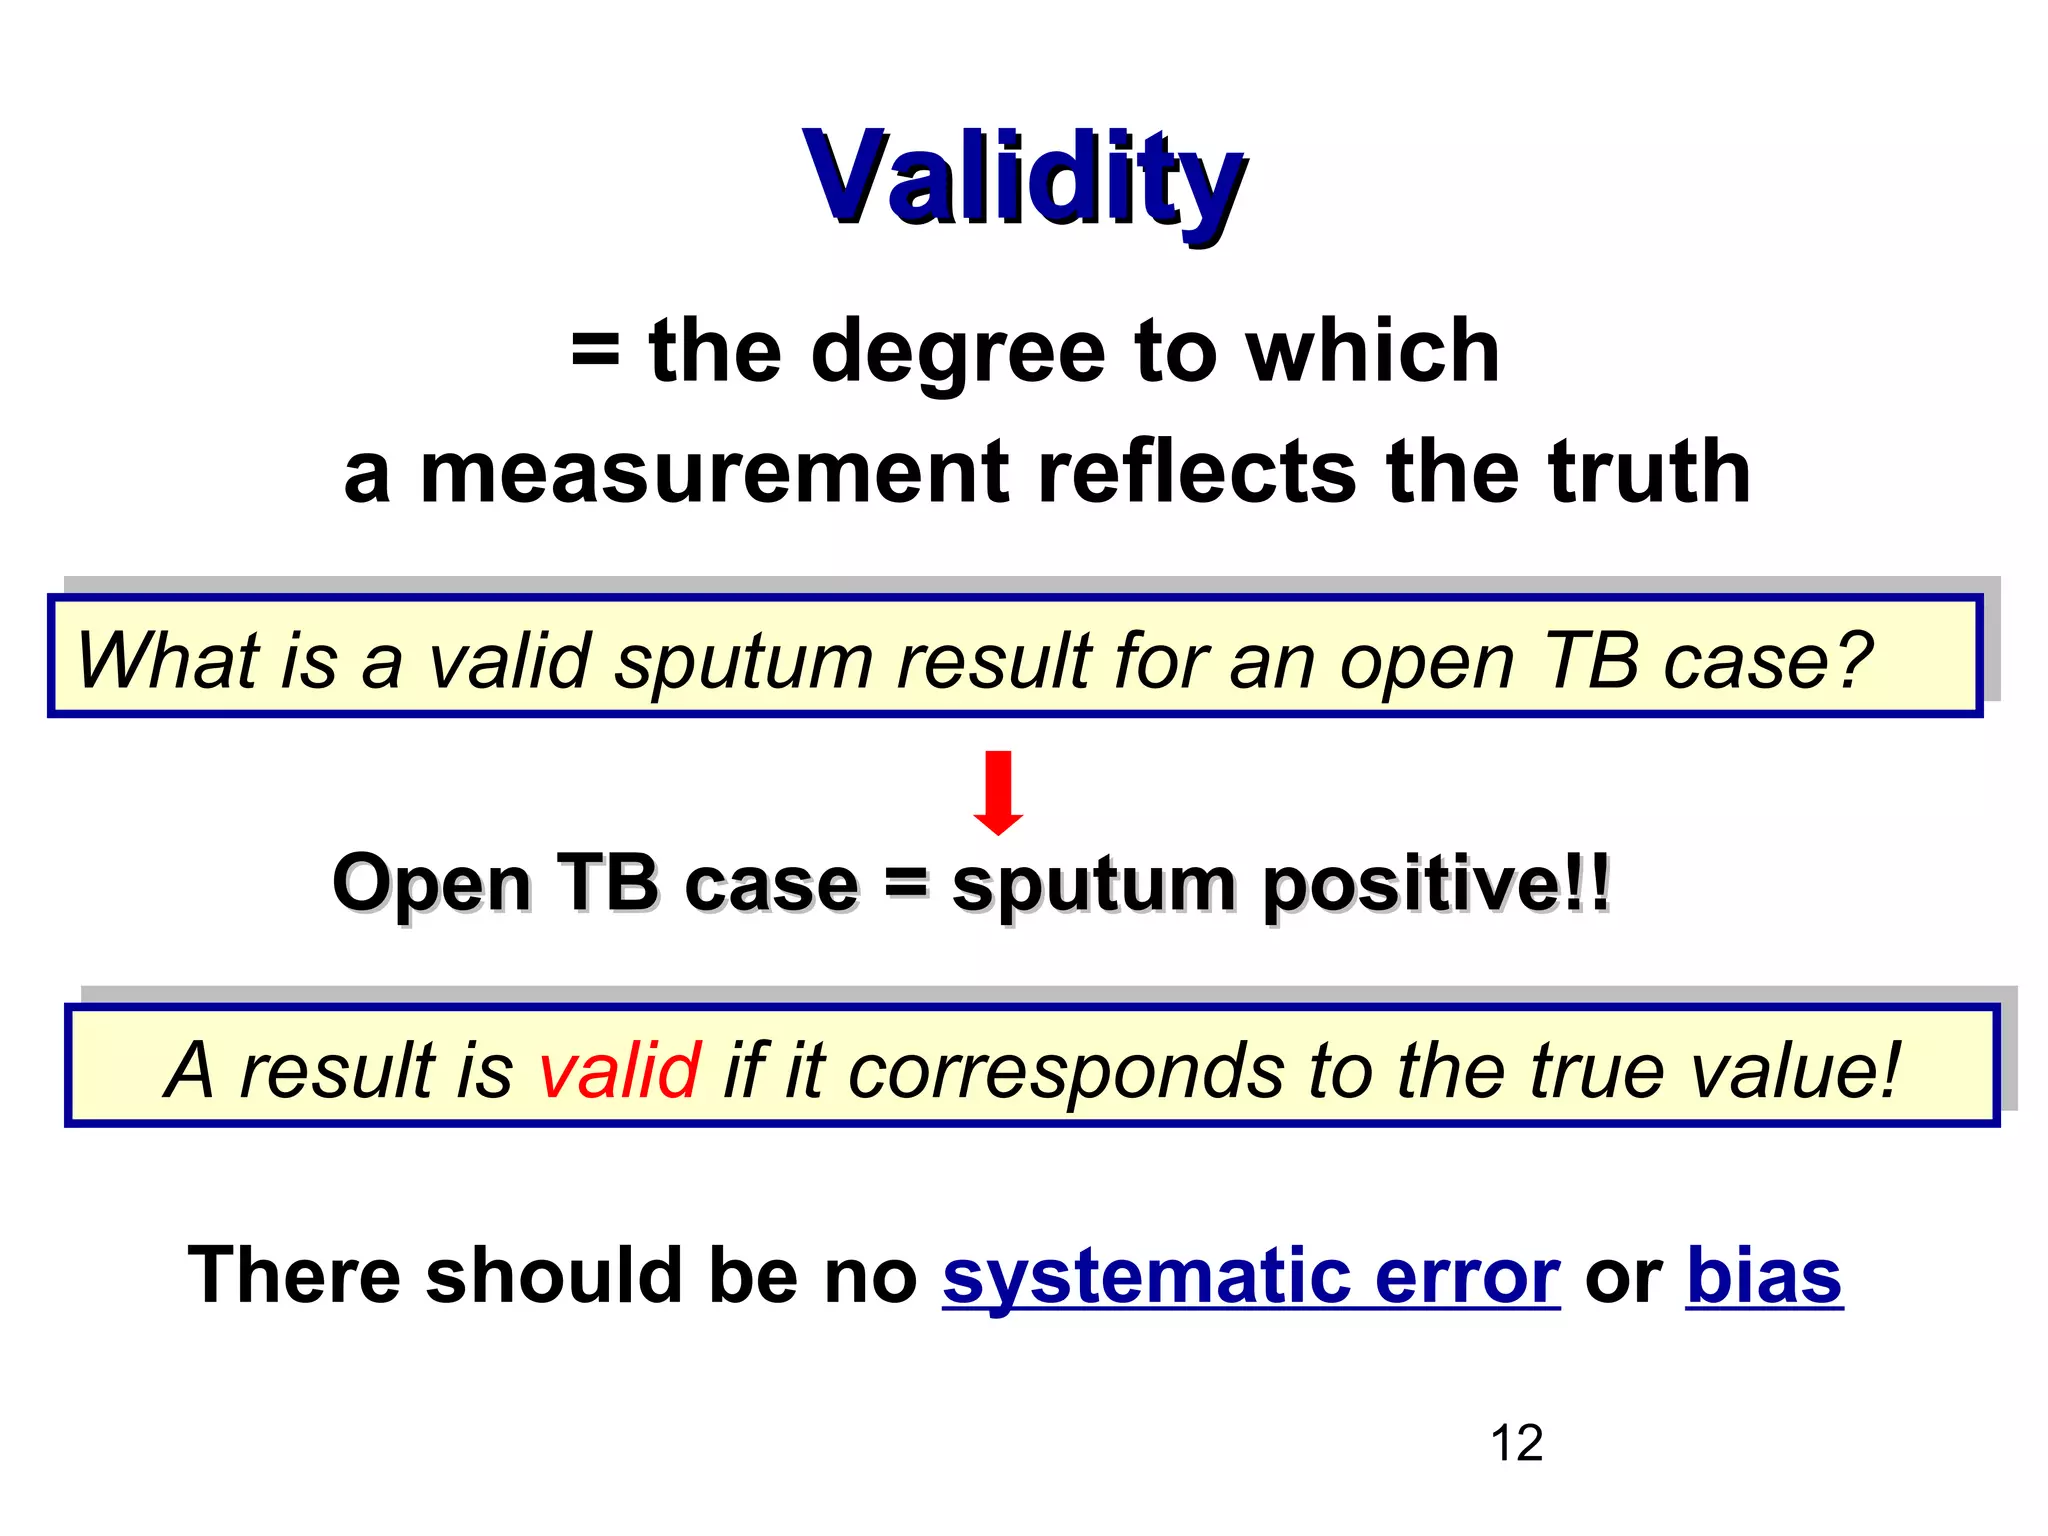
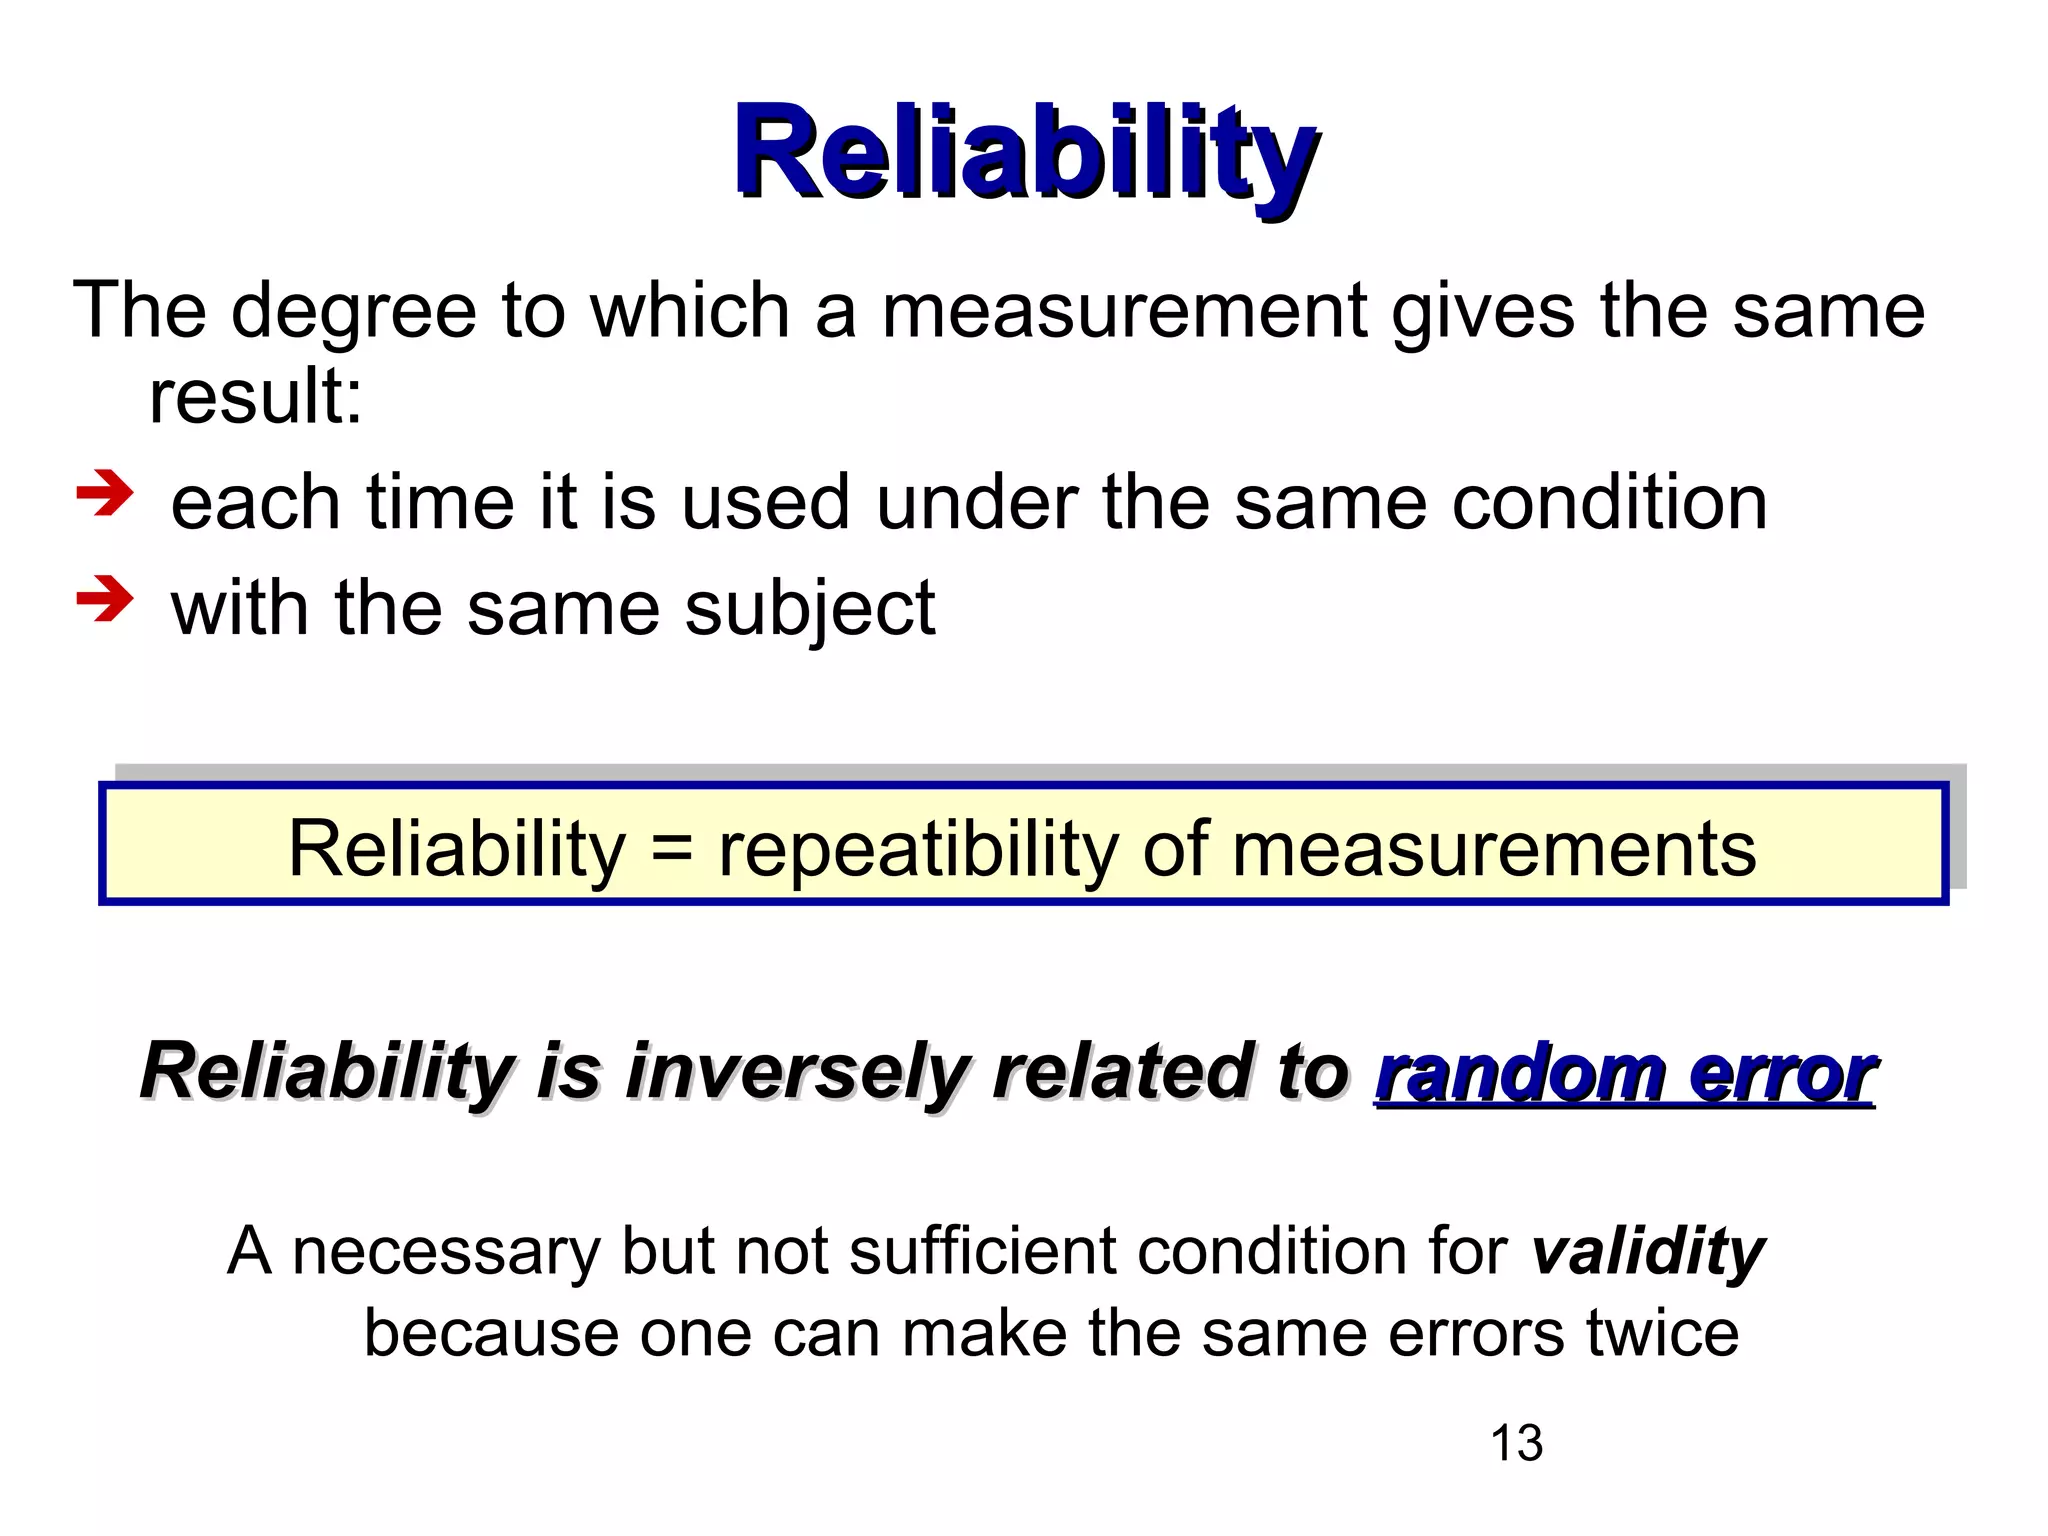
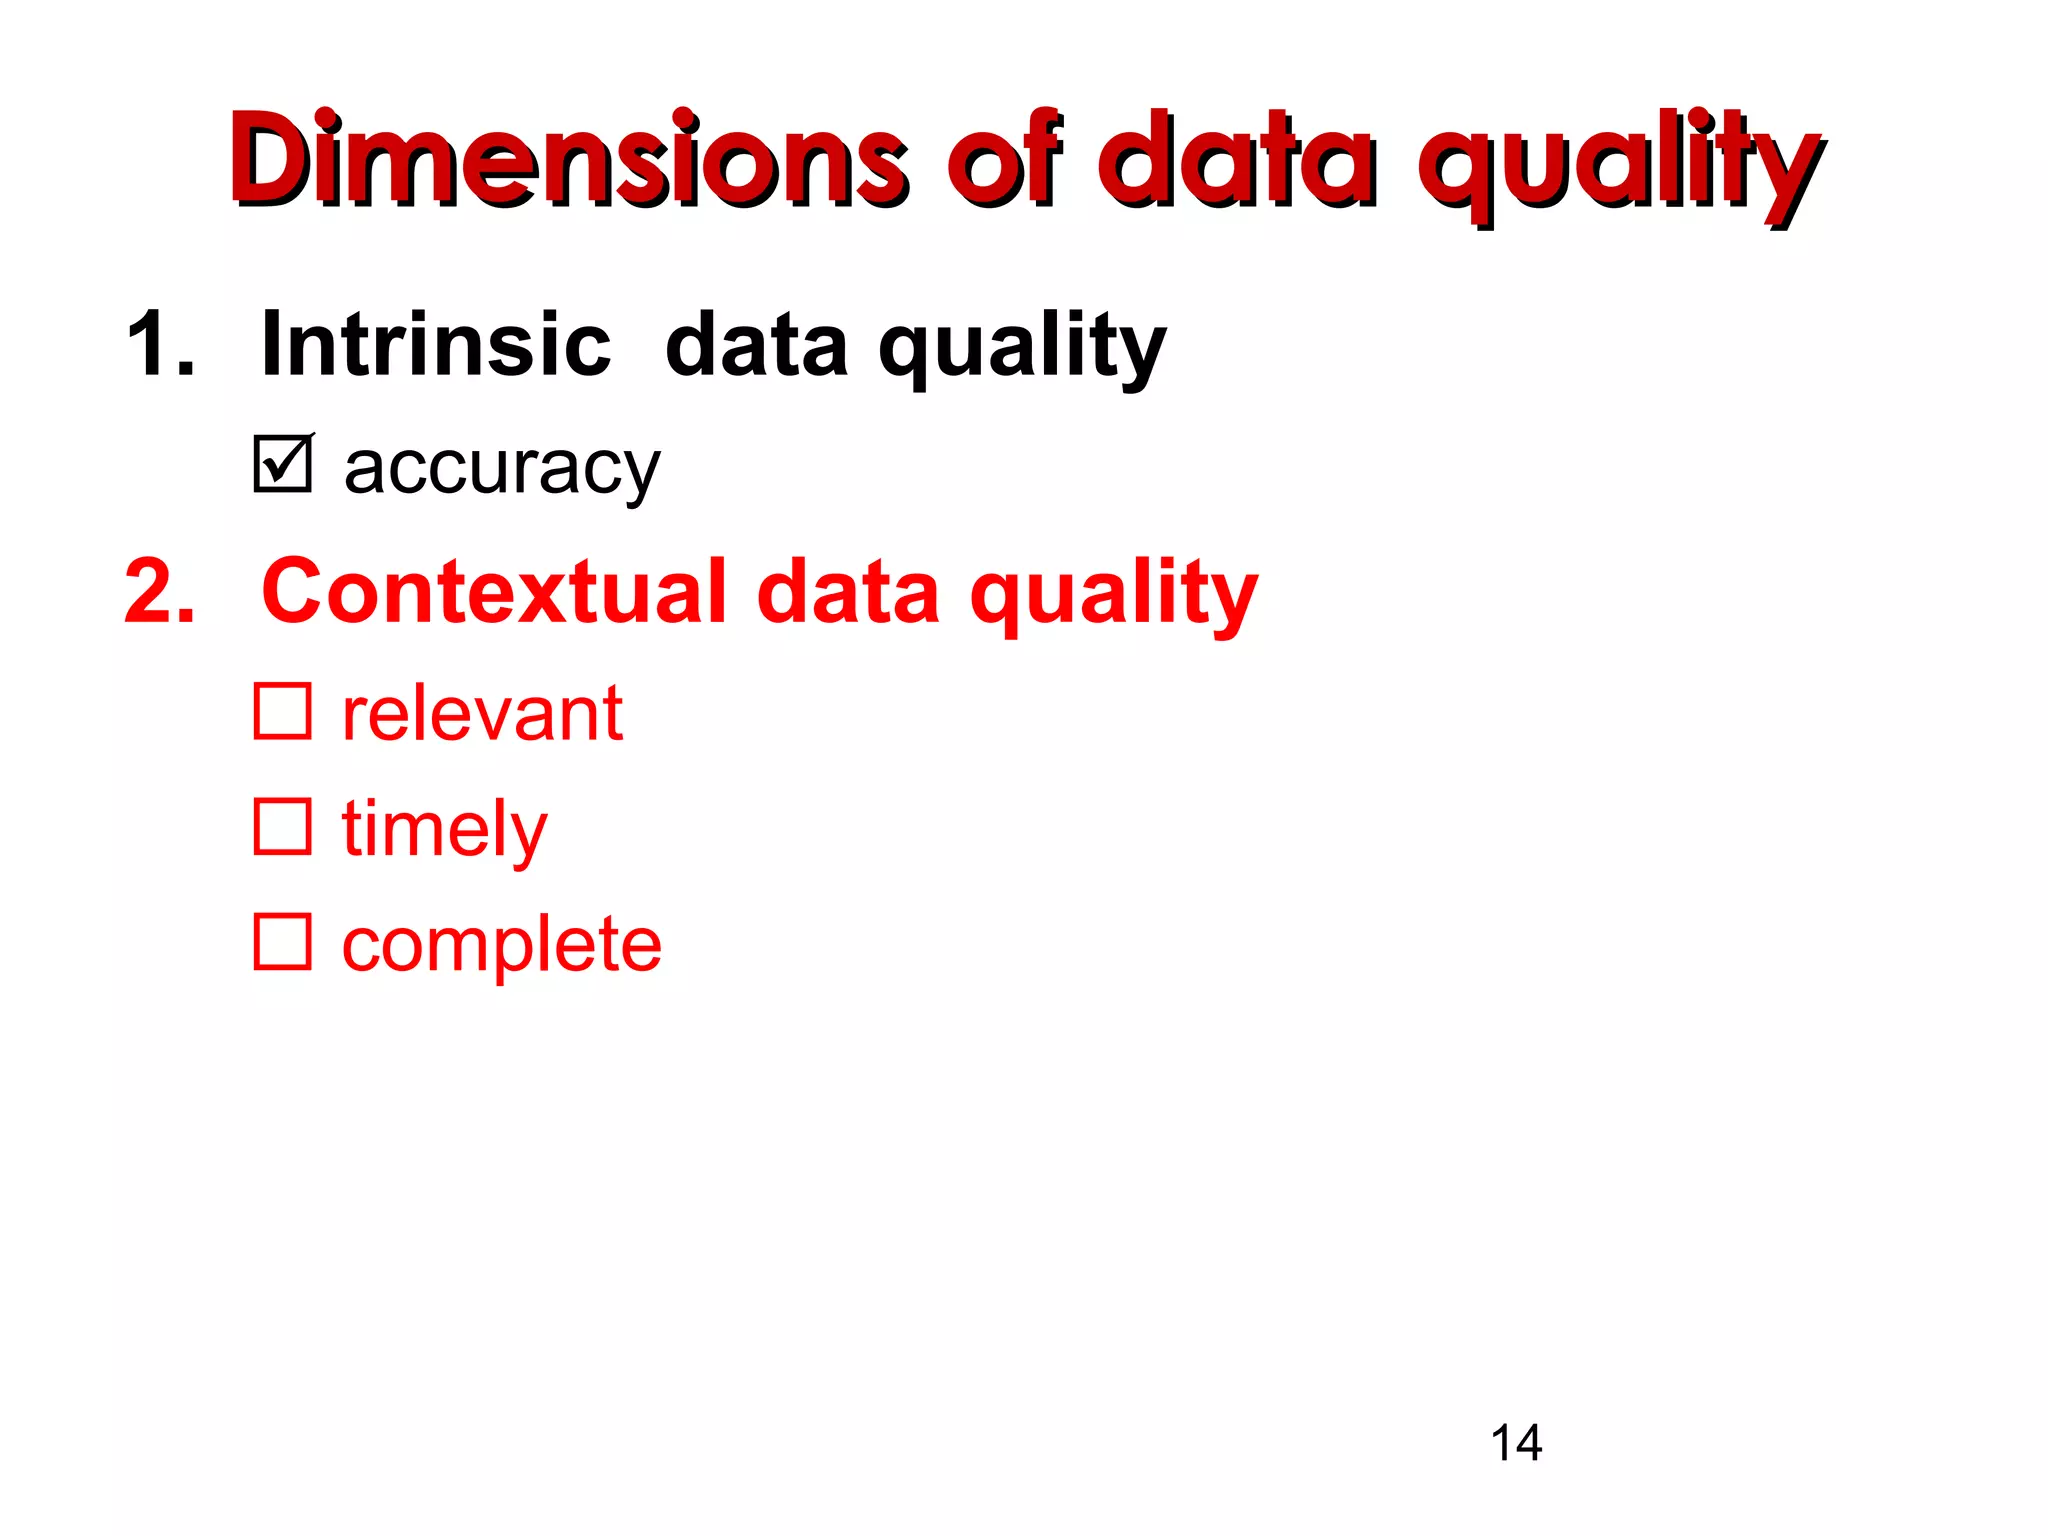
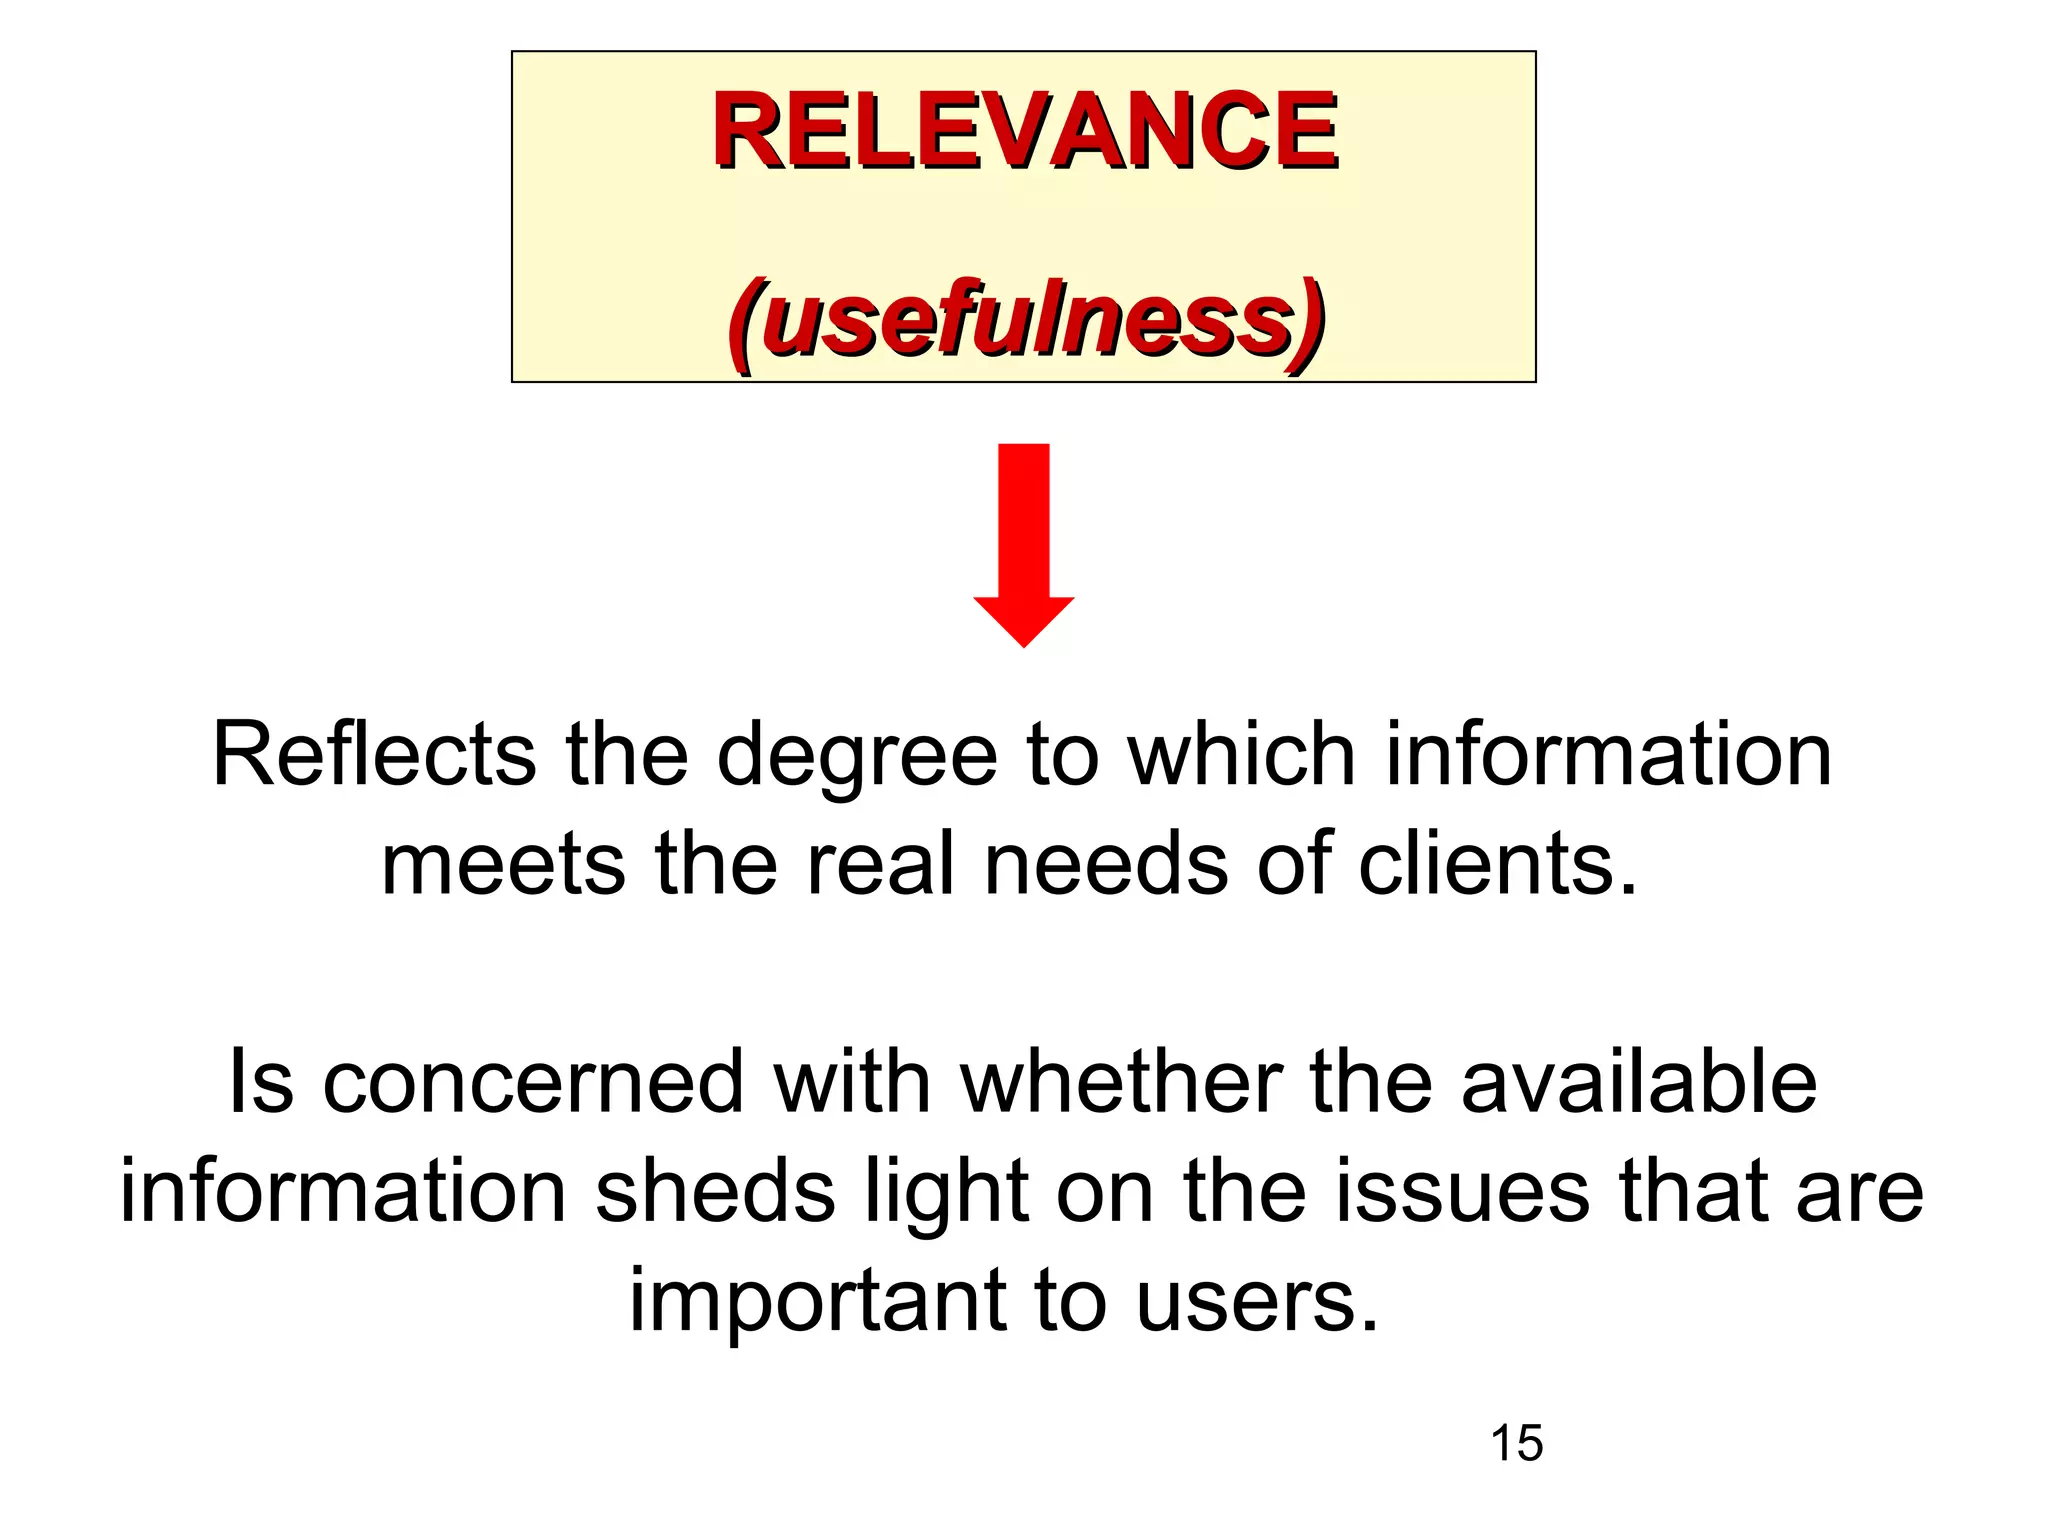
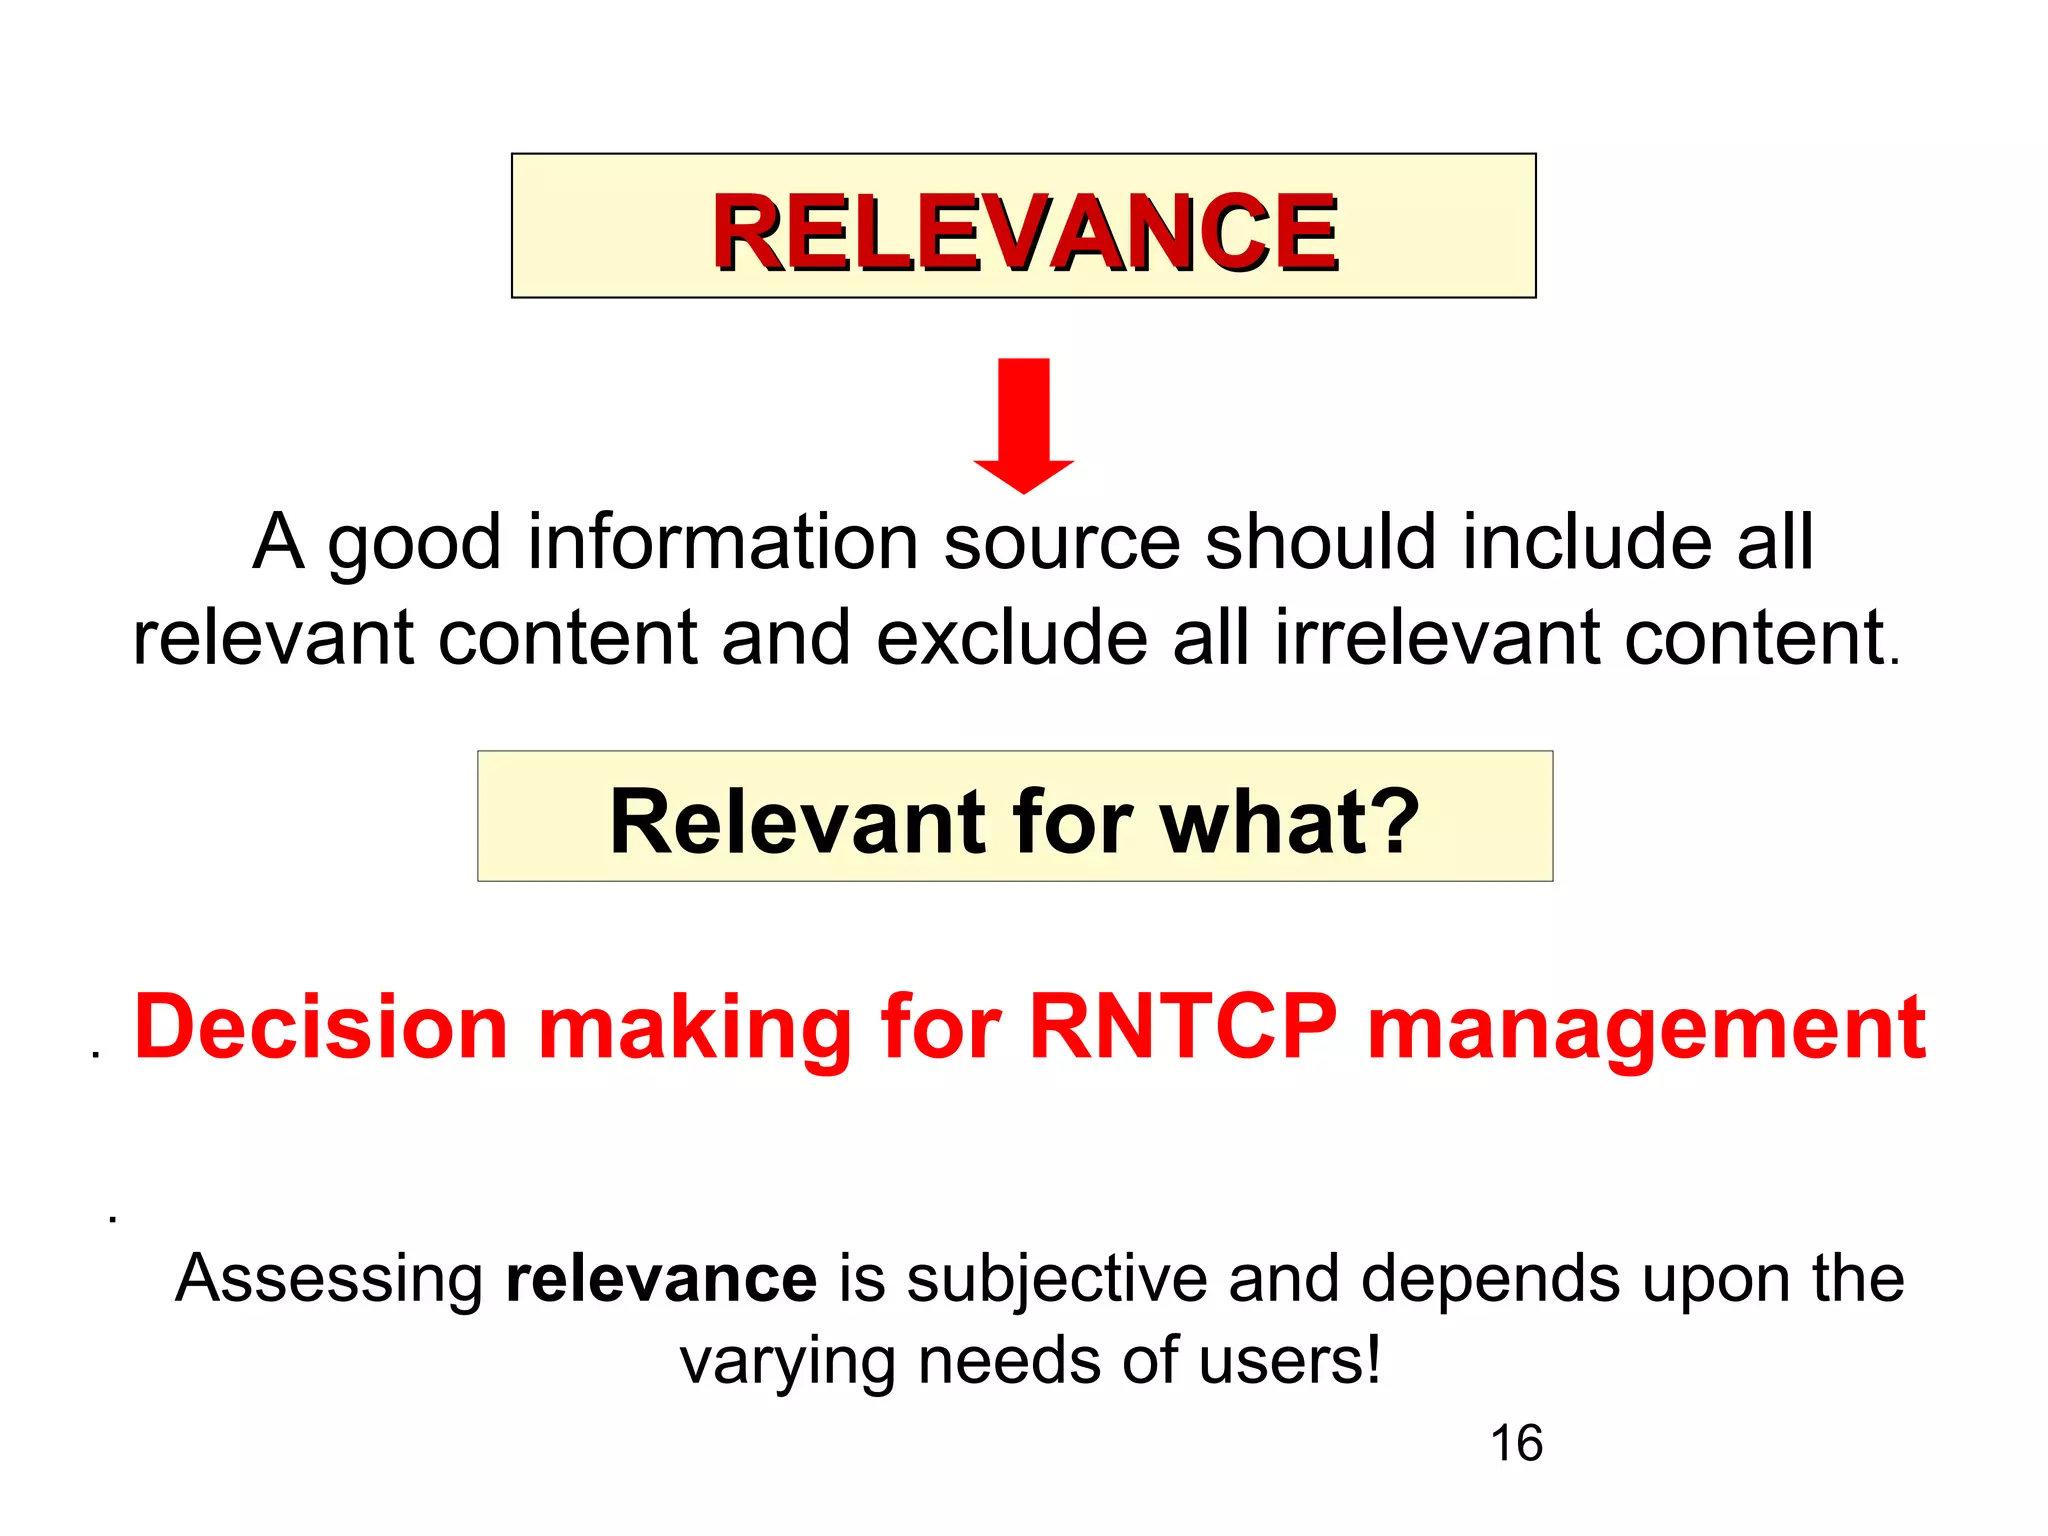
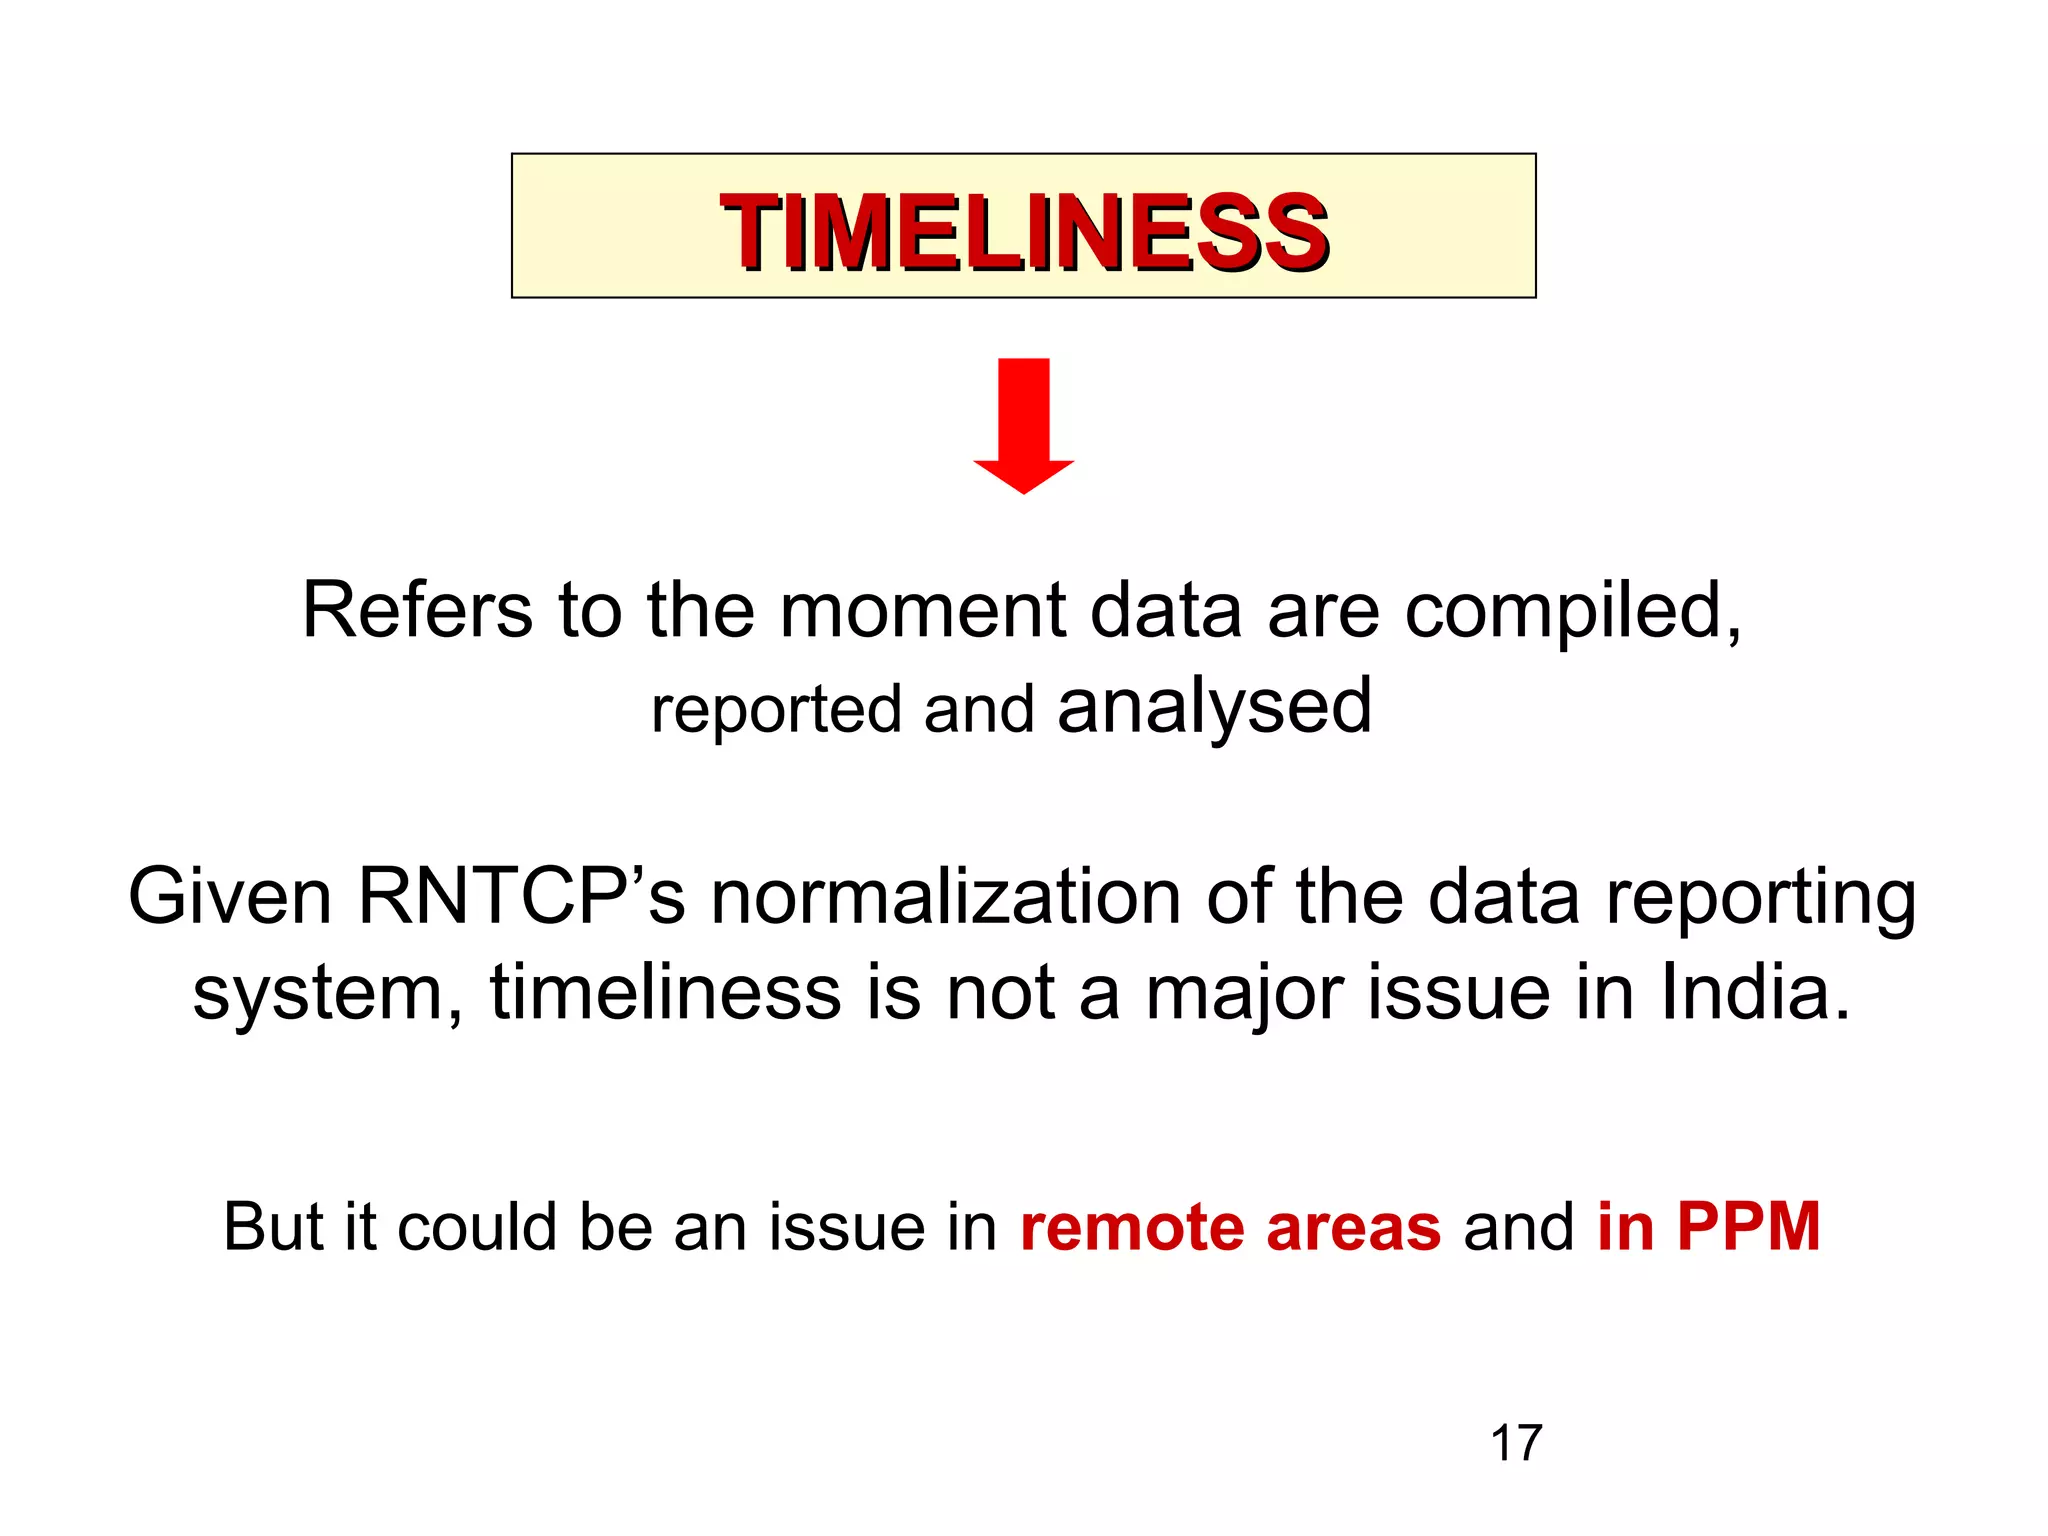
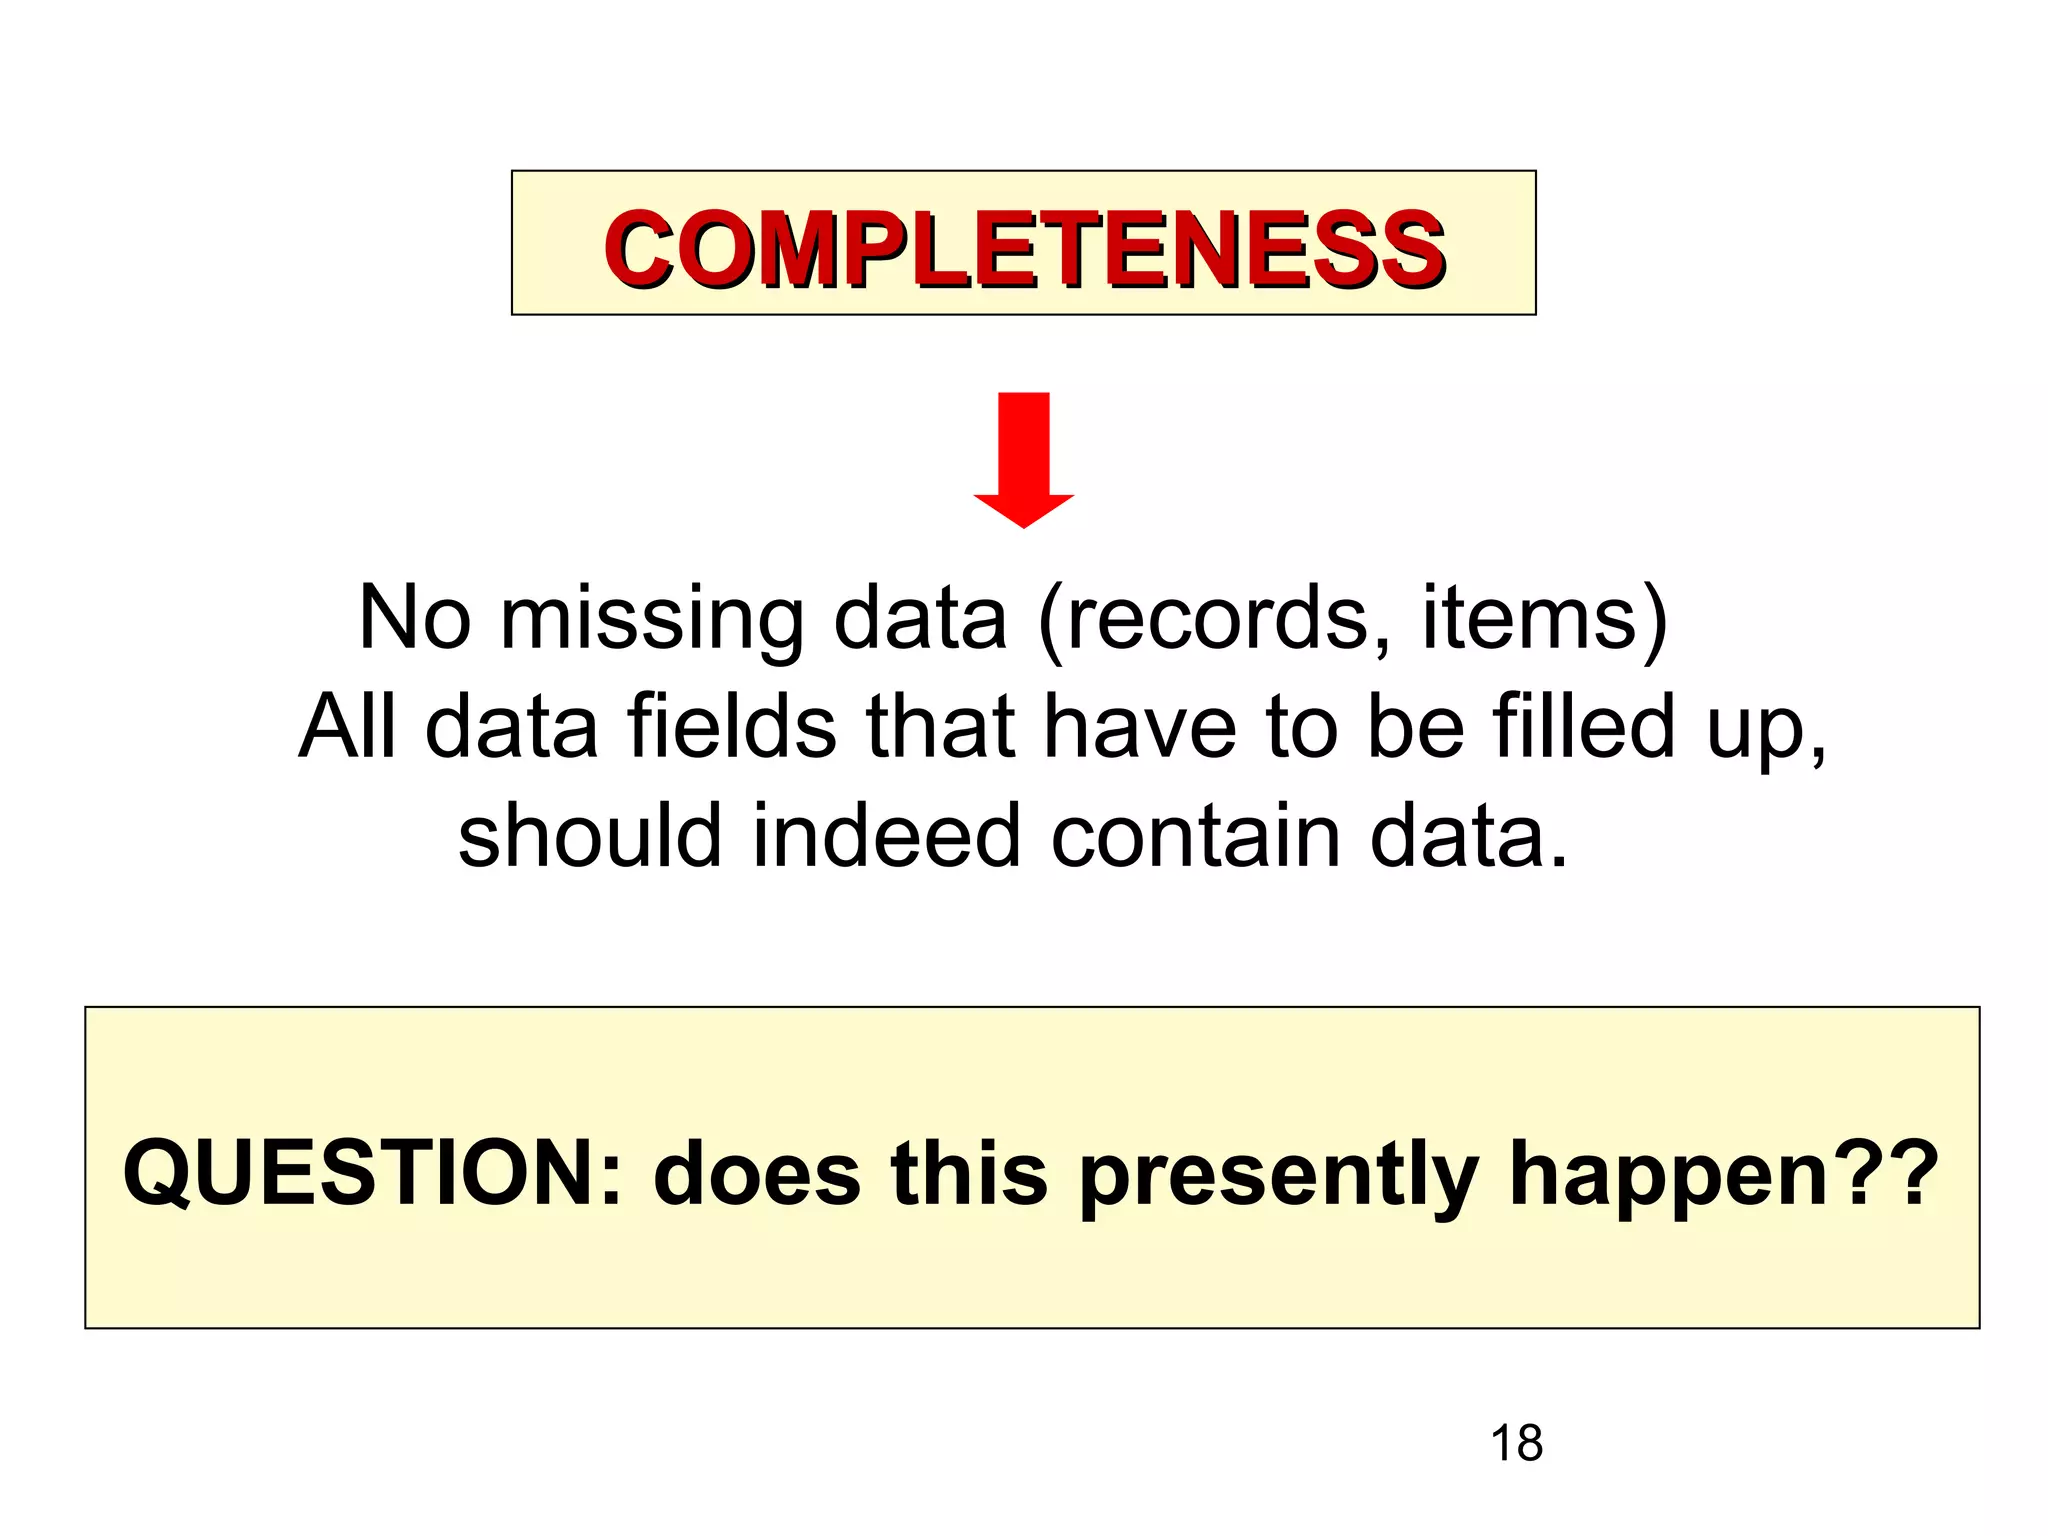
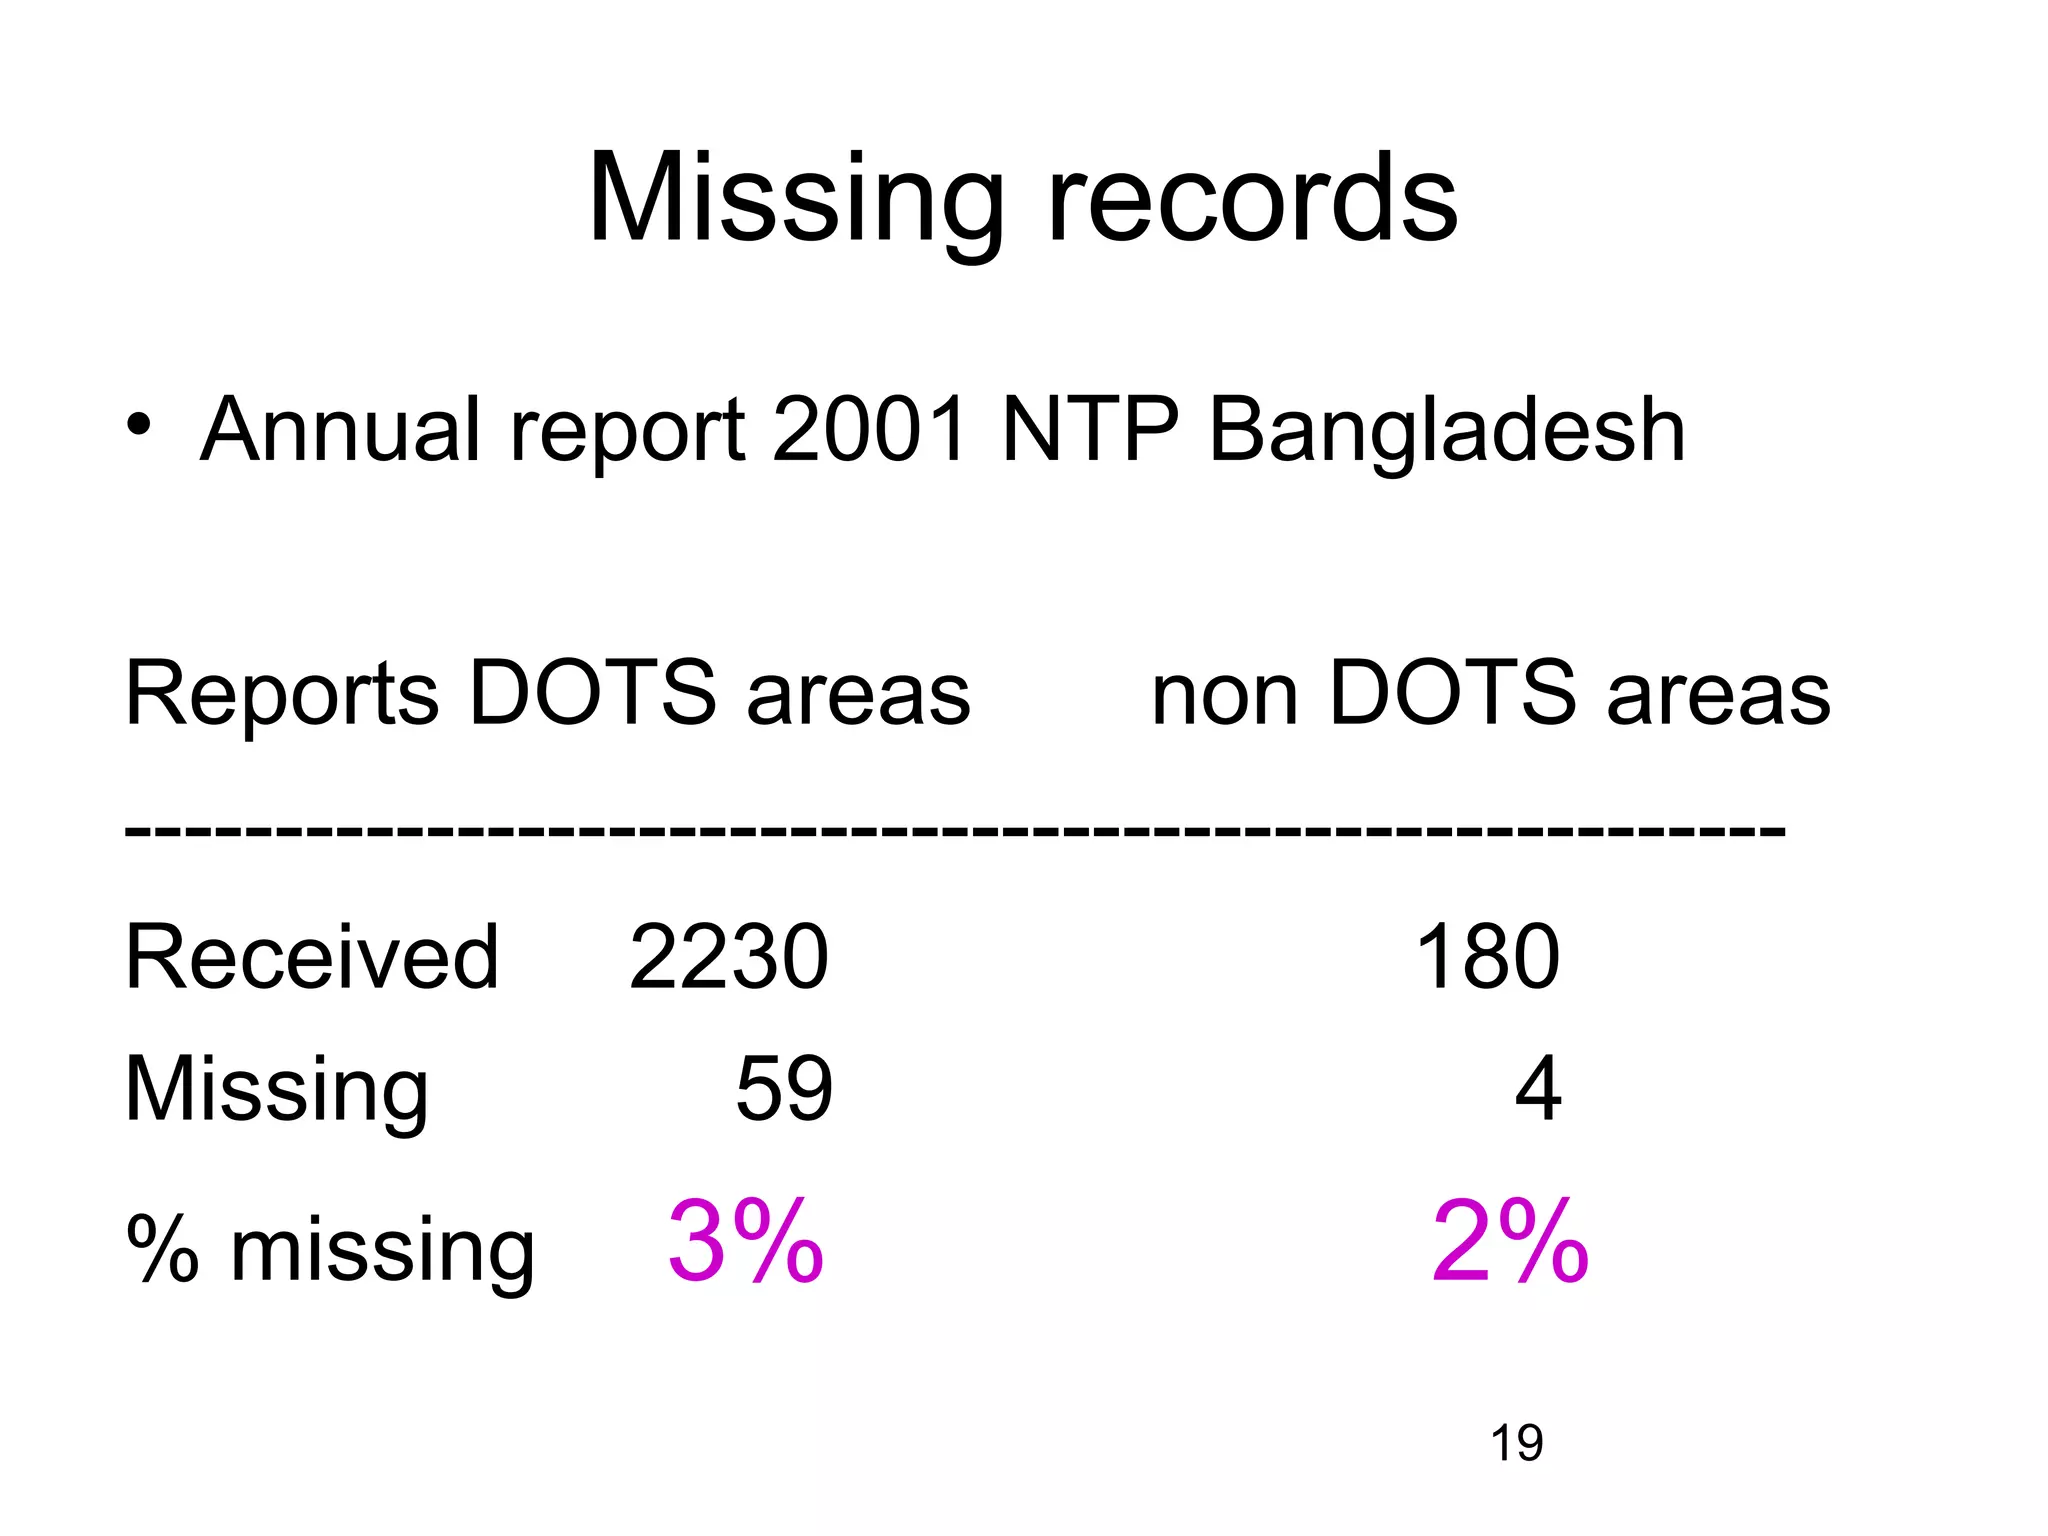
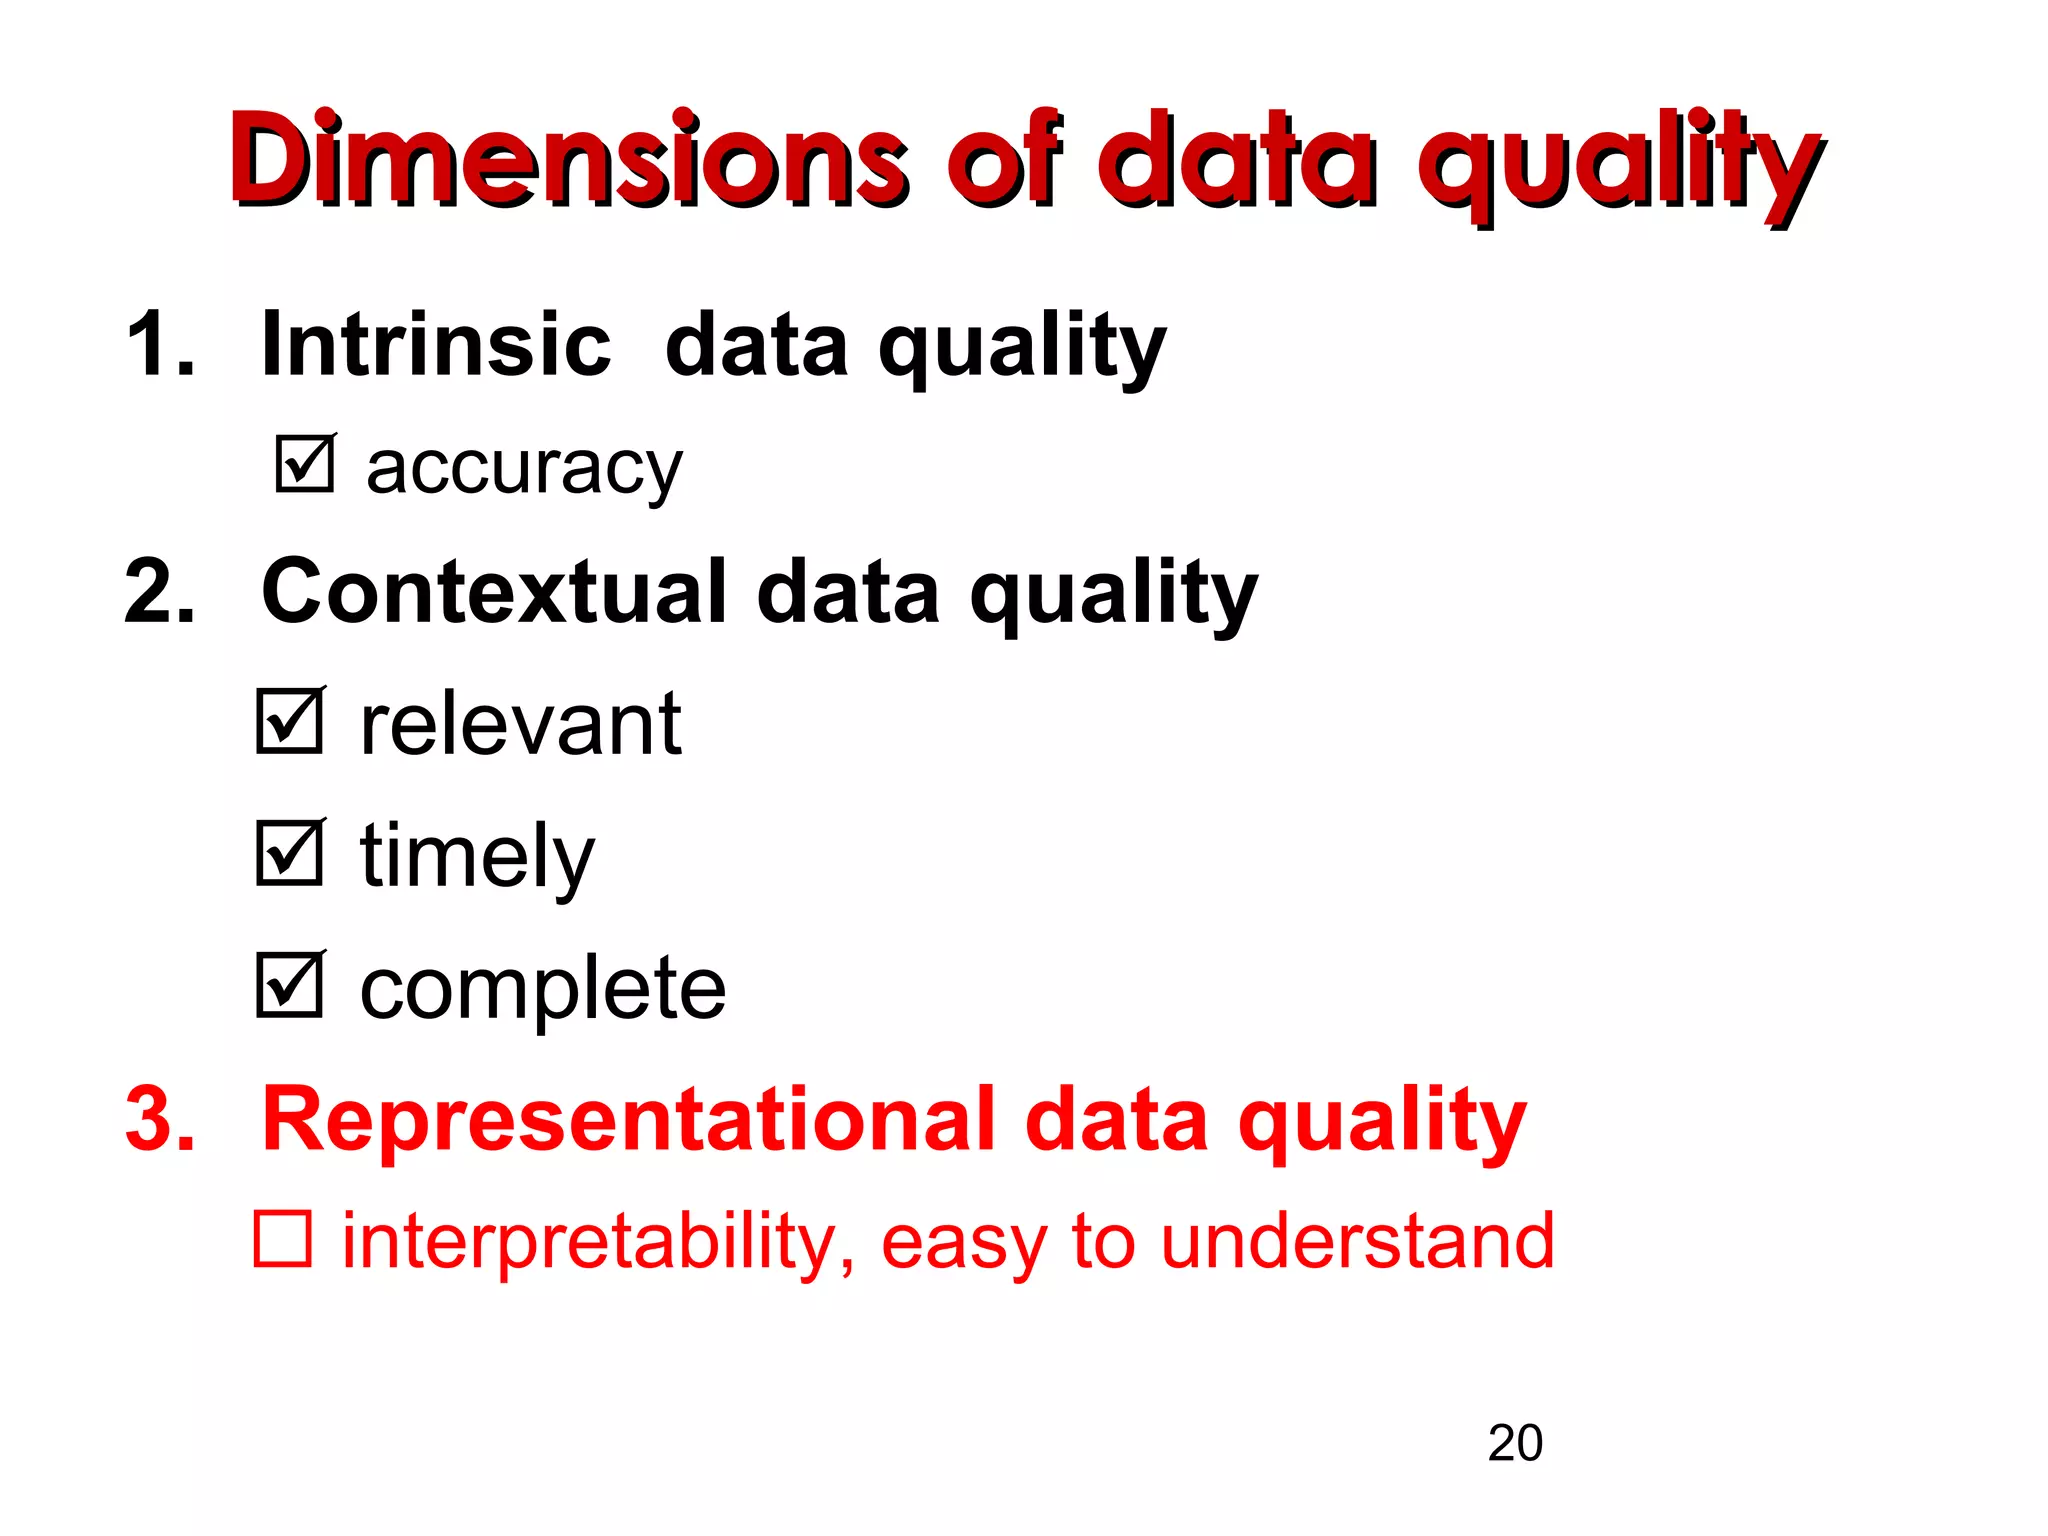
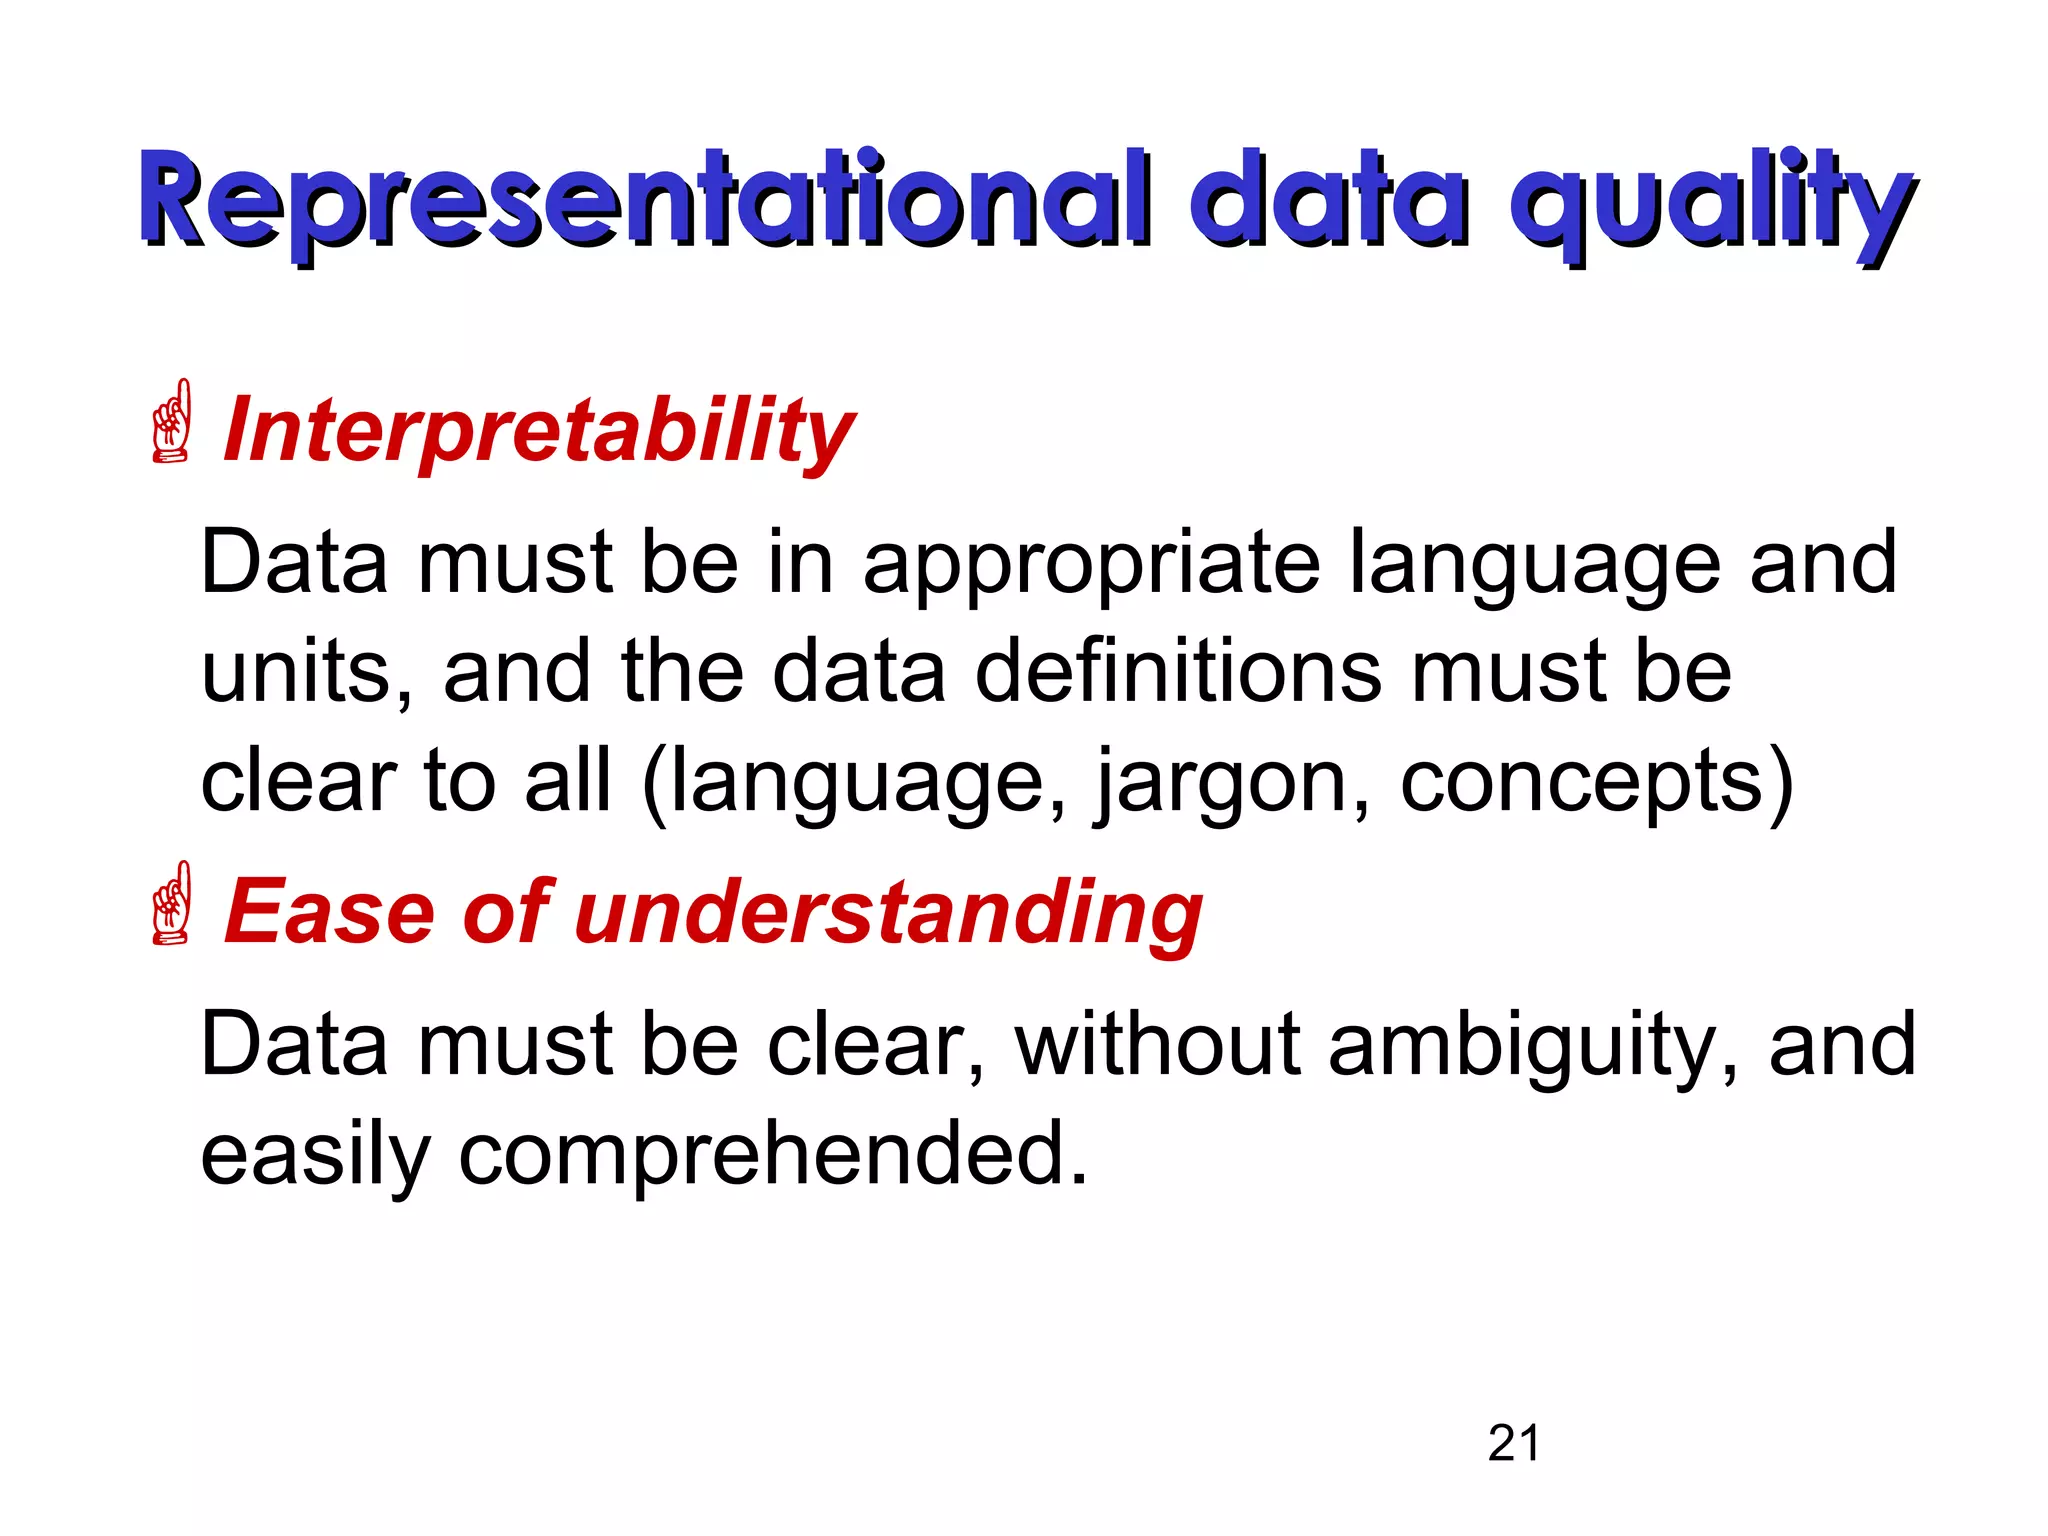
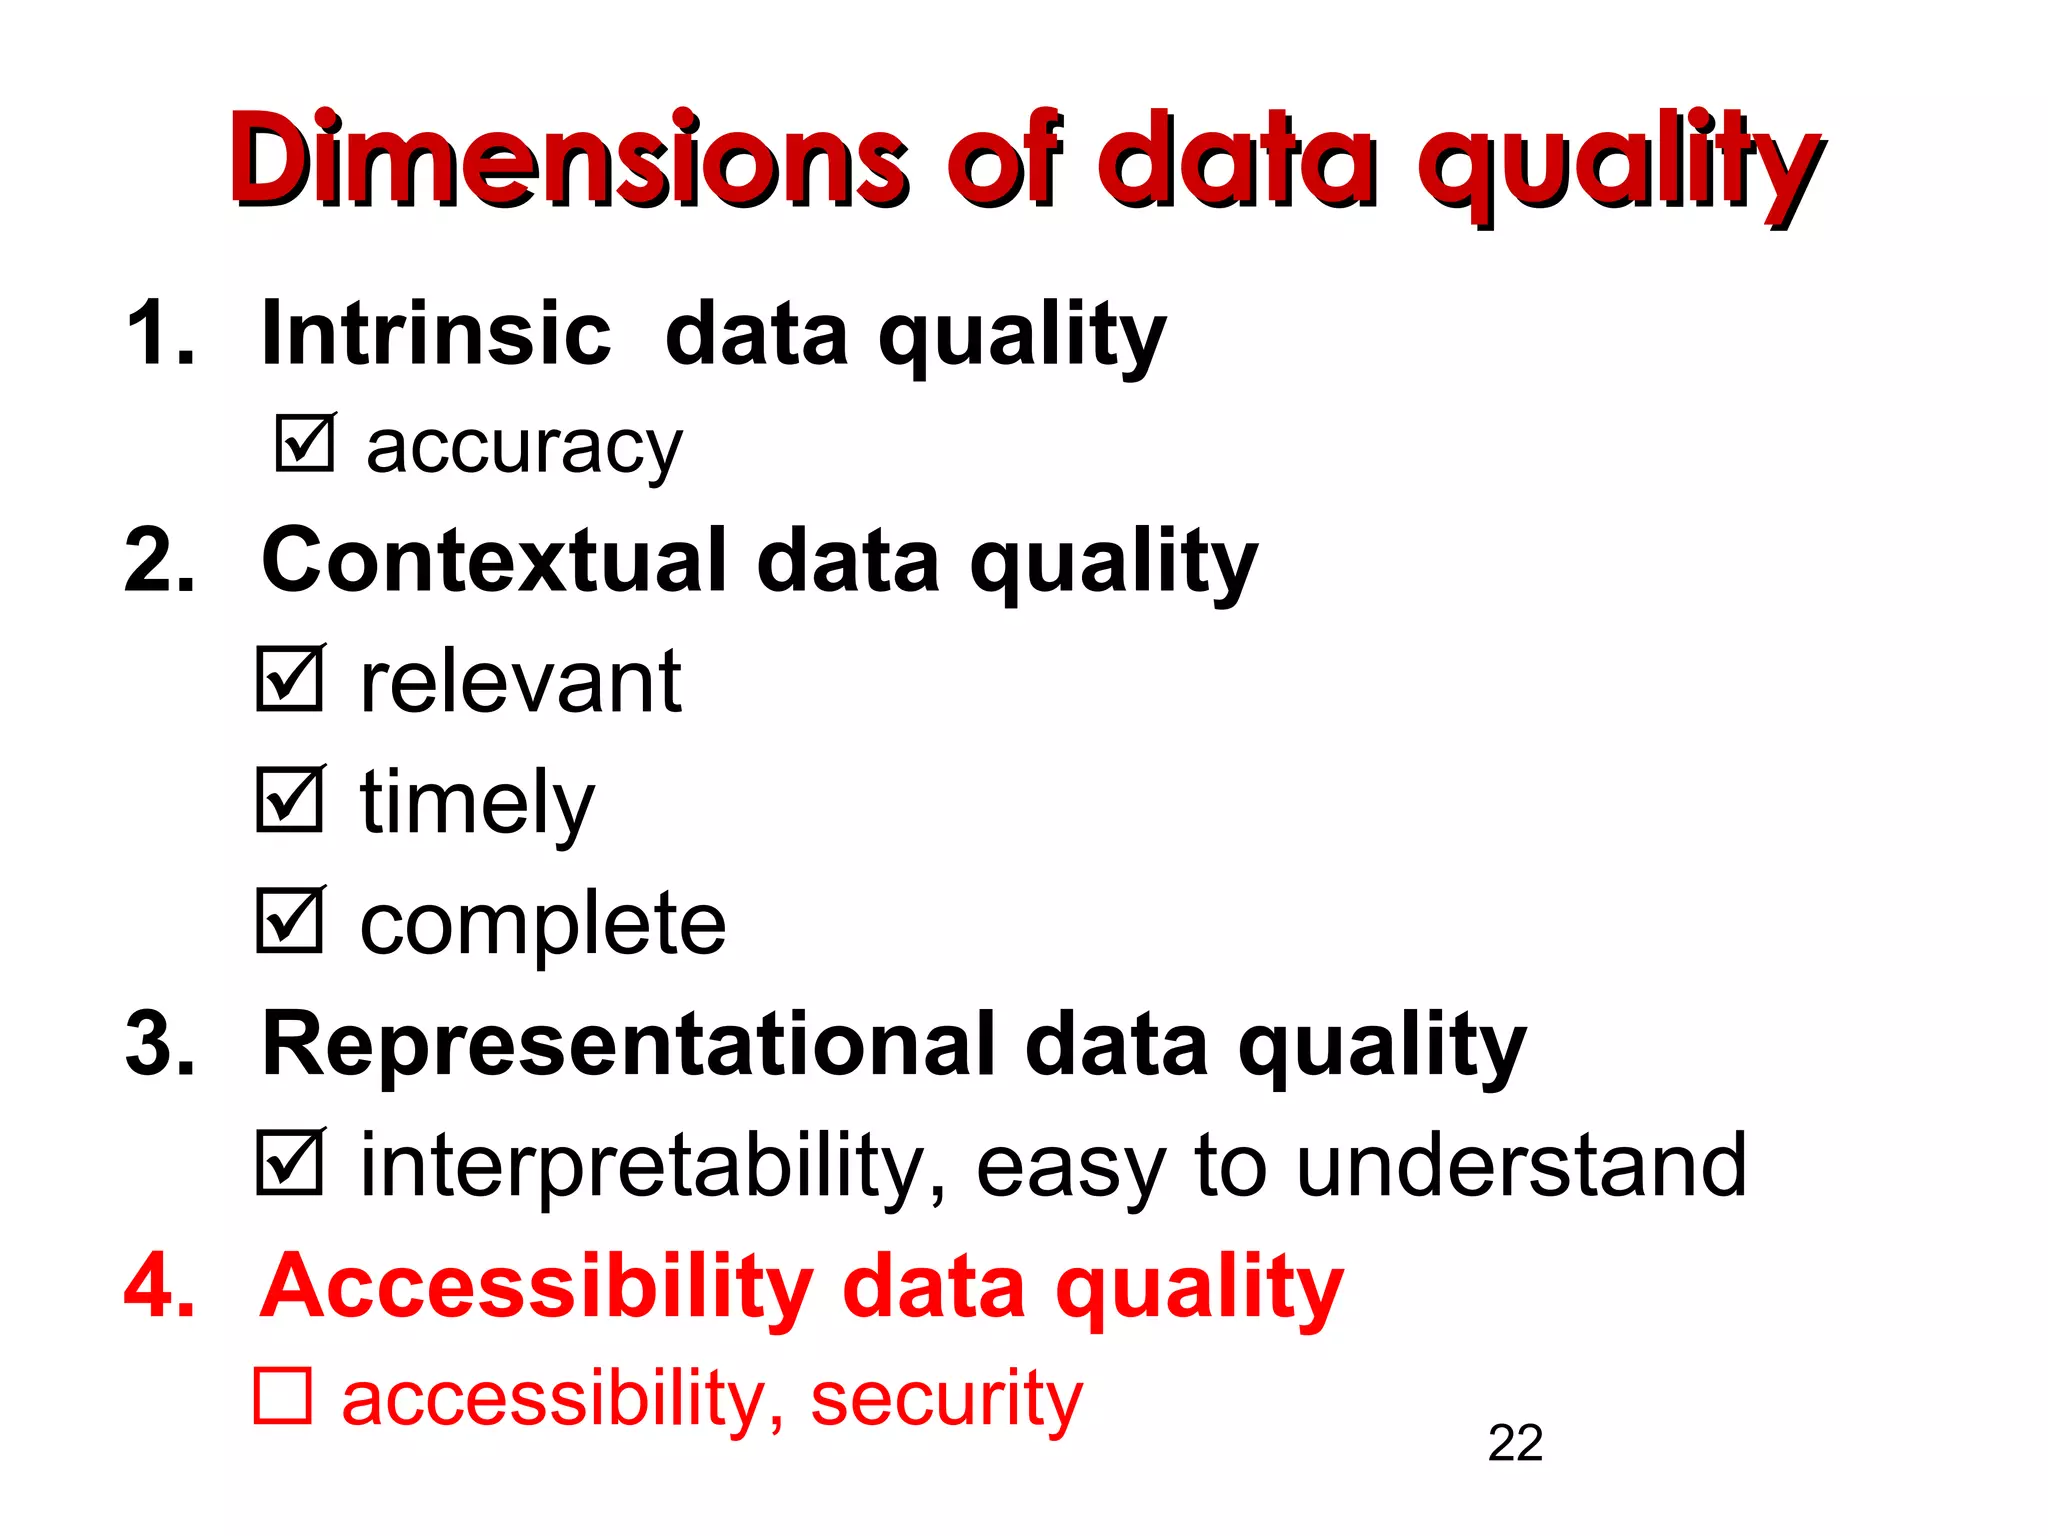
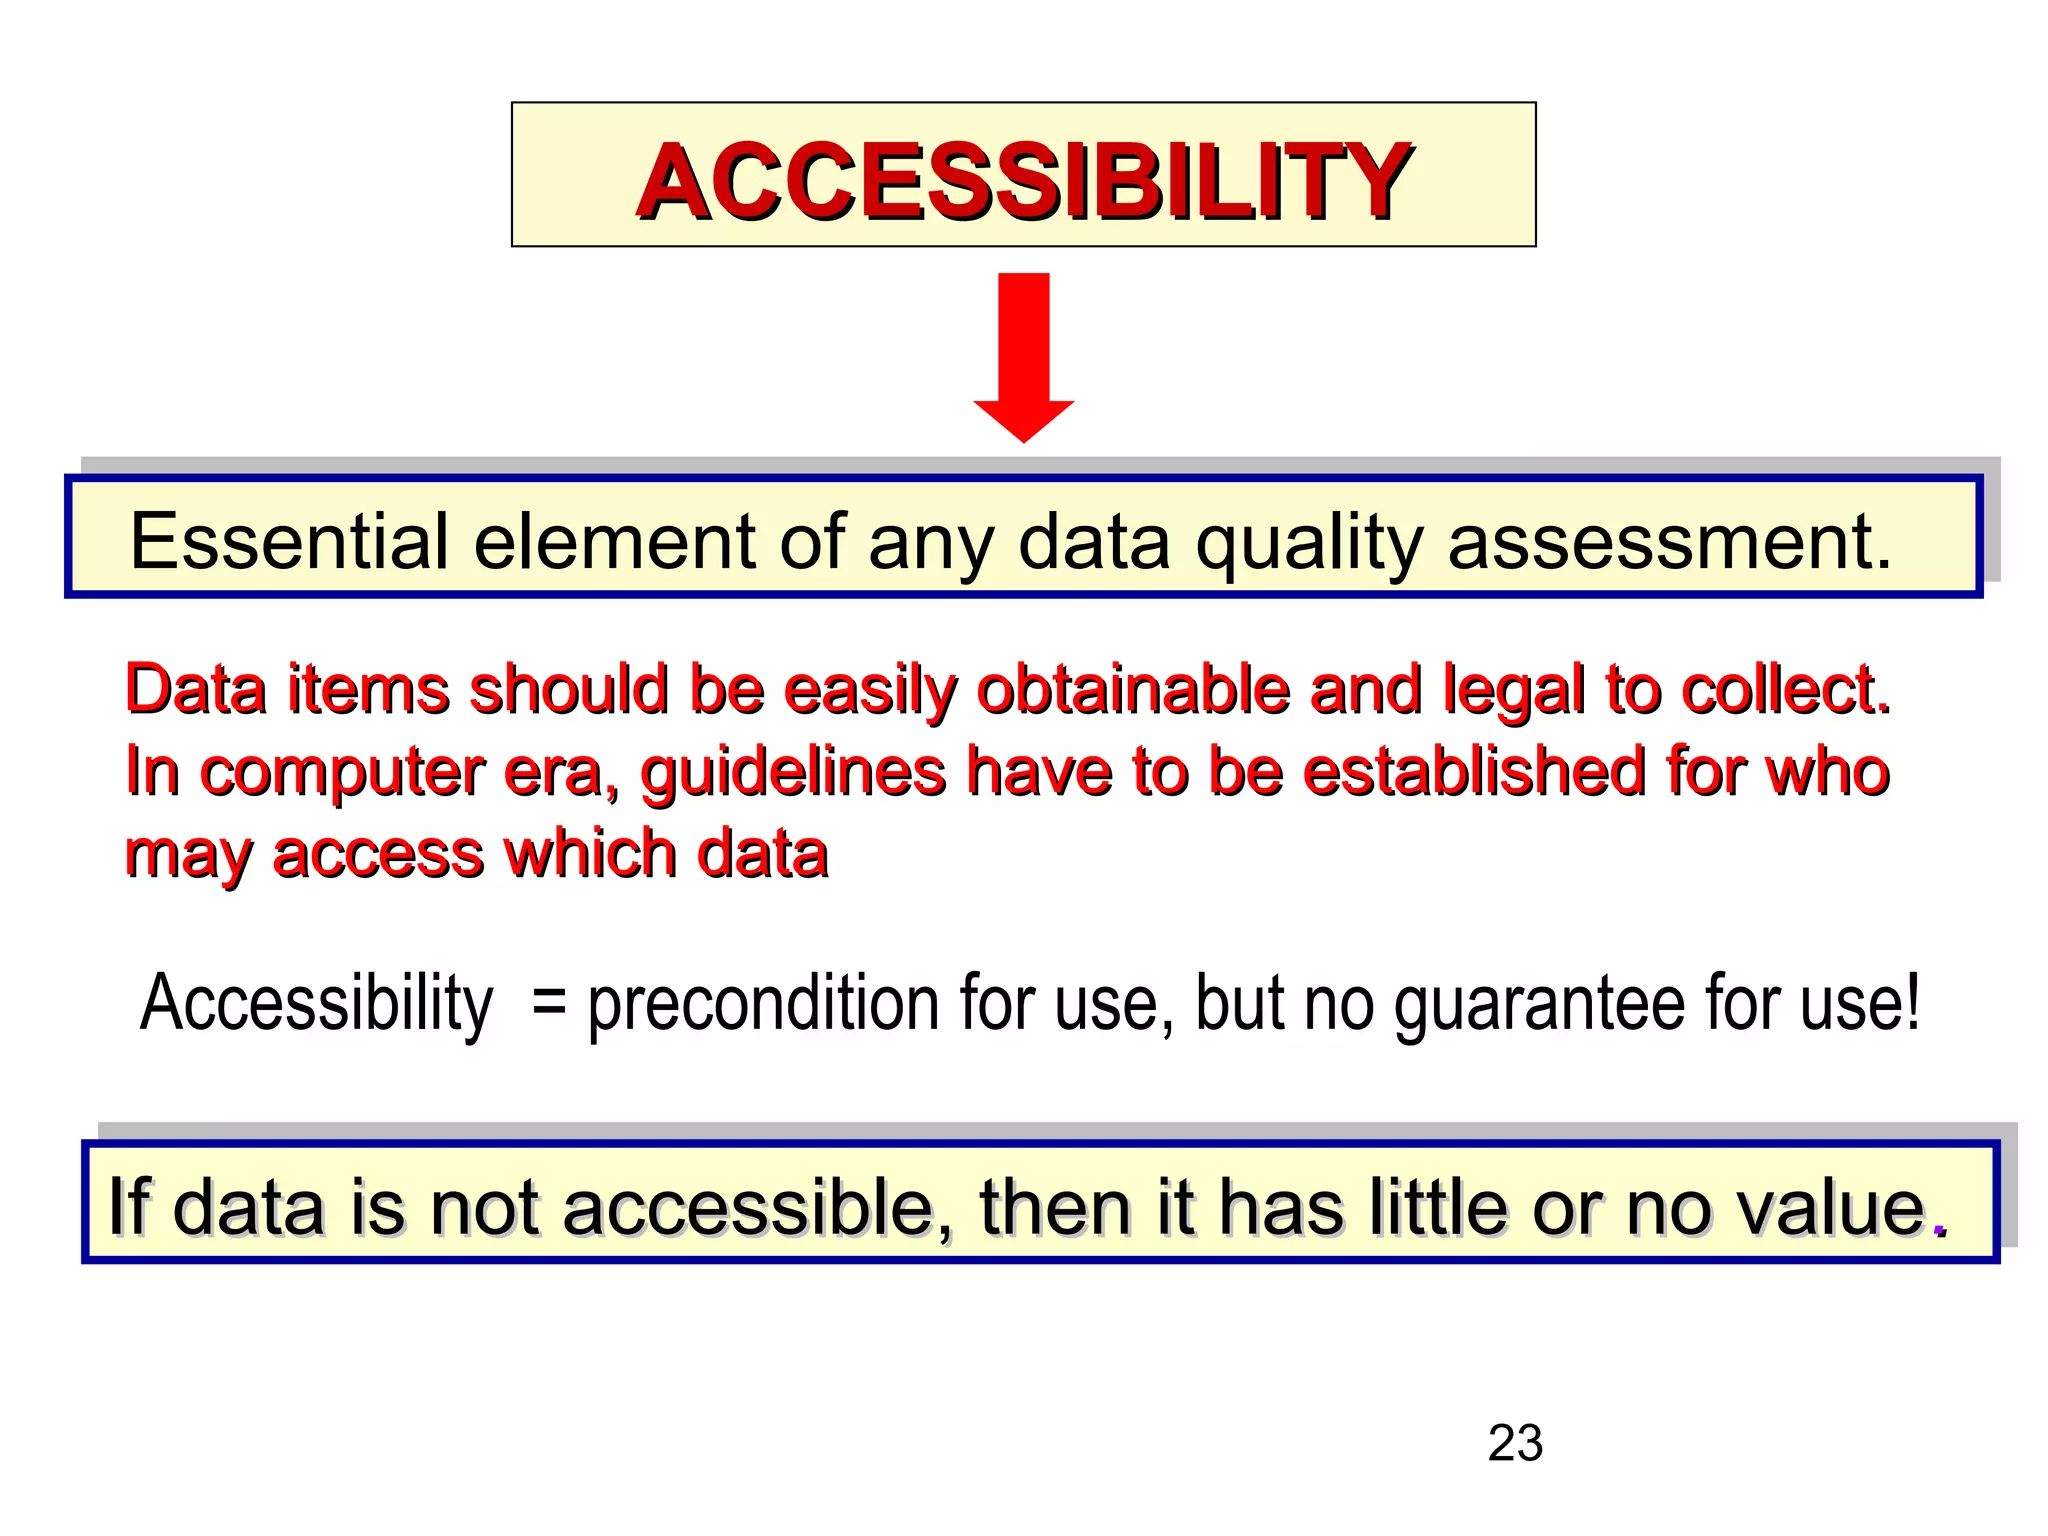
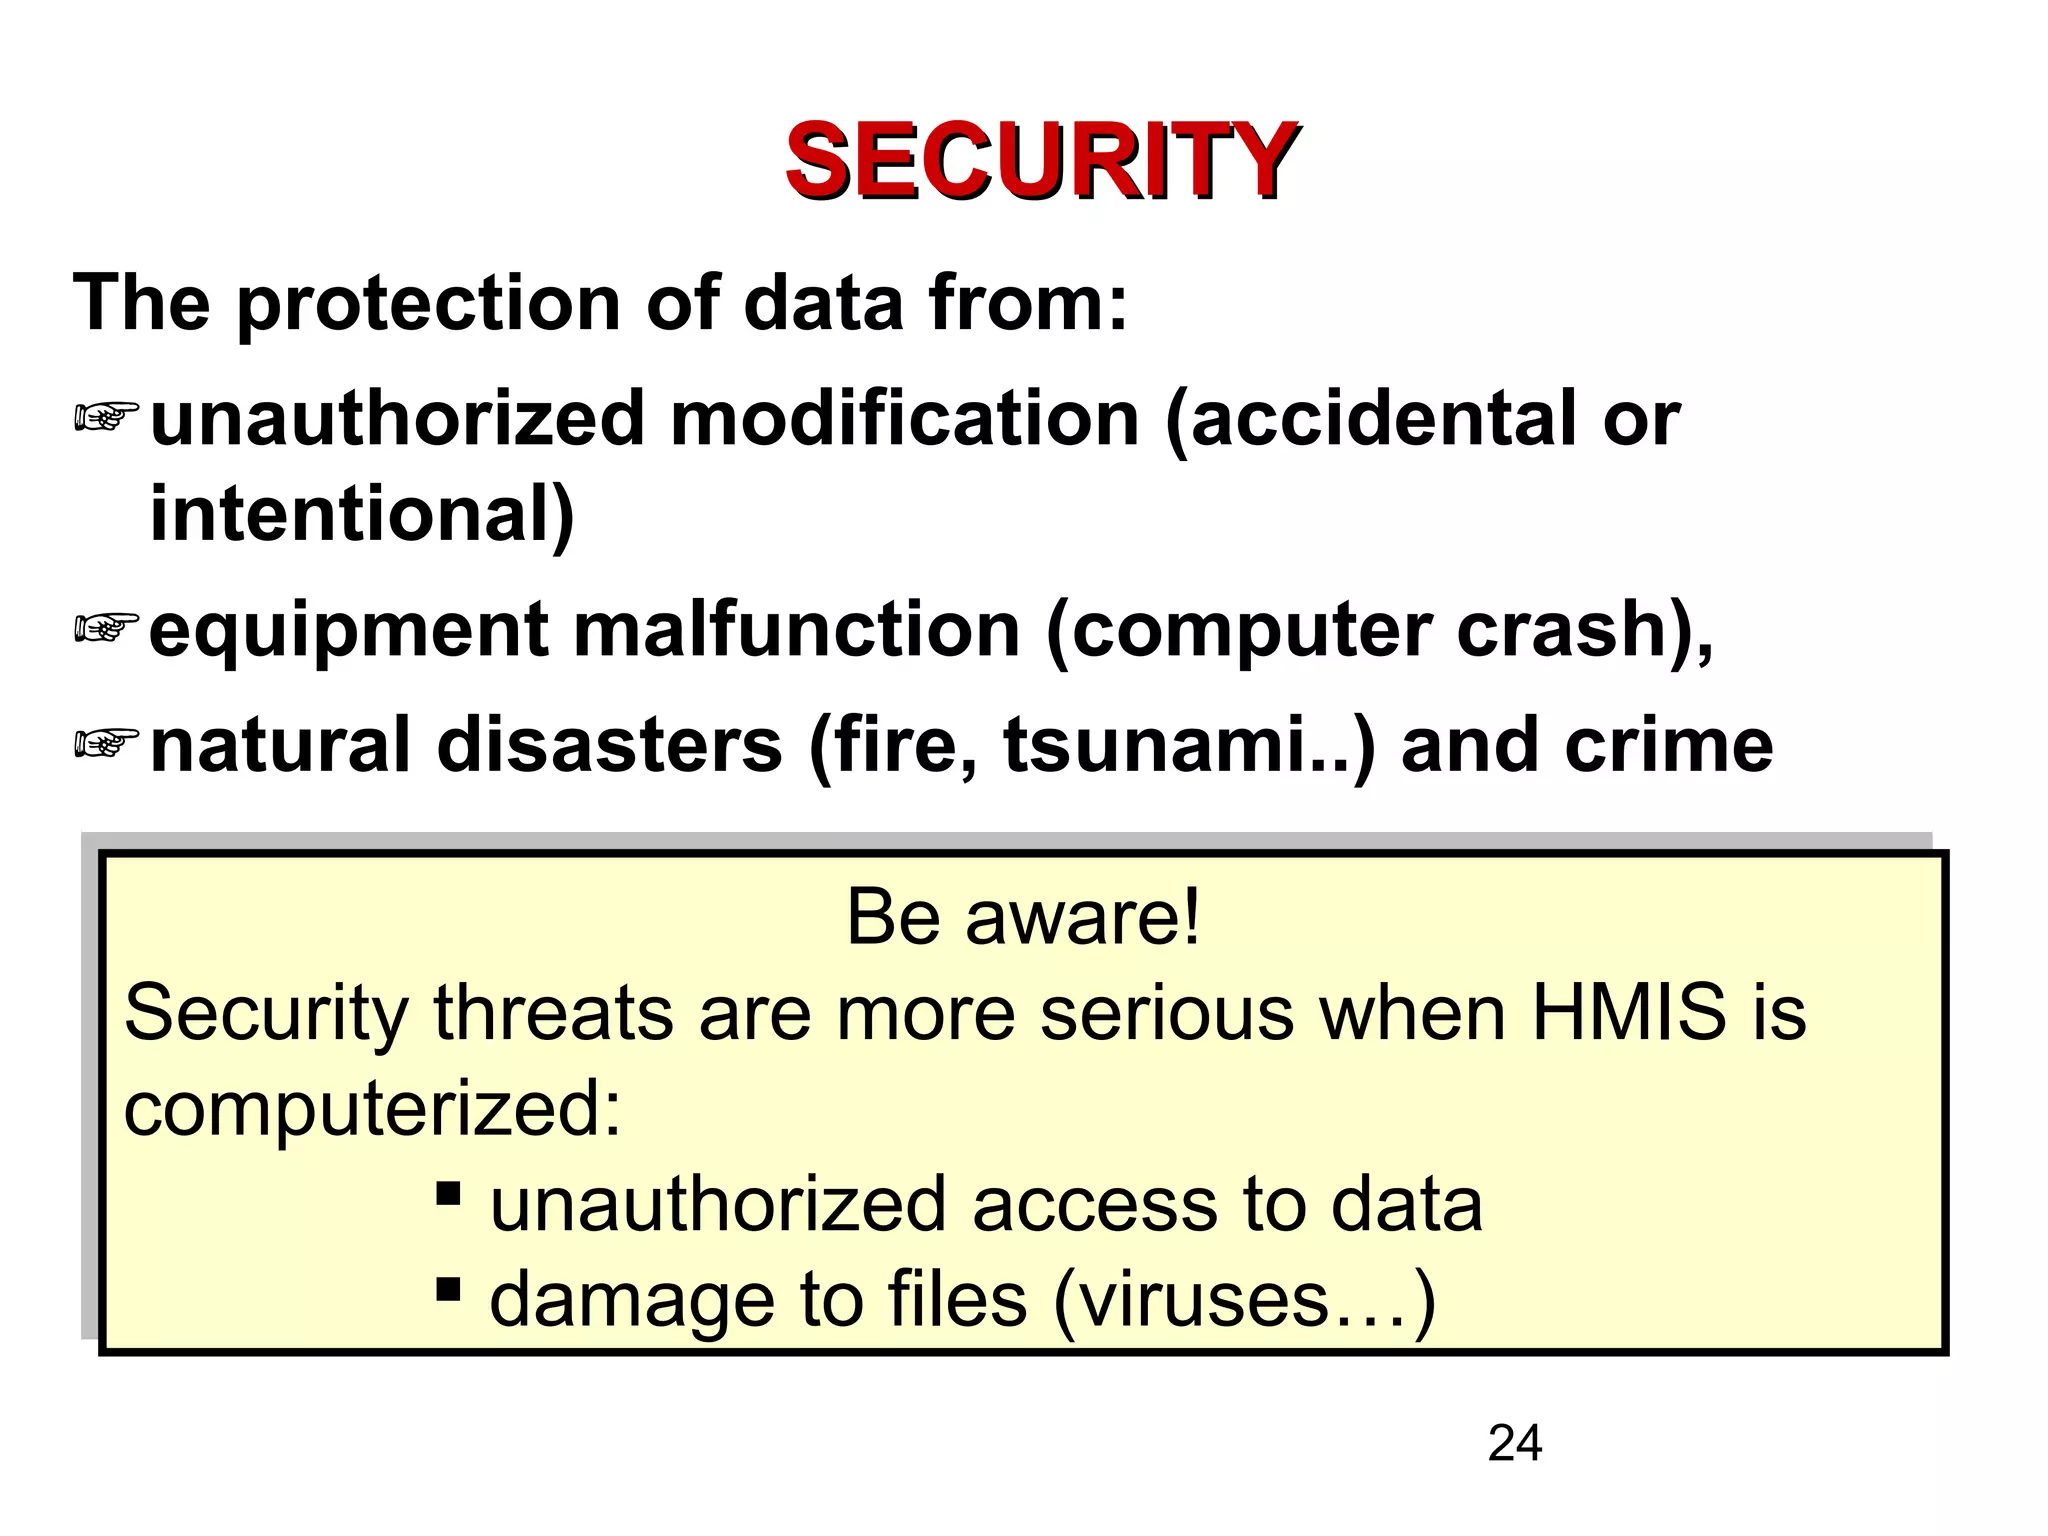
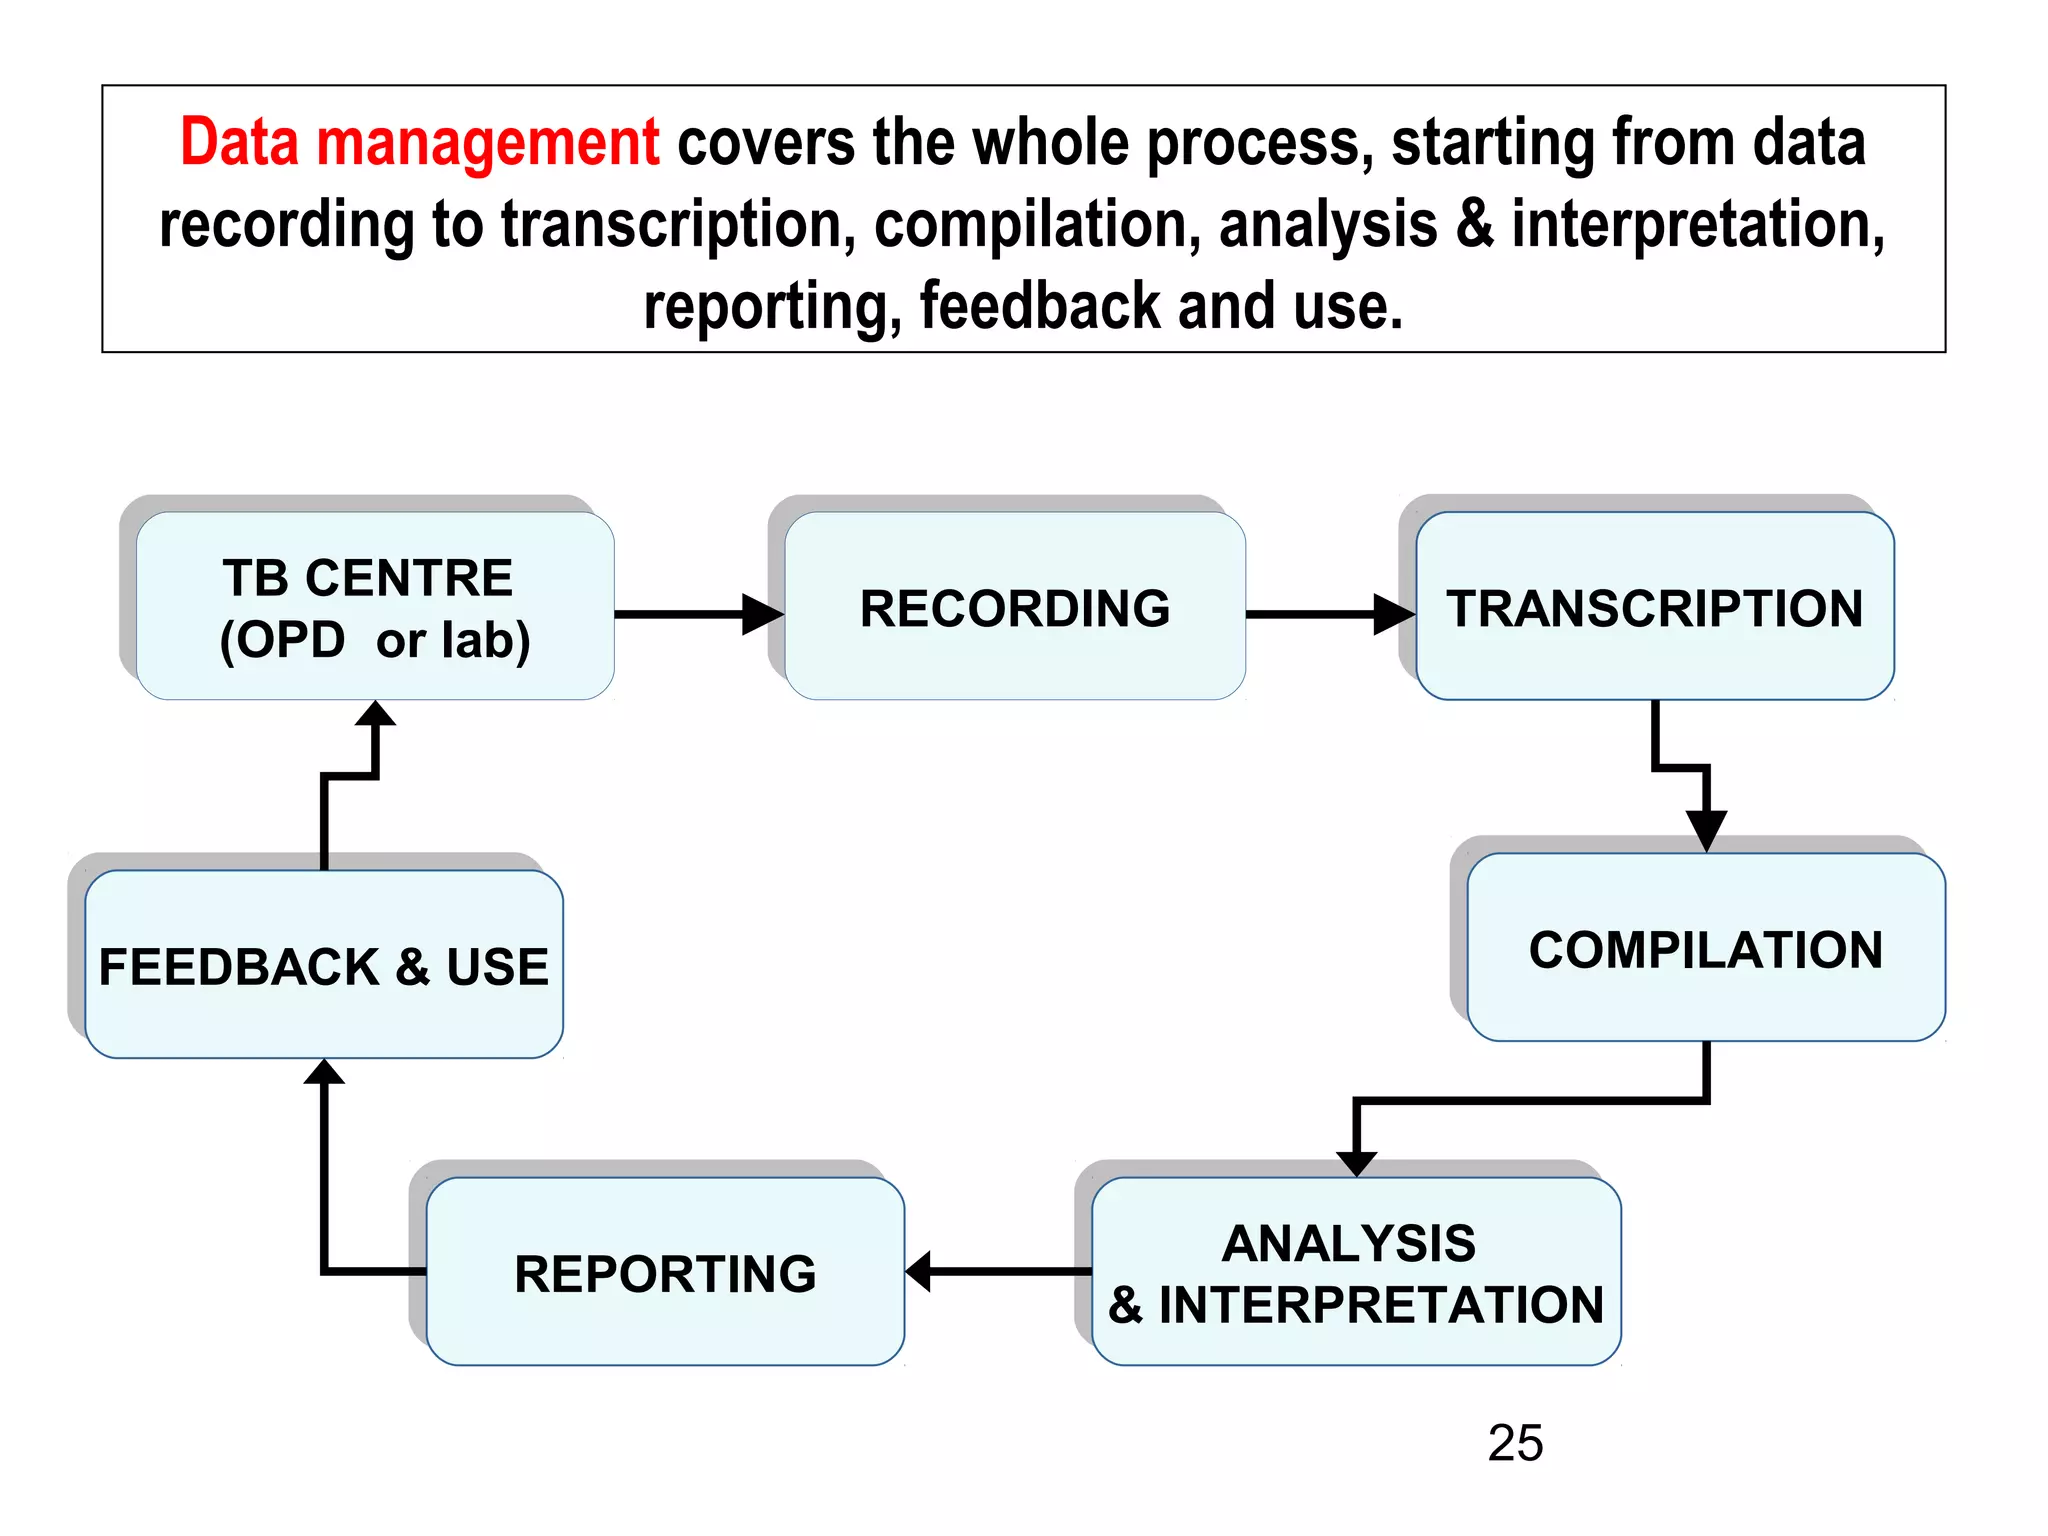
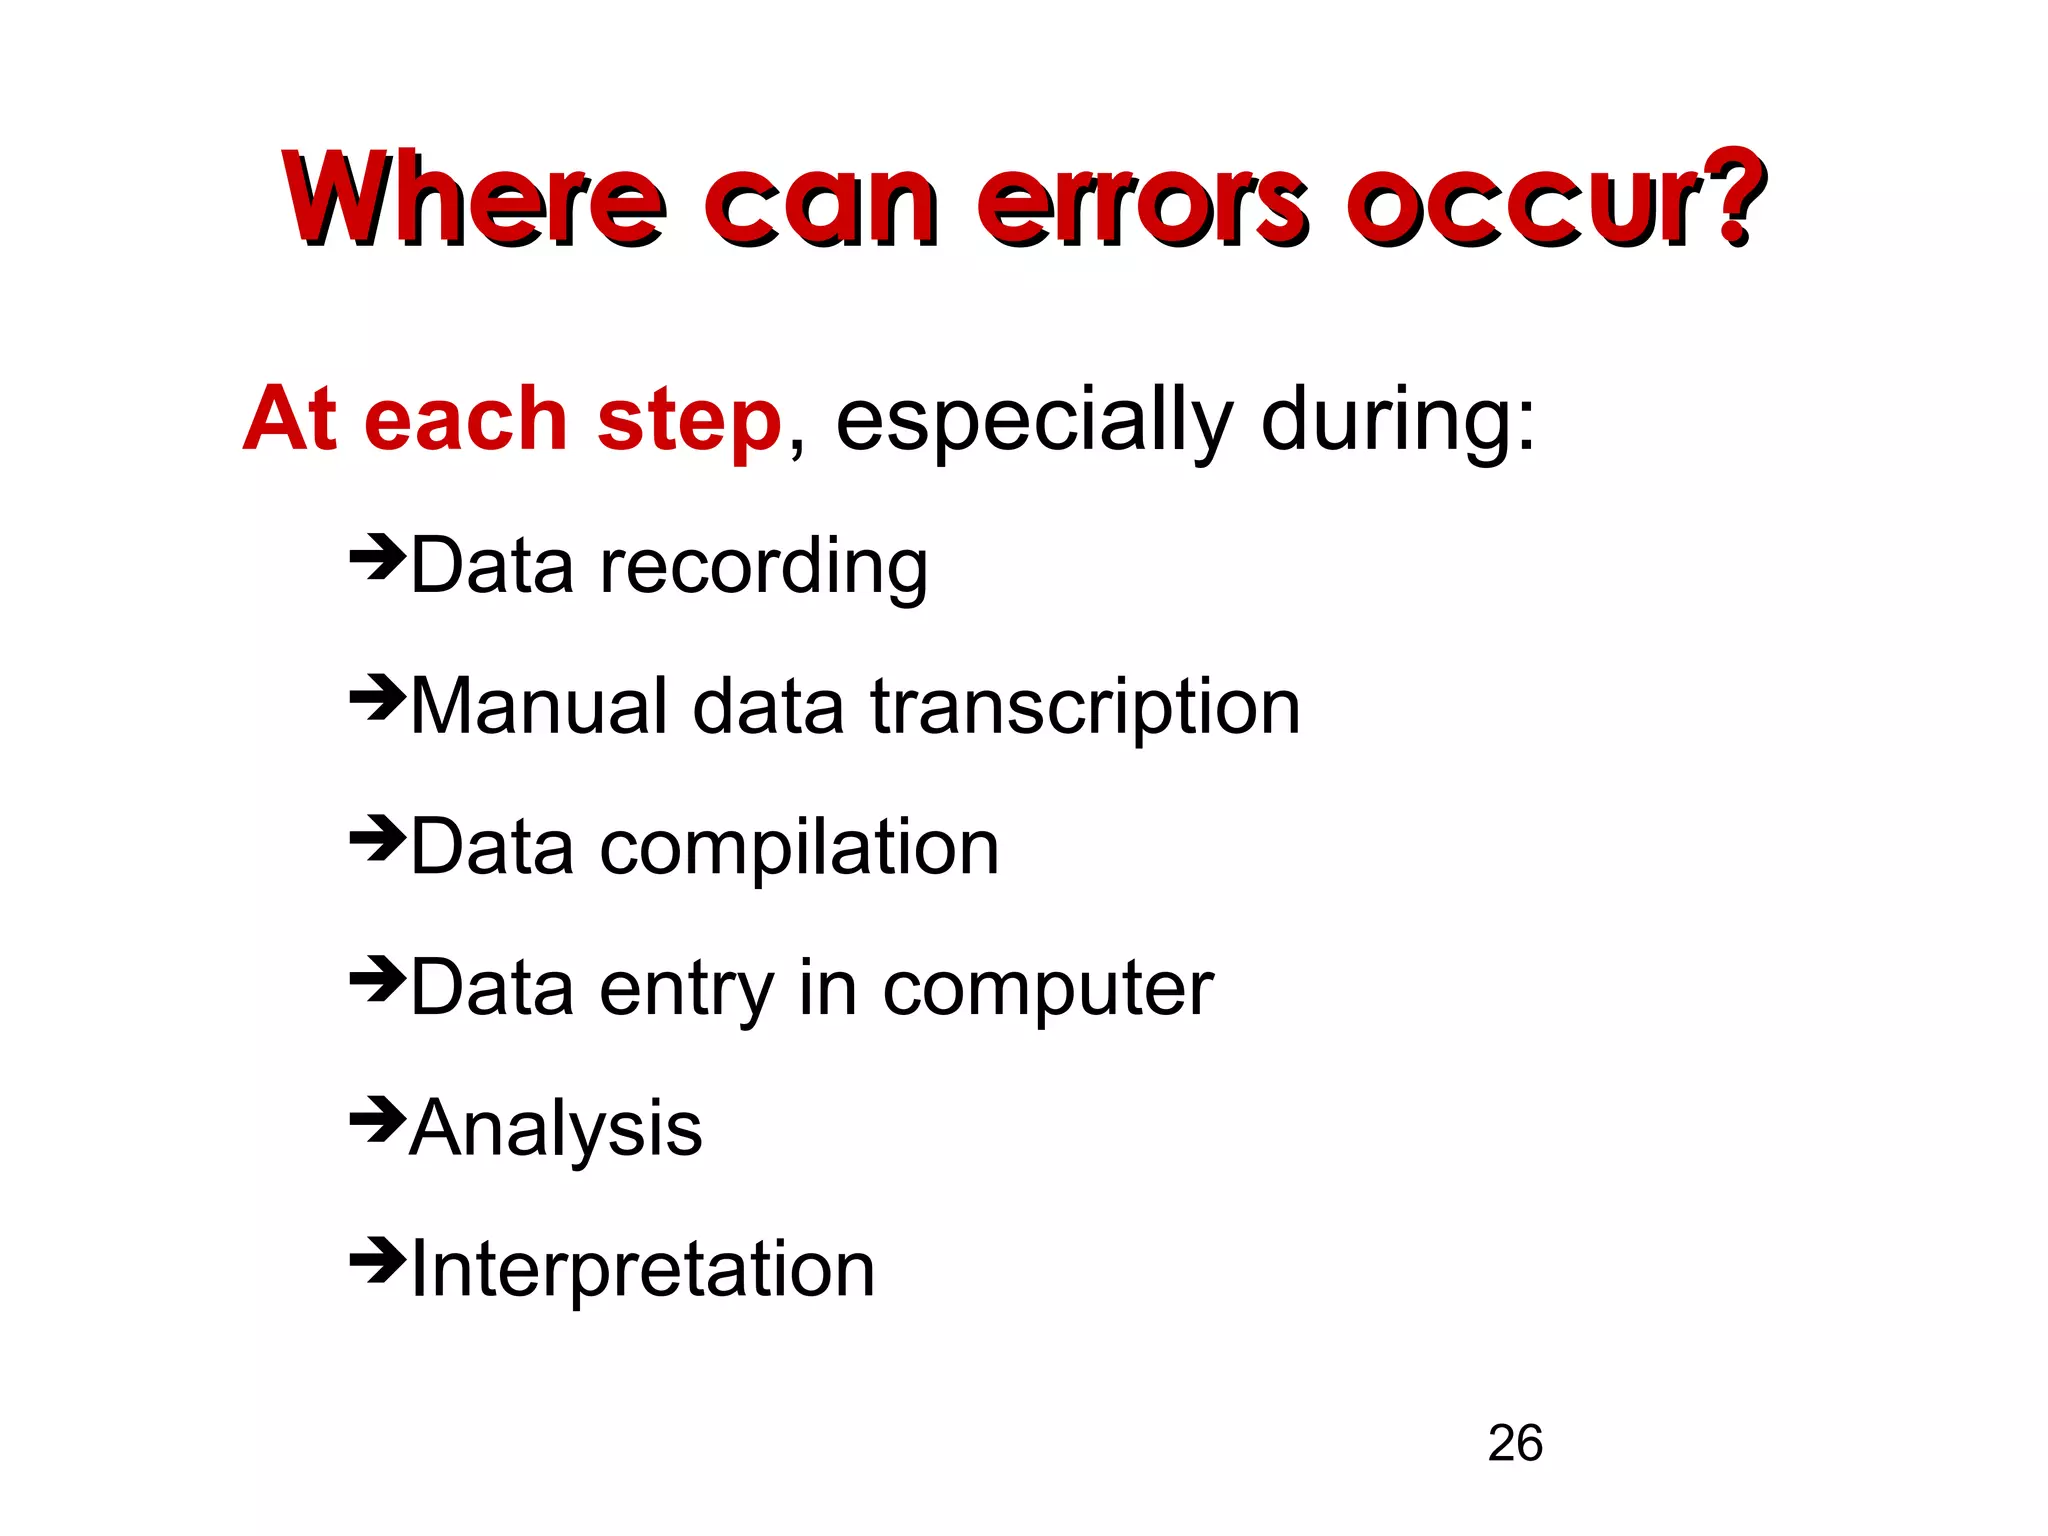
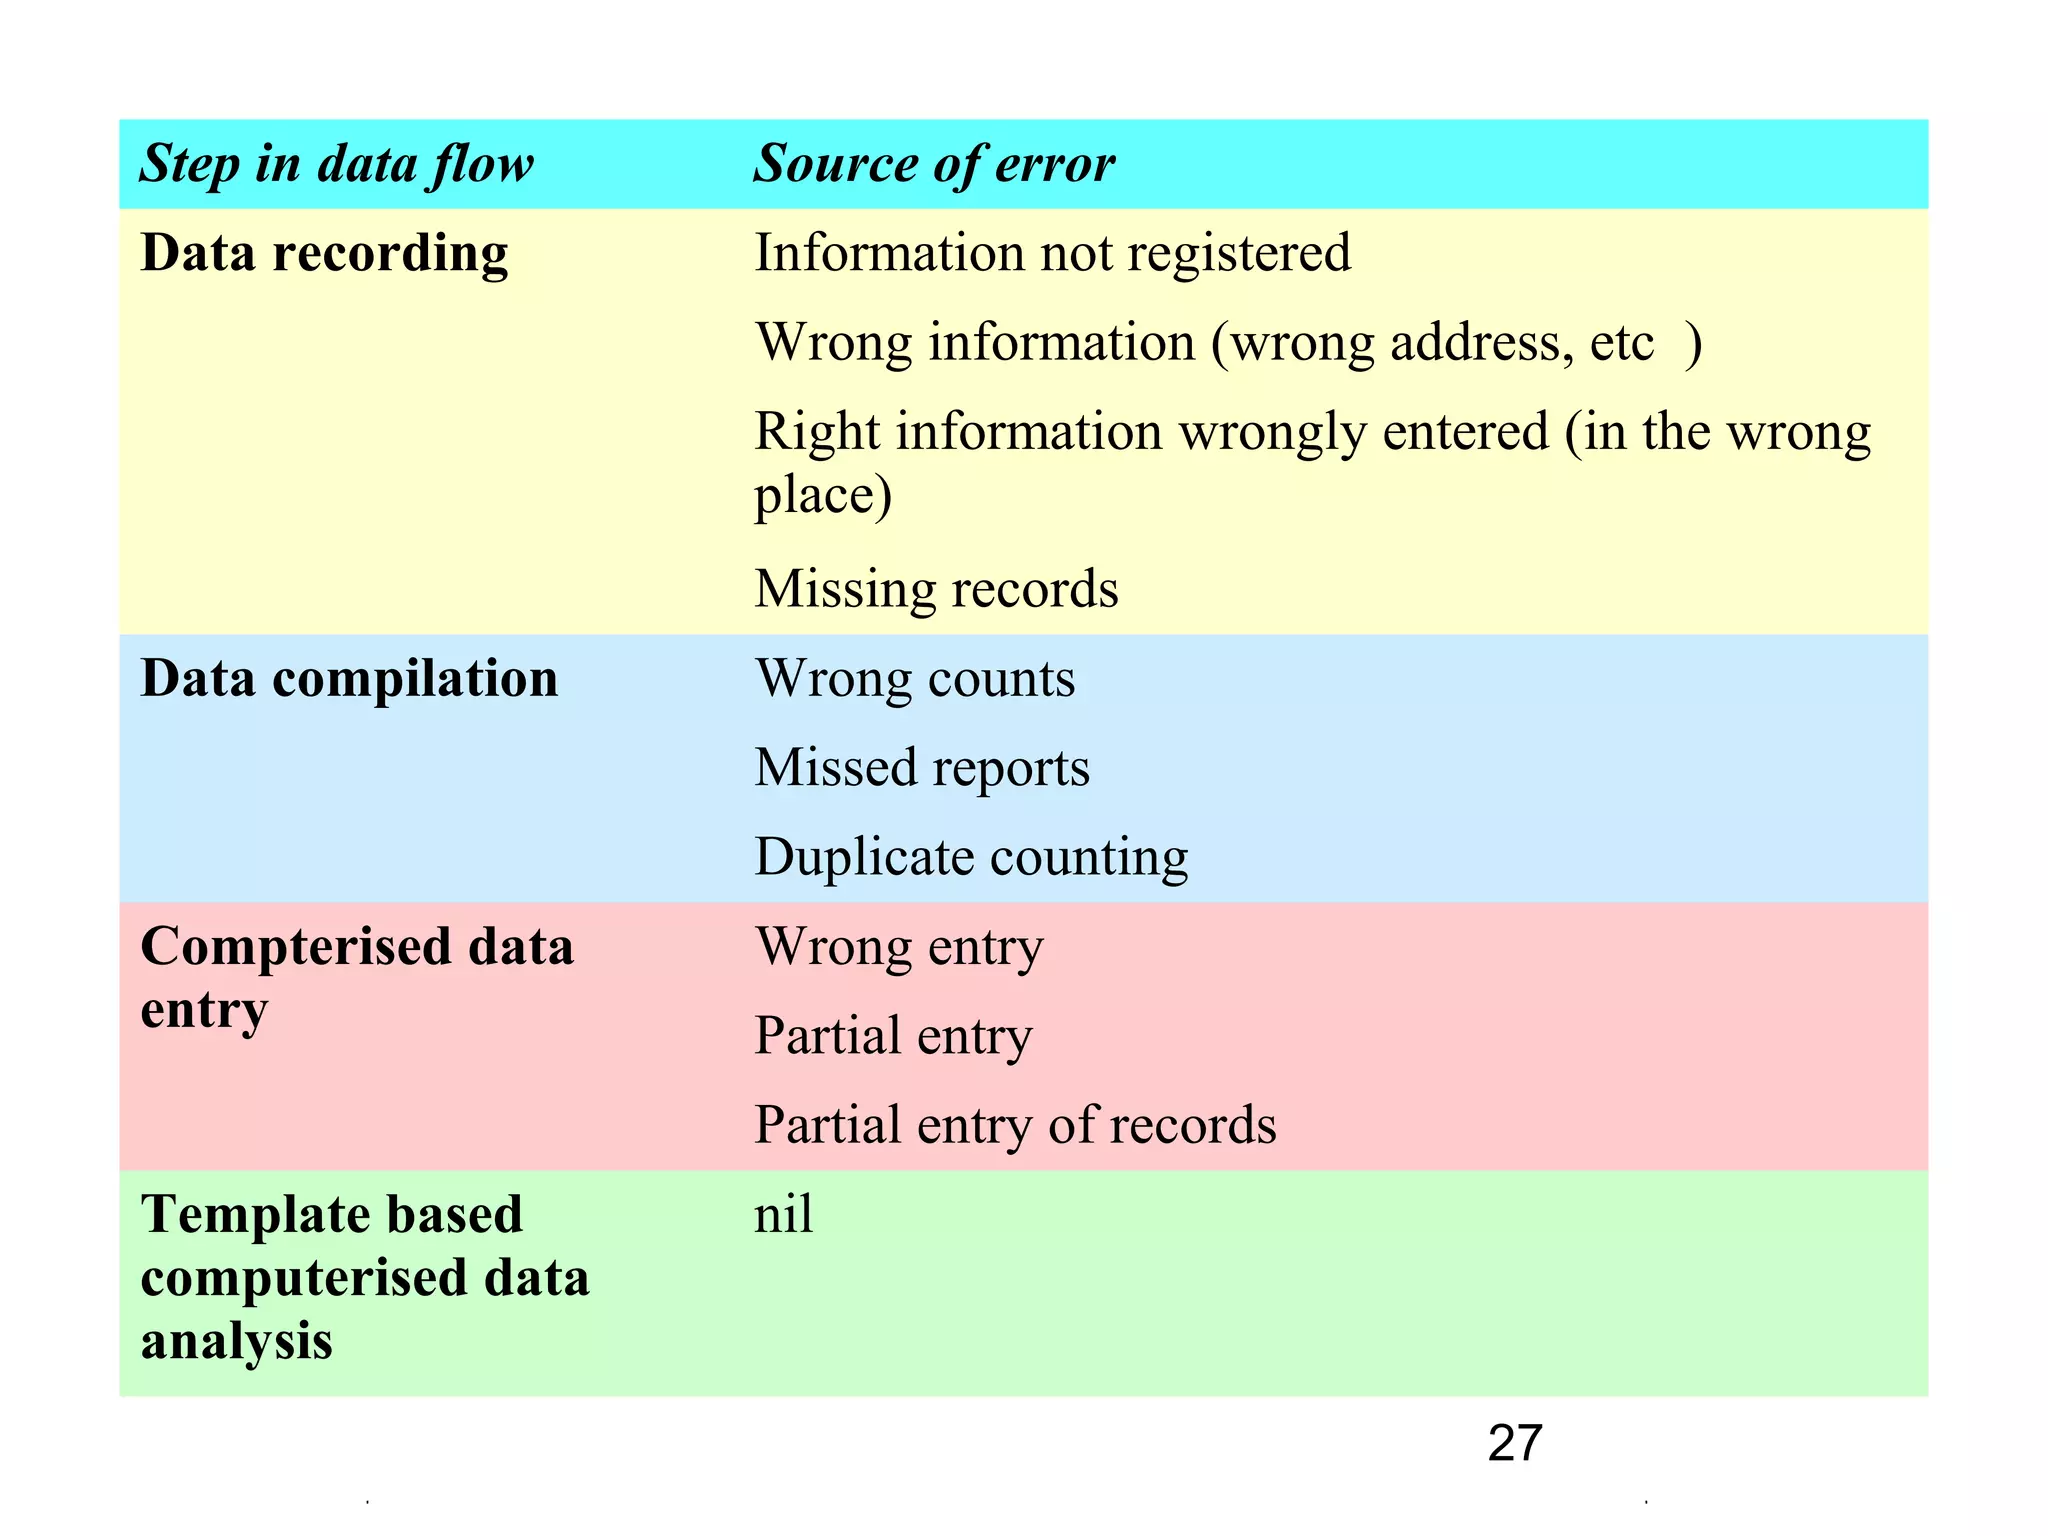
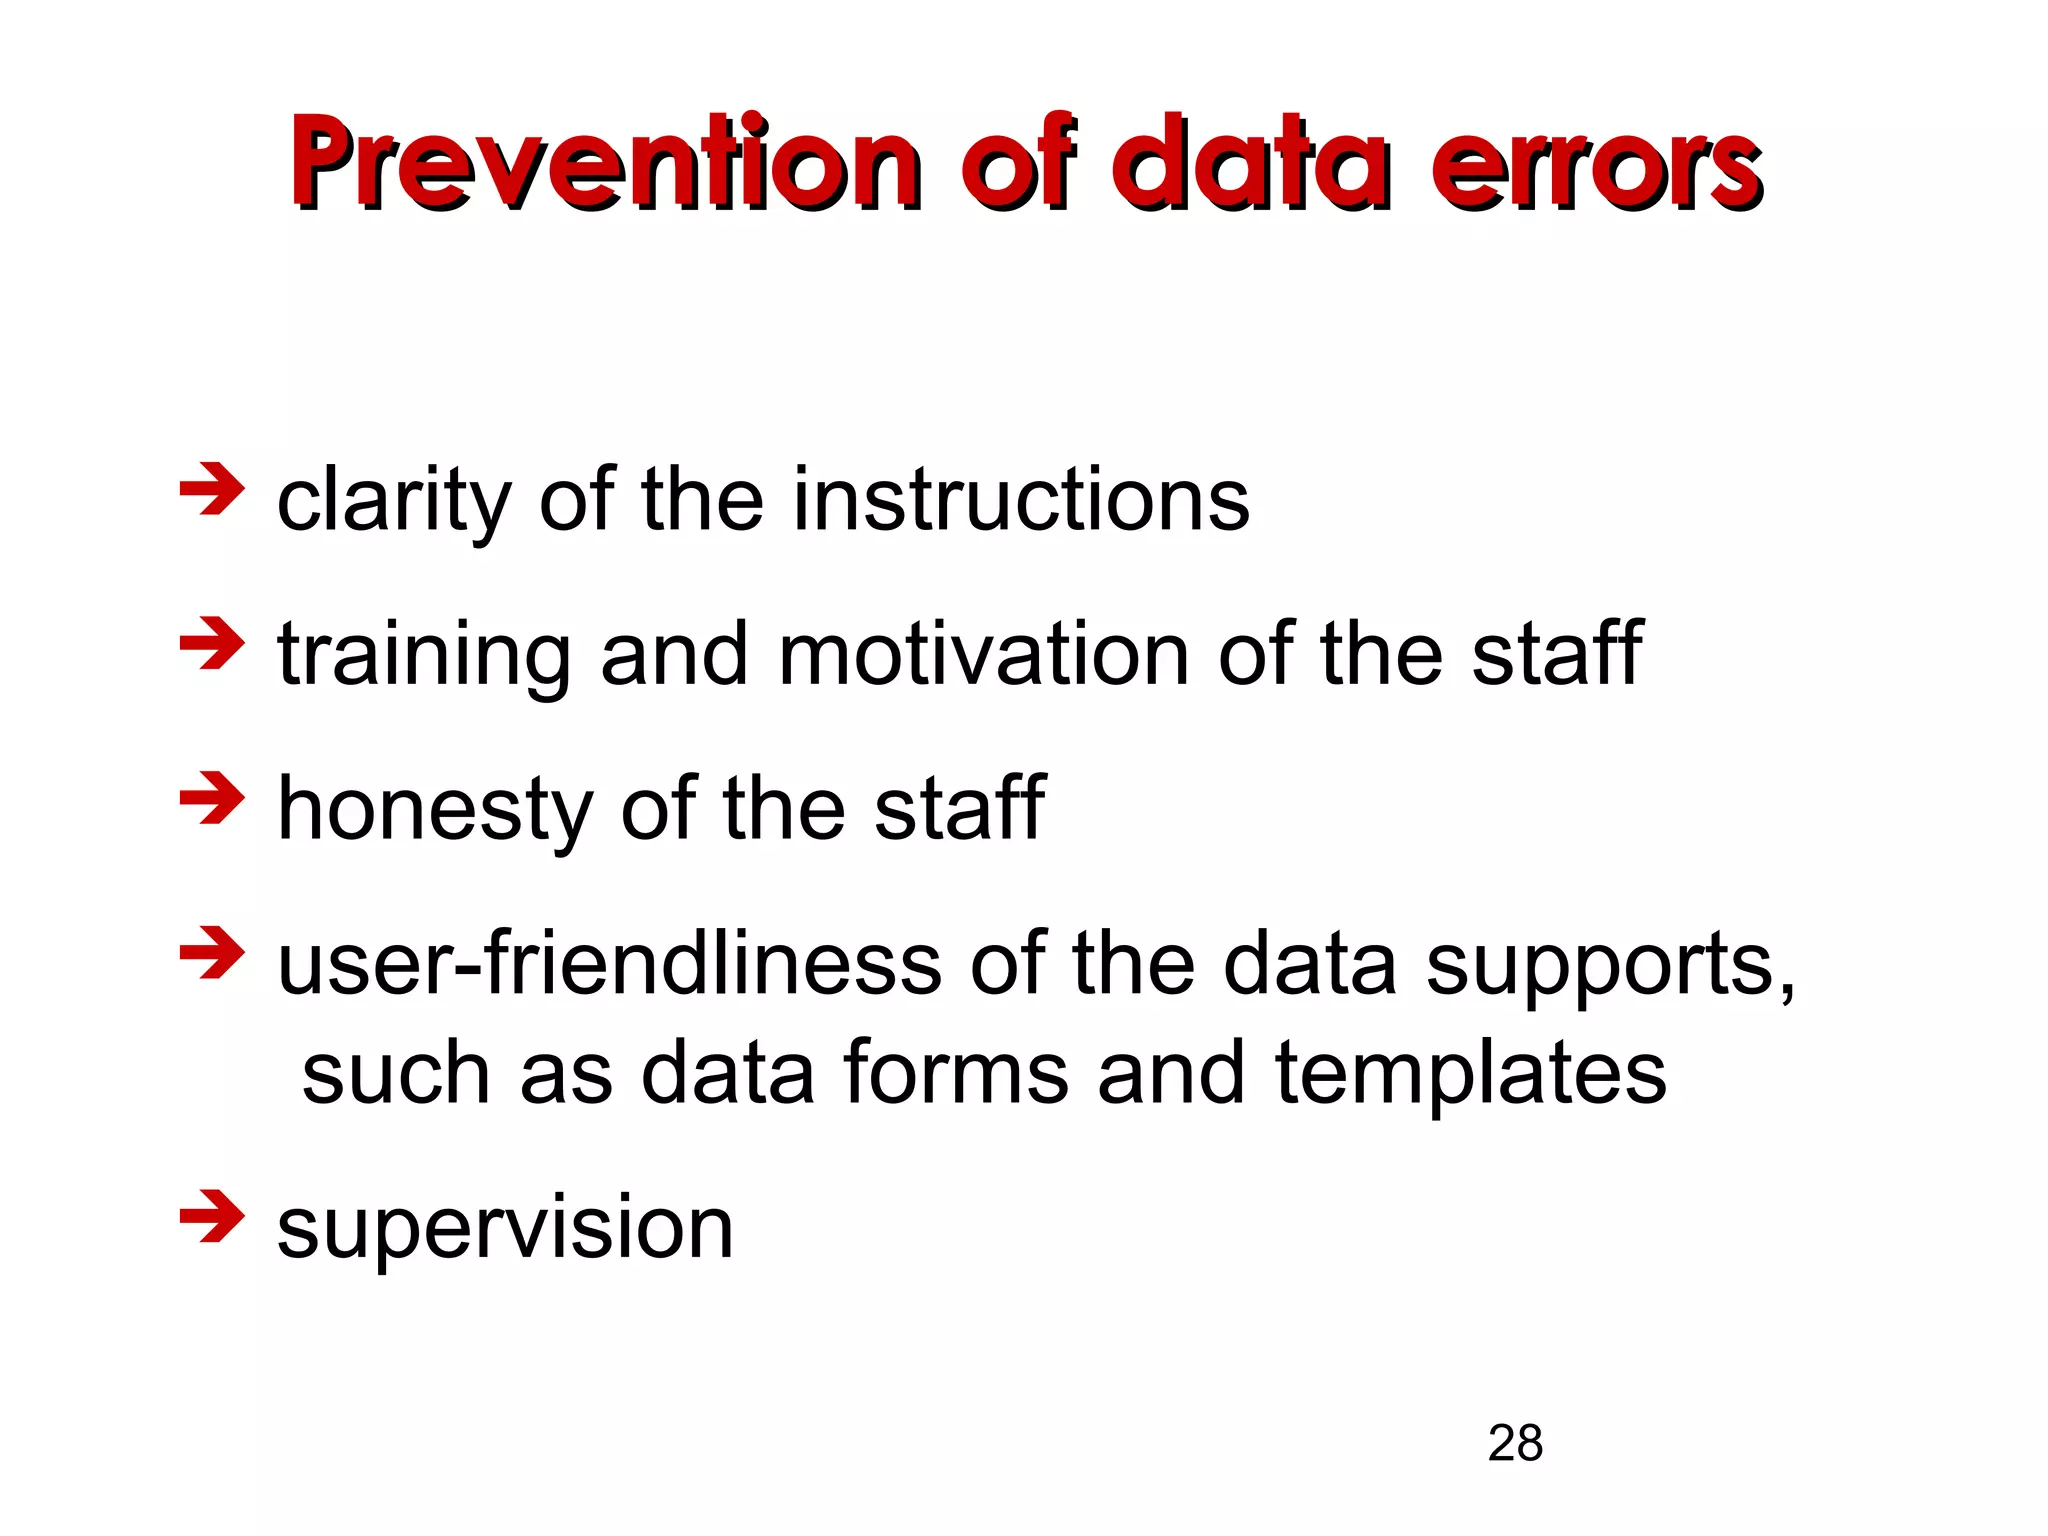
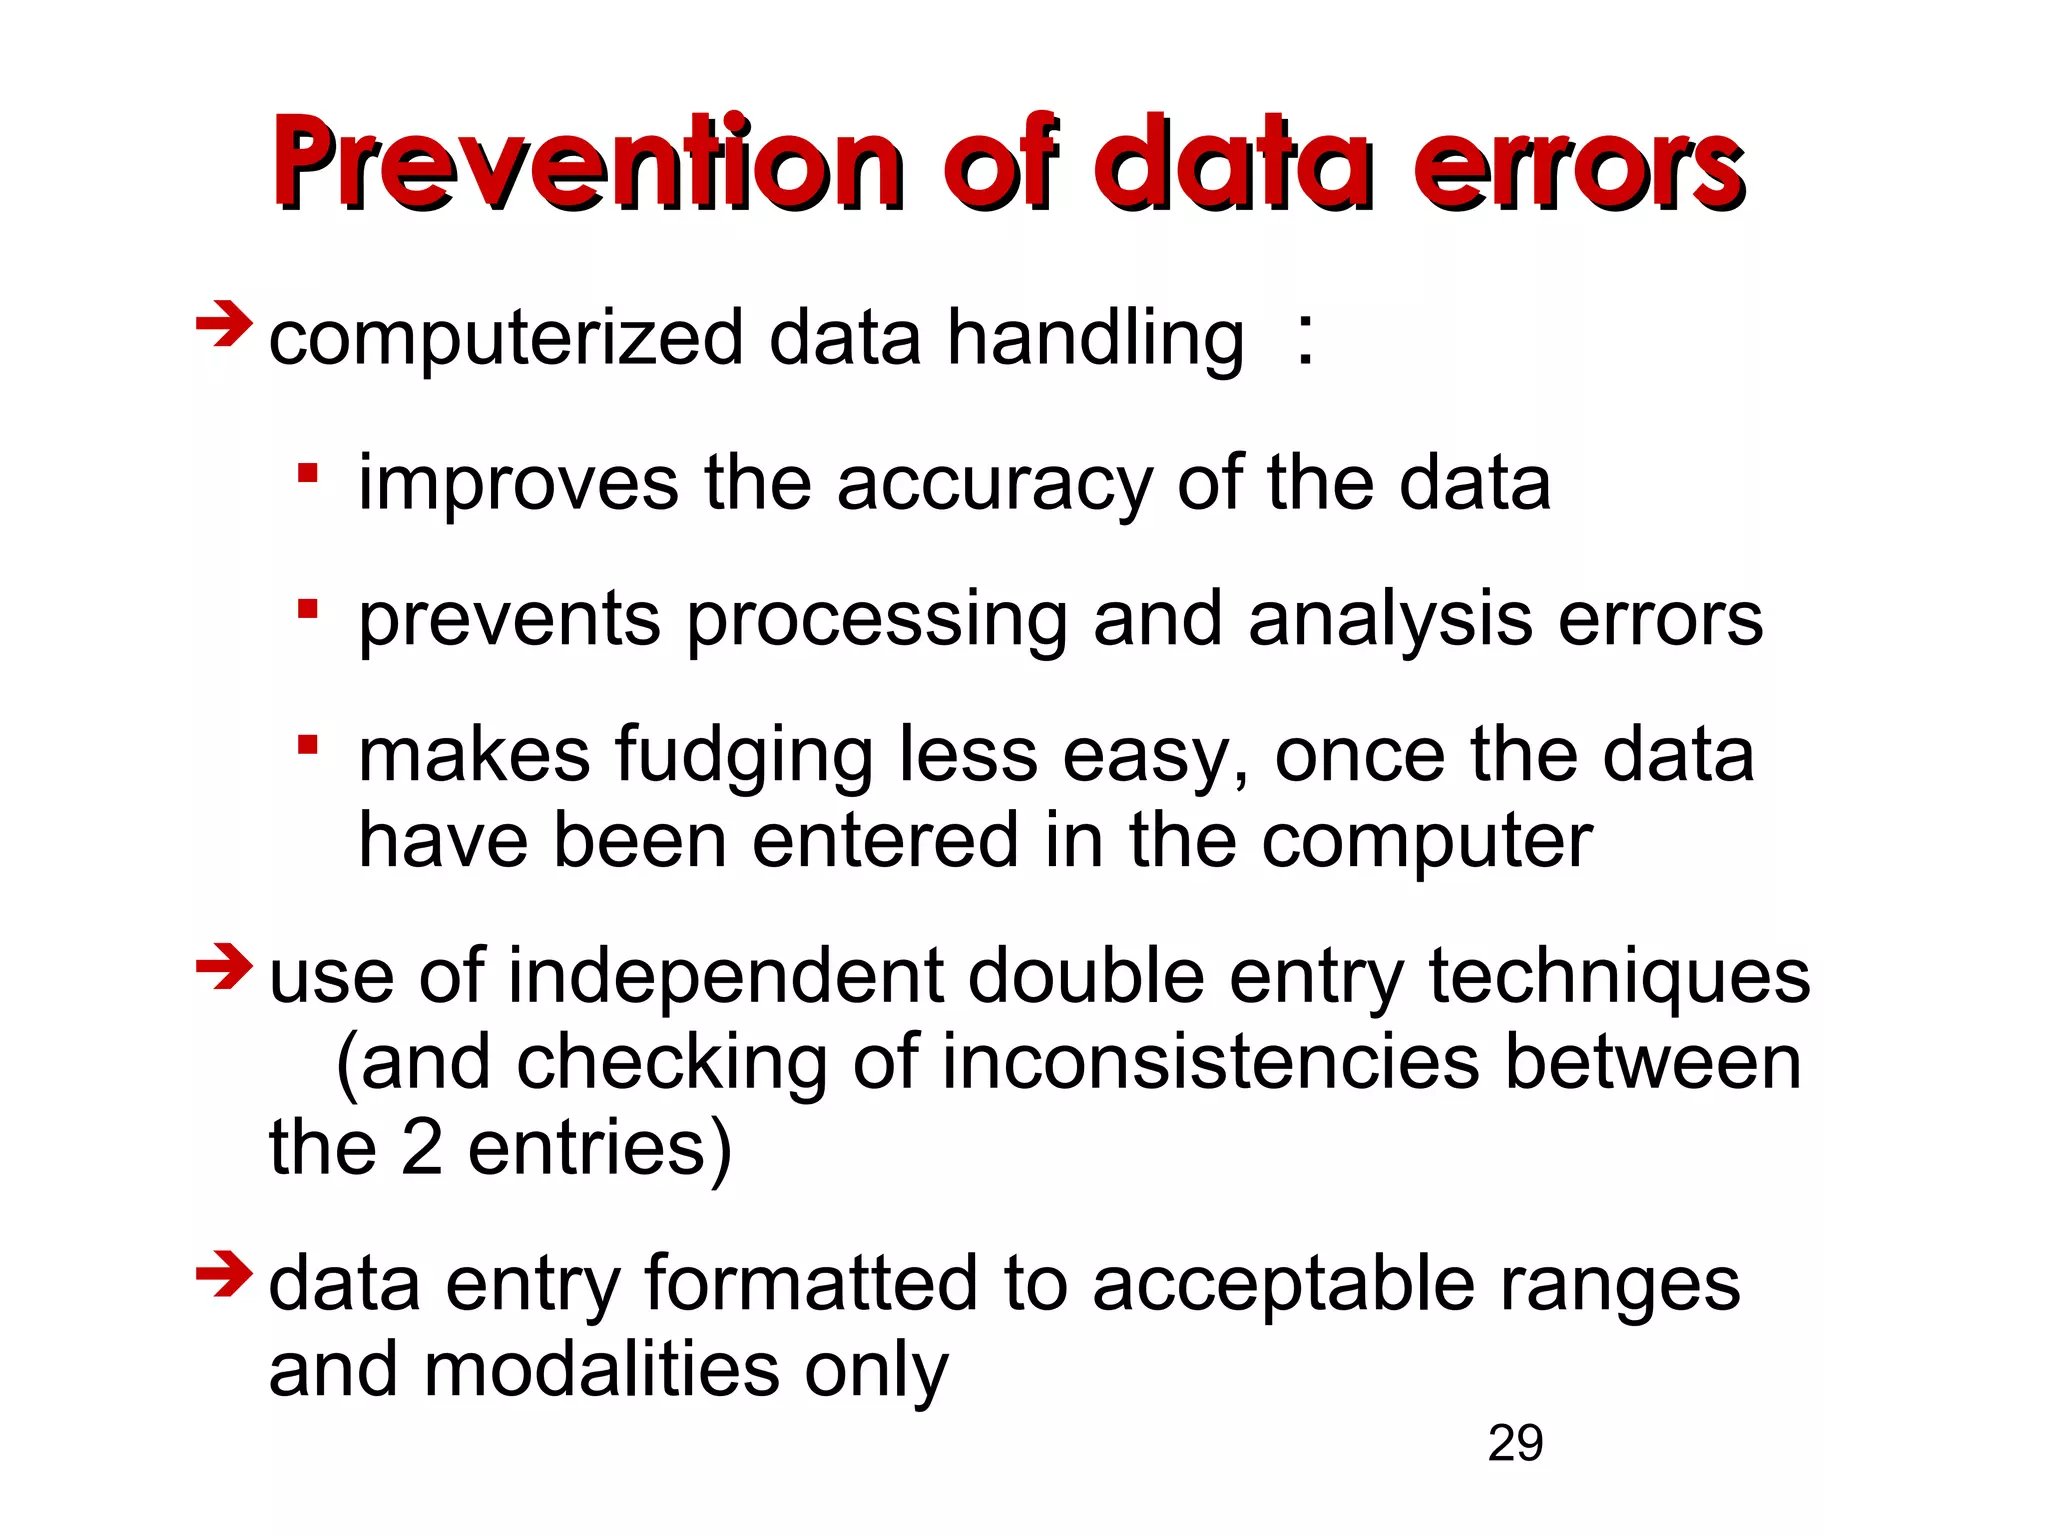
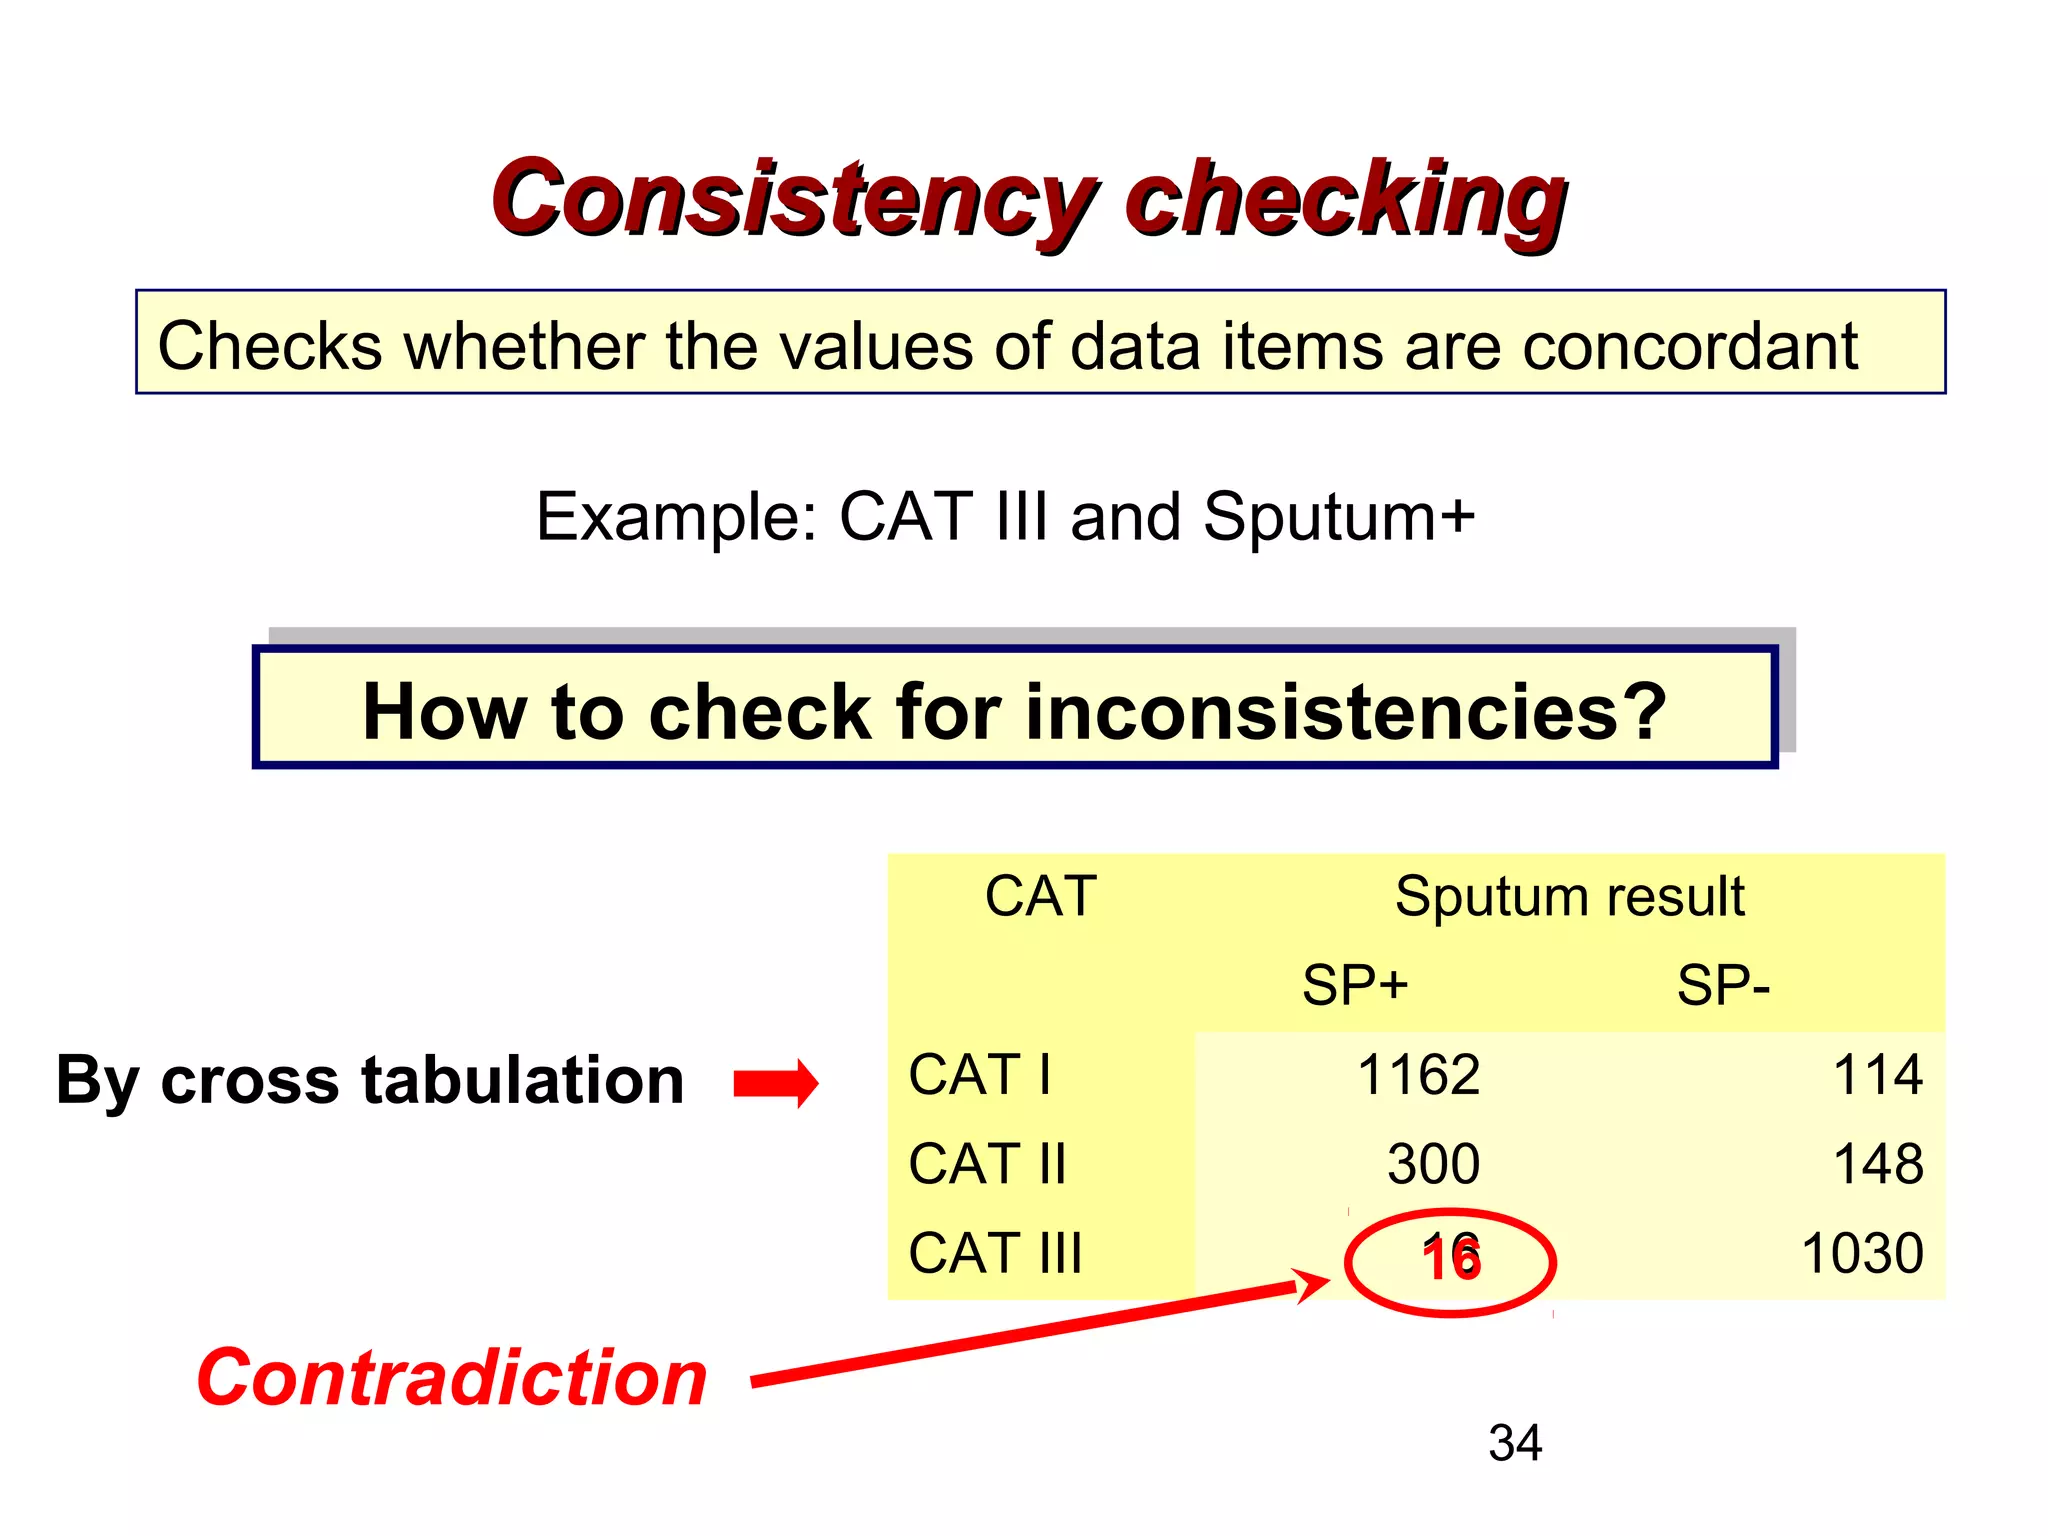
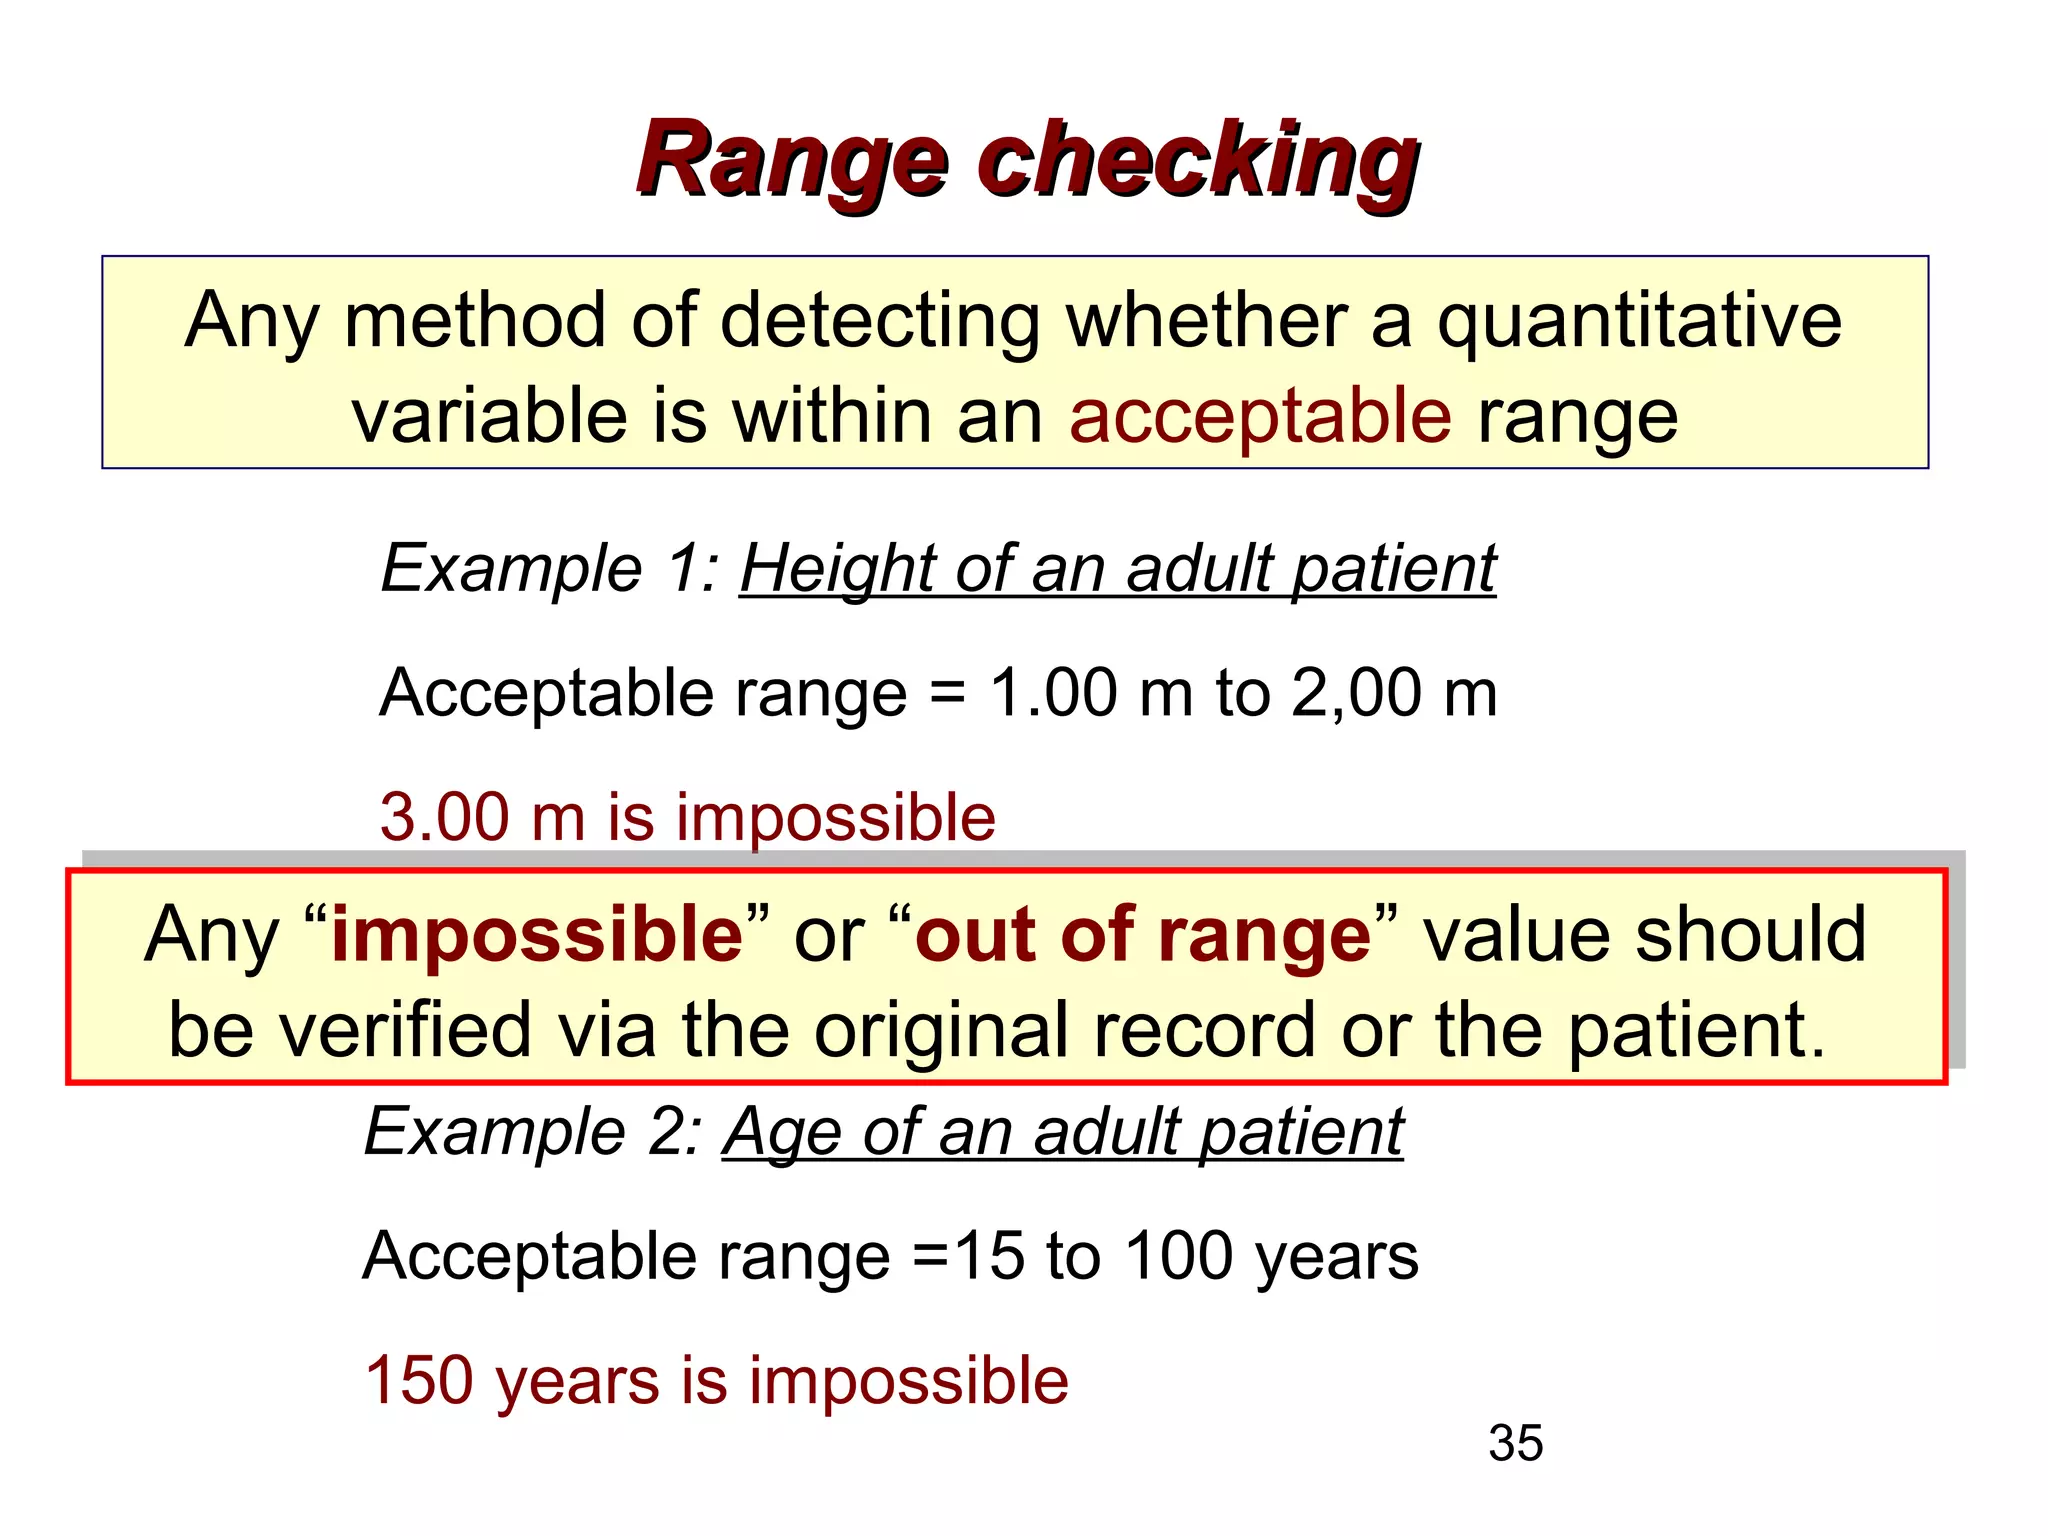
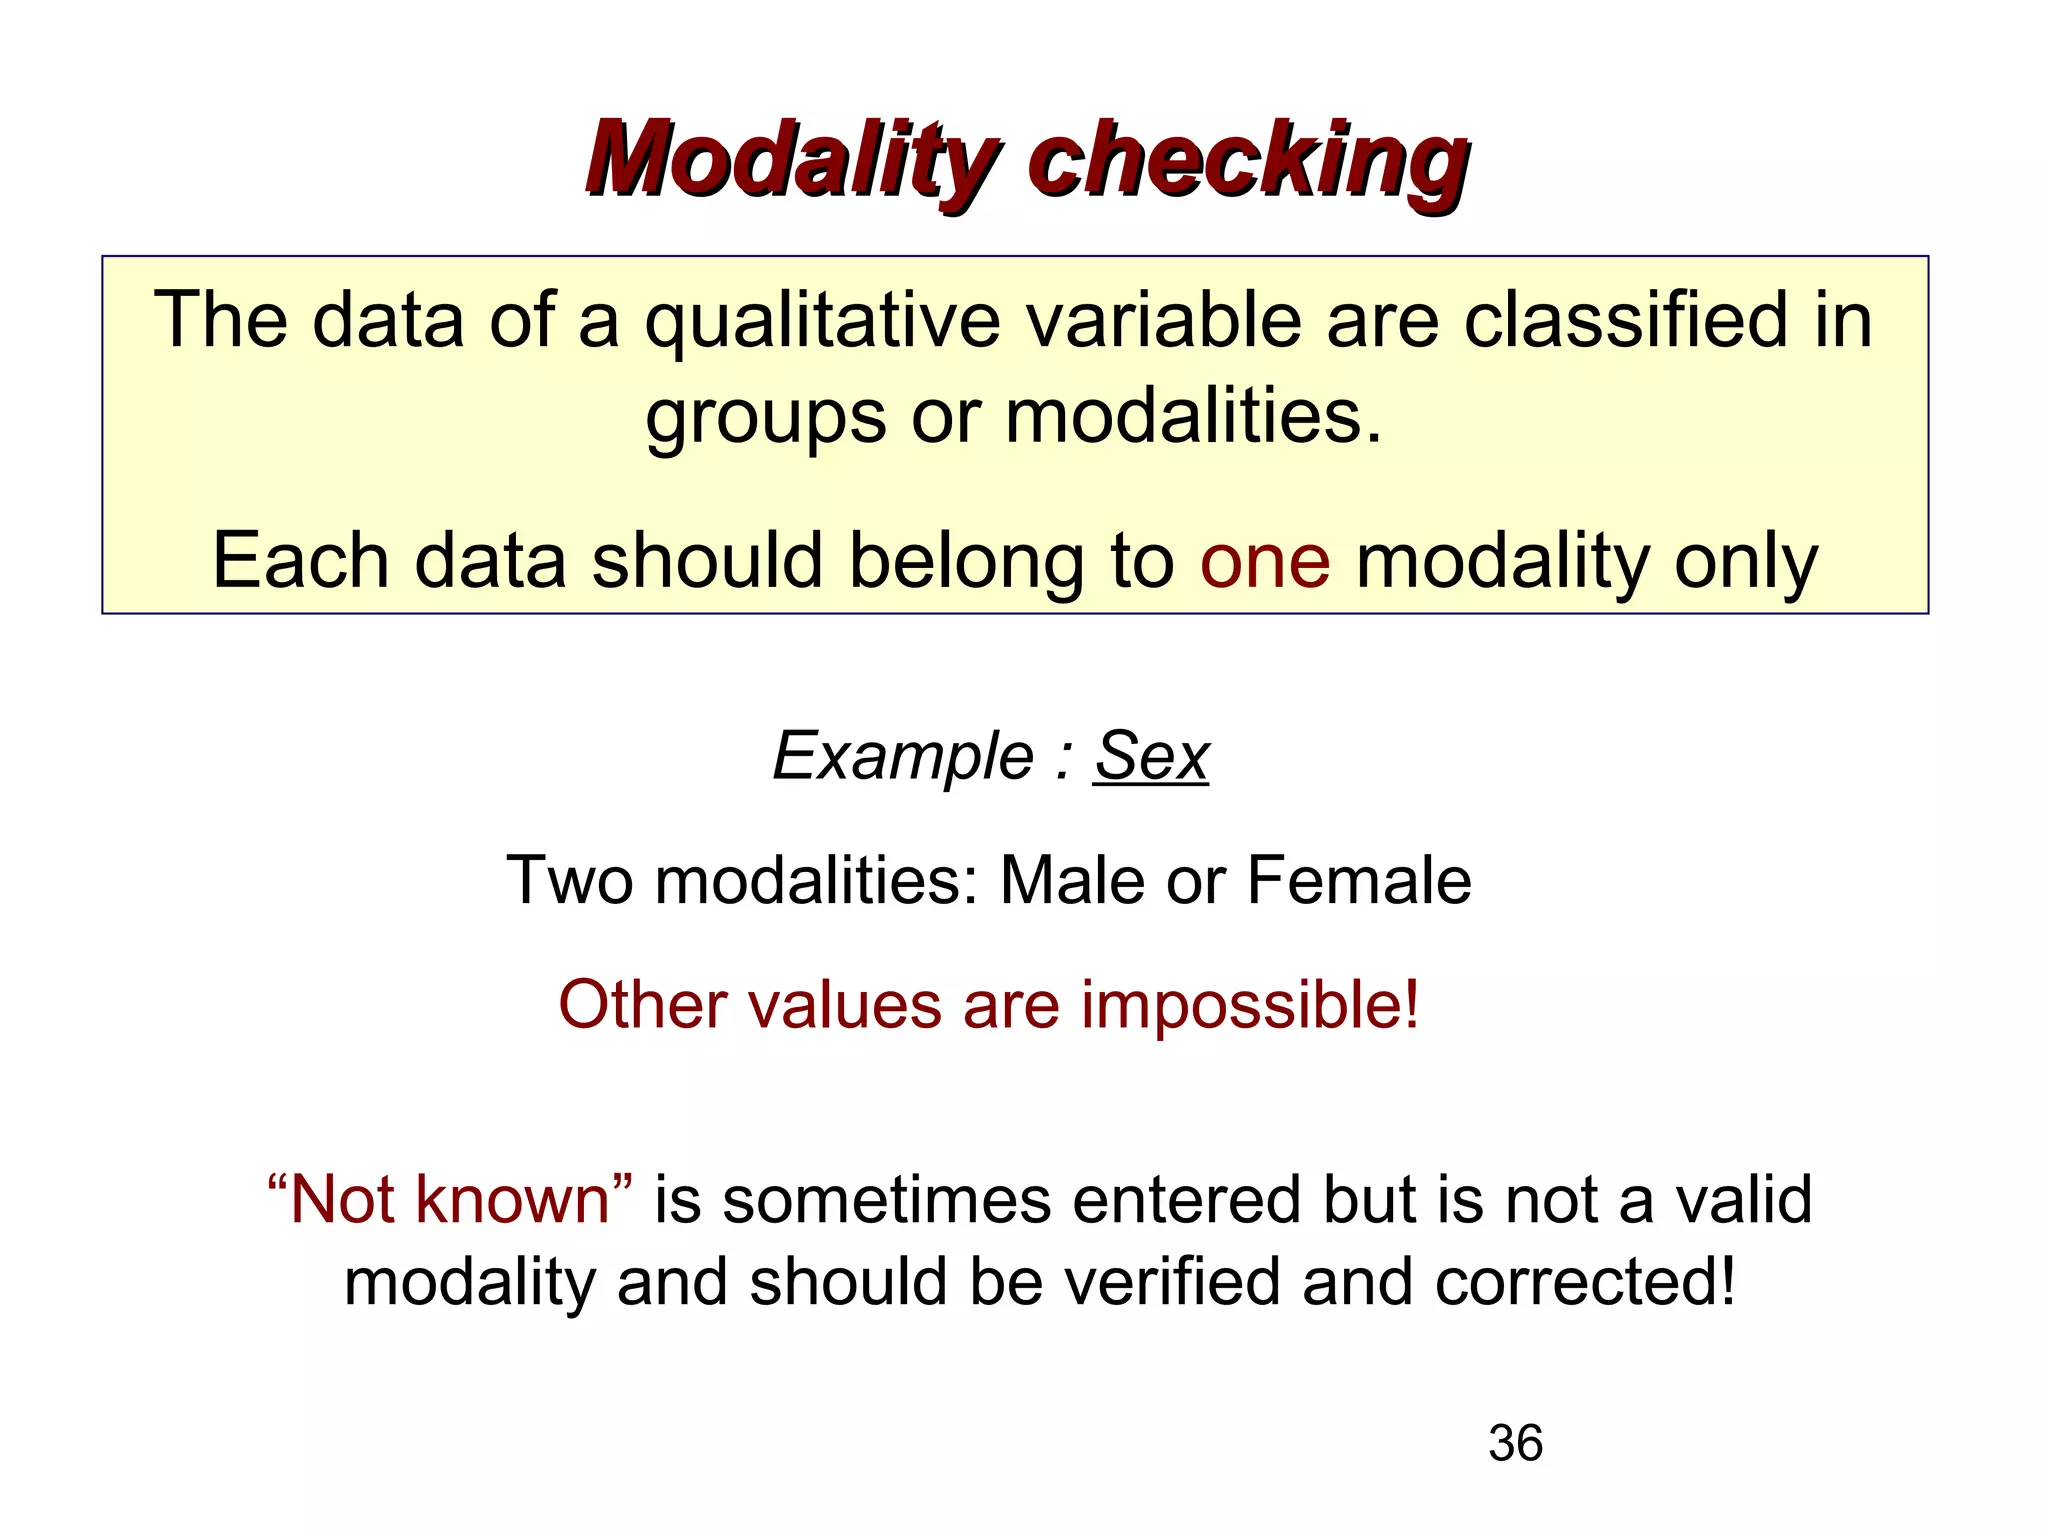
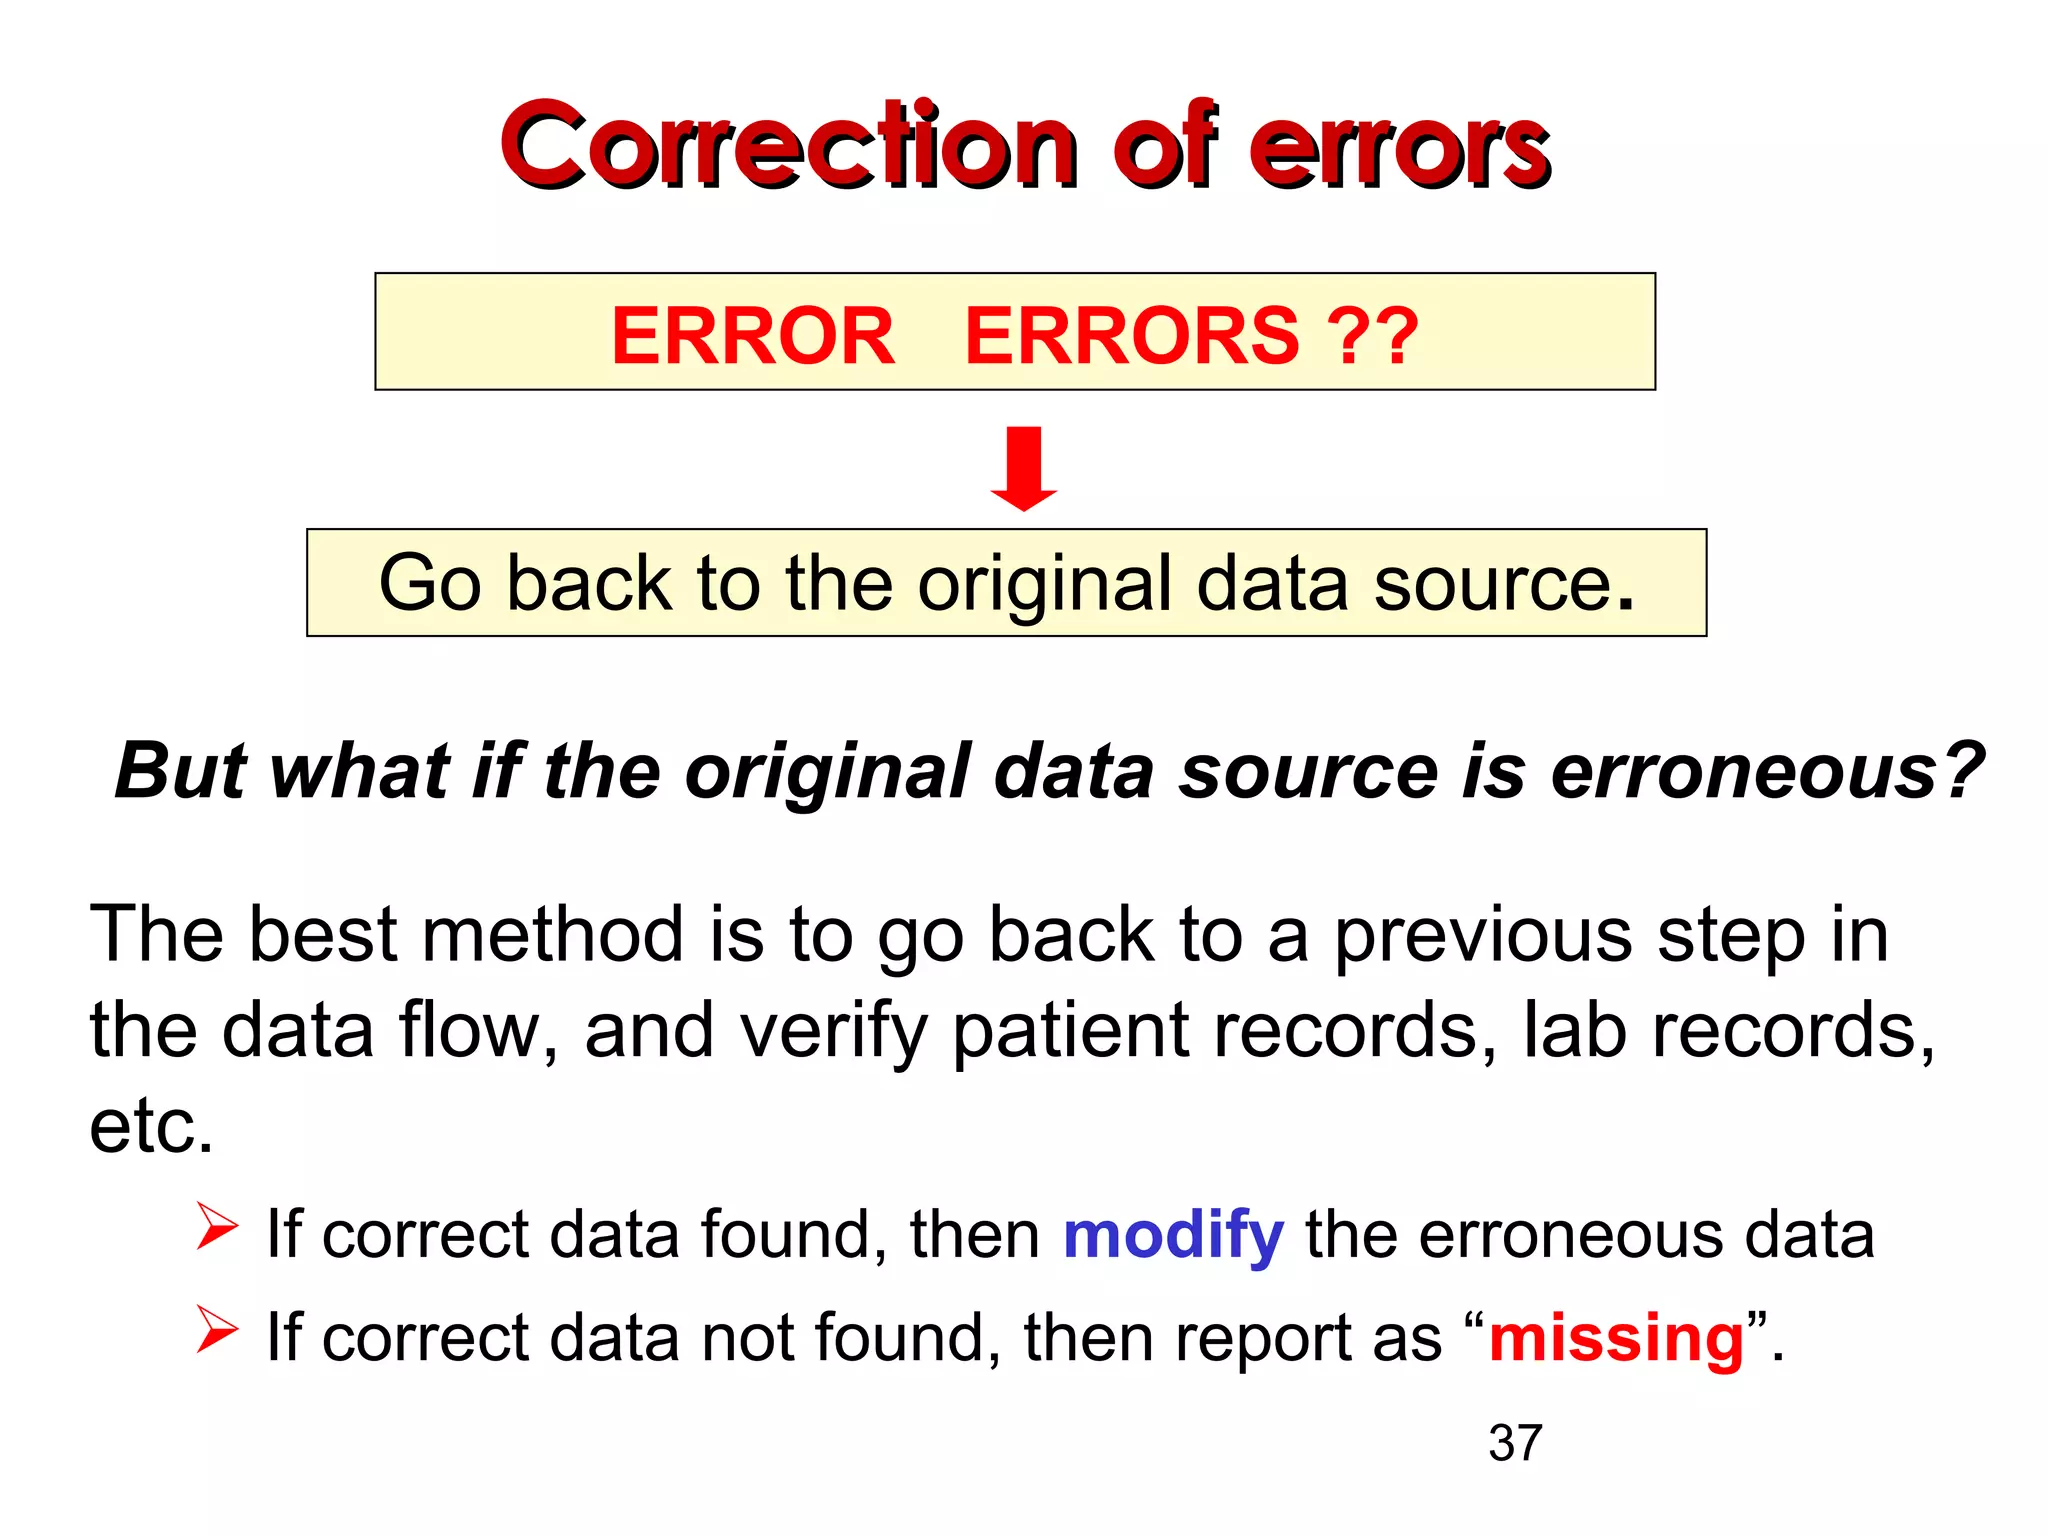
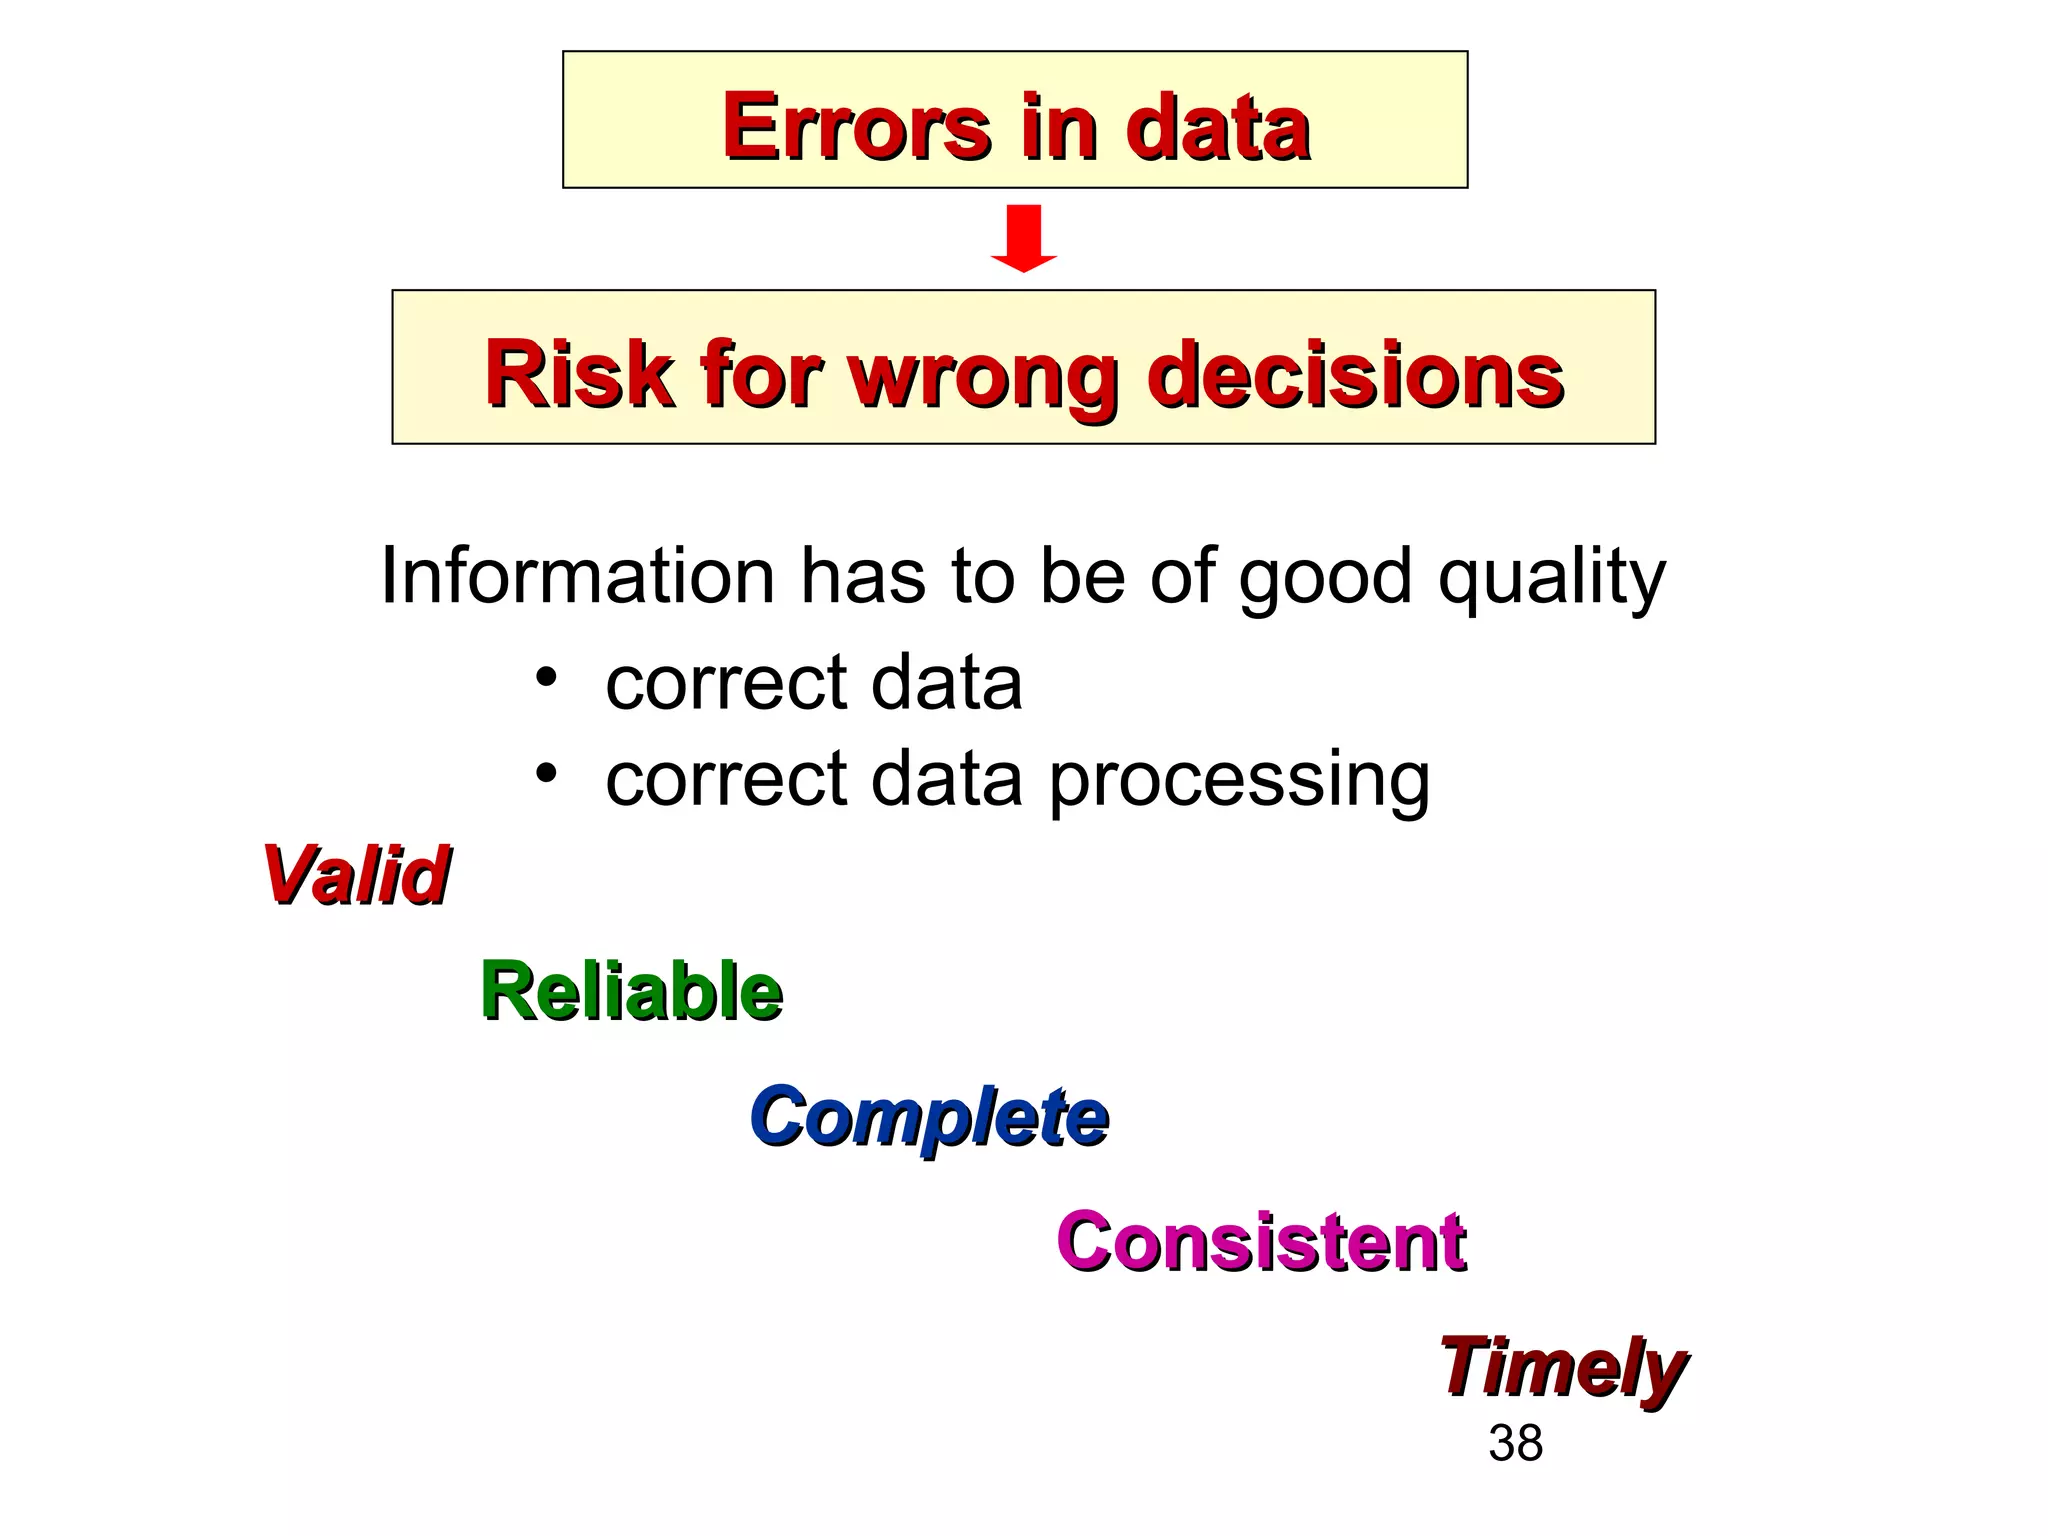
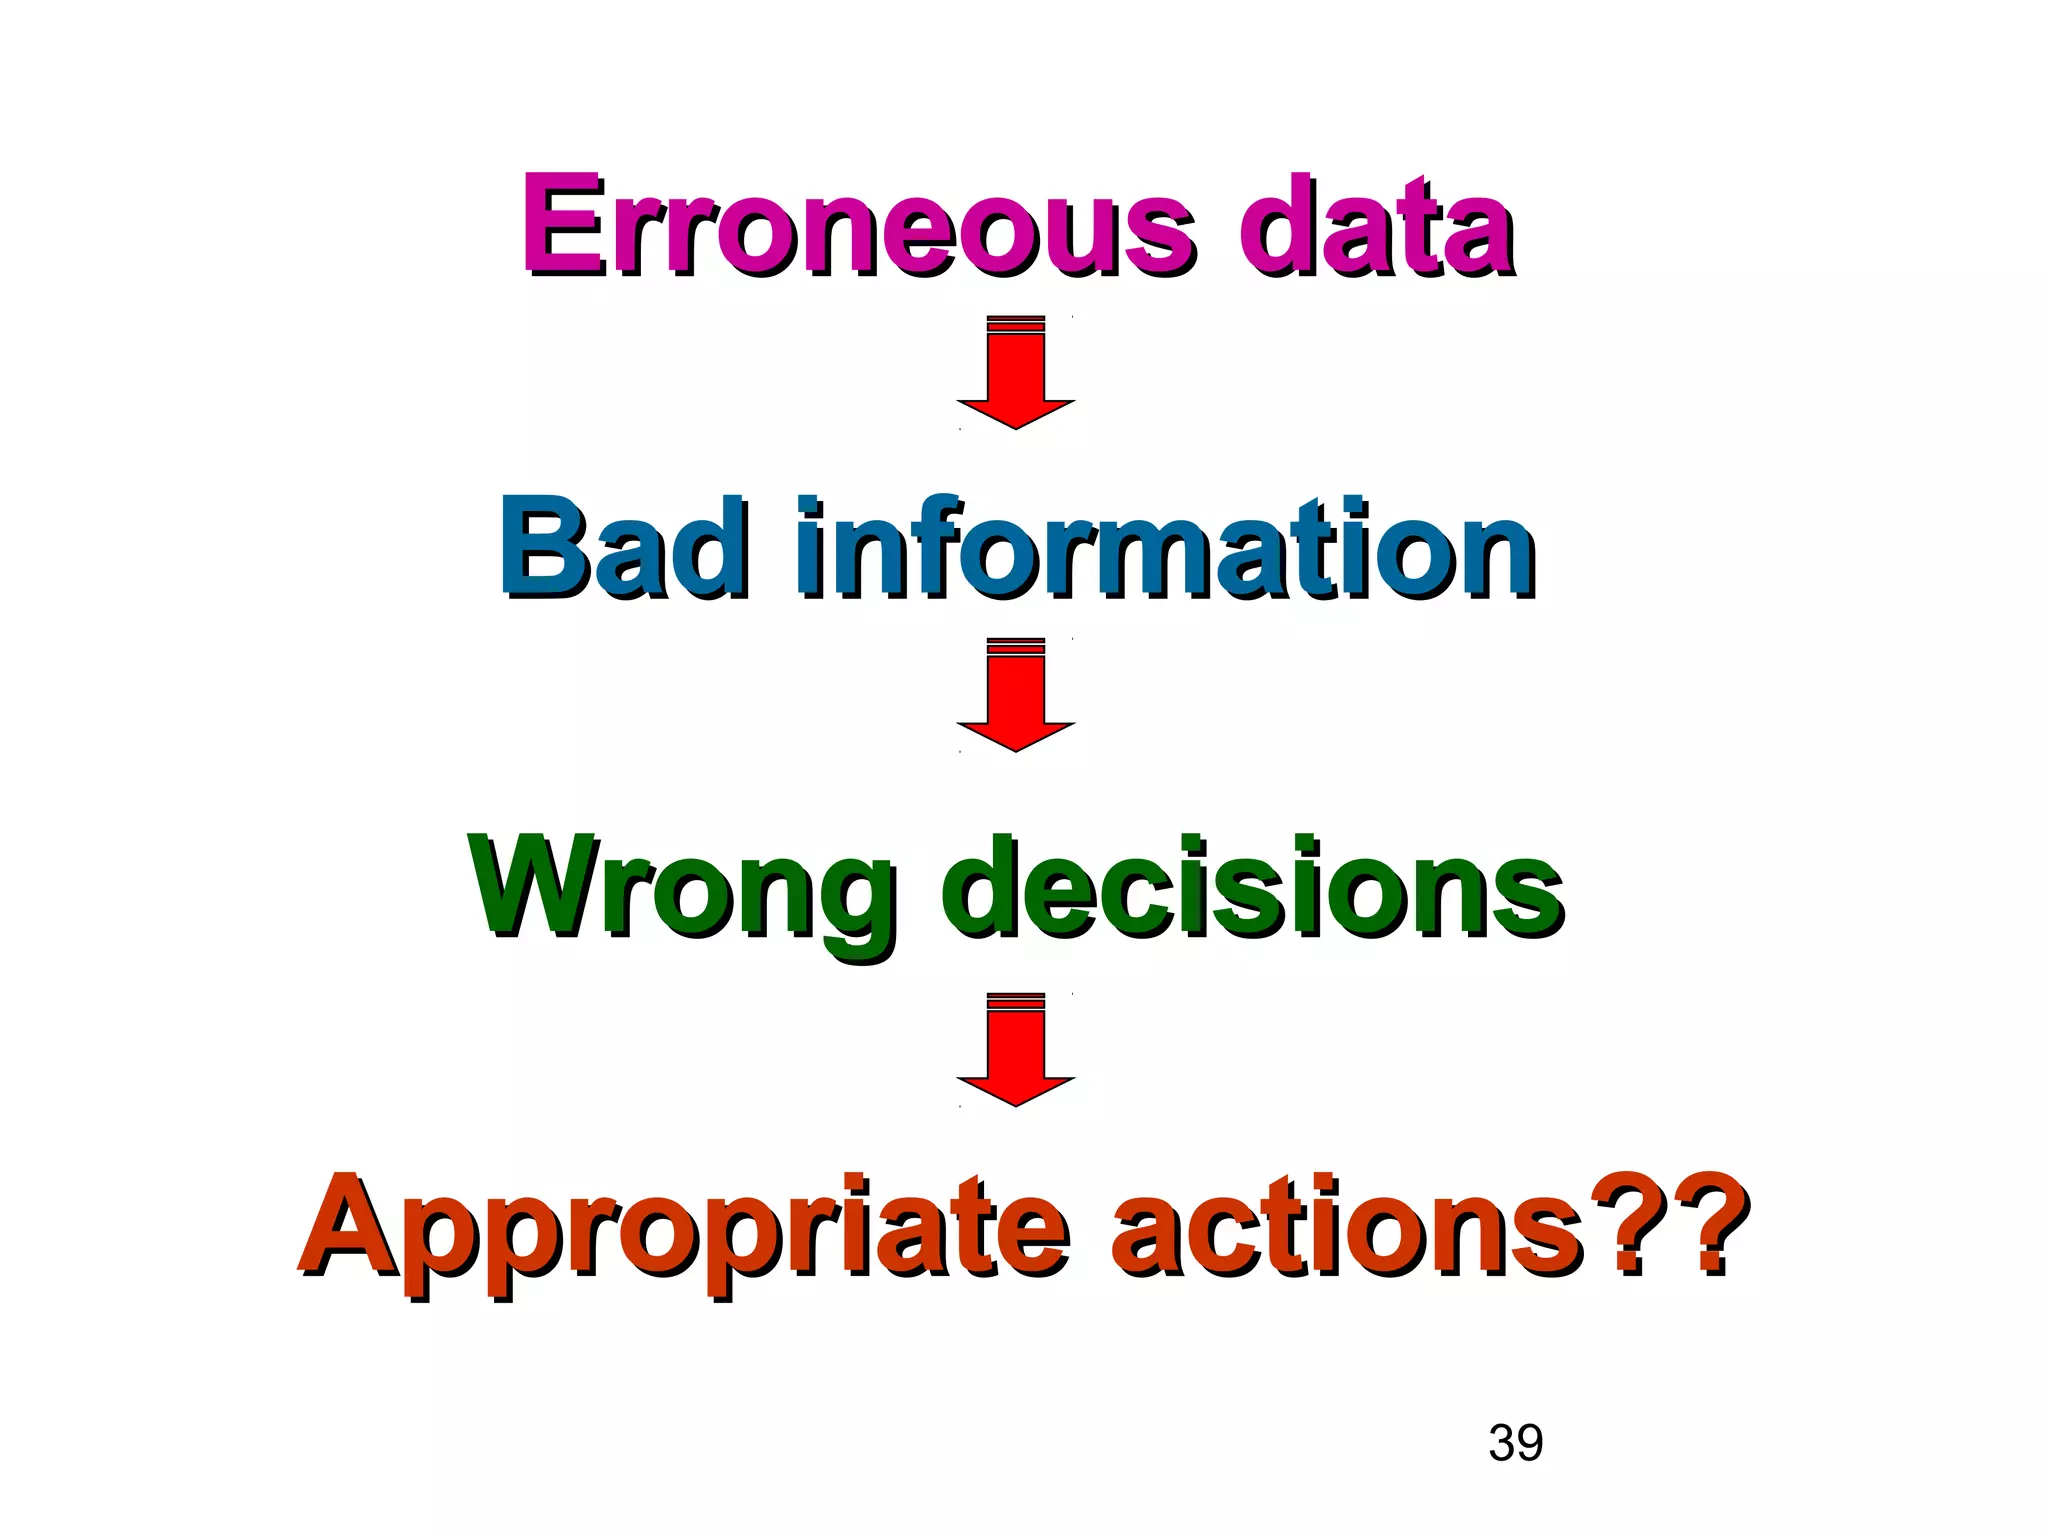
2. 2
LEARNING OBJECTIVESLEARNING OBJECTIVES
Realise importance of correct data for
program management
Realise distinction between random data
errors and falsified data
Understand causes of poor data quality
Being able to check data quality through
supervision and review of reports
Learn when and how to correct erroneous
data
3. 3
Occurrence & importance of errorsOccurrence & importance of errors
In business context:
Error rates of 1-5 % are not exceptional
Estimated cost ≈ 10 % of revenue
Problems with data quality ↑ when data originate from
multiple sources
After initial enthusiasm to improve data quality, focus
on data quality generally slowly fades
In disease control context
Error occurrence?
Impact on program performance?
Checking of errors: limited effort
4. 4
Errors in RNTCP?Errors in RNTCP?
Based on pre-test carried in all countries:
Real possibility of errors in subdistrict
reports
Minor possibility in district reports
Little attention to checking for errors
5. 5
Errors identified in 1039 TB patients
cohort review method in NY city: Munsiff et all IJTLD, 2006, 10 : 1133-9
• 41% of cases presented errors
• multiple errors per patient: 596 / 424 = 1.4
• What kind of errors?
- program info errors 55 %
- patient related errors 45 %
NB. Error rates in HMIS > 50 %
Gillies A. Methods Inf Med 2000, 39 : 208-12
6. 6
DataData qualityquality: definitiondefinition
The state of
validity,validity,
reliability,reliability,
consistency,consistency,
timelinesstimeliness
and completenessand completeness
making data appropriate for a specific use
Problems with data quality do not only arise from
incorrect data
Inconsistent data is a problem as well
7. 7
Data Quality ~ ManagementData Quality ~ Management
Quality AssuranceQuality Assurance
Activities to ensure
quality before data
collection
Quality AssuranceQuality Assurance
Activities to ensure
quality before data
collection
Quality ControlQuality Control
Monitoring and
maintaining quality of
data during RNTCP
implementation
Quality ControlQuality Control
Monitoring and
maintaining quality of
data during RNTCP
implementation
Data managementData management
Handling and analysis of data throughout
the RNTCP surveillance
Data managementData management
Handling and analysis of data throughout
the RNTCP surveillance
8. 8
Quality assurance & controlQuality assurance & control
Quality assurance Quality control
- anticipates problems before they occur - responds to observed problems
- uses all available information to generate
improvements
- uses ongoing measurements to make
decisions on the processes or products
- is not tied to a specific quality standard - requires a pre-specified quality standard
for comparability
- is applicable mostly at the planning stage - is applicable mostly at the processing
stage
- is all-encompassing in its activities - is a set procedure that is a subset of
quality assurance
9. 9
Quality controlQuality control
Quality control is a regulatory procedure
through which we:
measure quality
compare quality with pre-set standards
act on the differences
The objective of quality control is to achieve
a given quality level with minimum cost
(ex. EQA sampling)
10. 10
Dimensions of data qualityDimensions of data quality
1. Intrinsic data quality
accuracy (validity and reliability)
2. Contextual data quality
relevant
timely
complete
3. Representational data quality
interpretability, easy to understand
4. Accessibility data quality
accessibility, security
11. 11
Intrinsic data qualityIntrinsic data quality
ACCURACYACCURACY
Exact conformity to the true value
WHY IMPORTANT?
Accurate data = precondition for
accurate decisions!!
Two concepts: validityvalidity and reliabilityreliability
QUESTION: is this guaranteed?
12. 12
ValidityValidity
= the degree to which
a measurement reflects the truth
There should be no systematic error or bias
What is a valid sputum result for an open TB case?What is a valid sputum result for an open TB case?
A result is valid if it corresponds to the true value!A result is valid if it corresponds to the true value!
Open TB case = sputum positive!!Open TB case = sputum positive!!
13. 13
ReliabilityReliability
The degree to which a measurement gives the same
result:
each time it is used under the same condition
with the same subject
A necessary but not sufficient condition for validity
because one can make the same errors twice
Reliability = repeatibility of measurementsReliability = repeatibility of measurements
Reliability is inversely related toReliability is inversely related to random errorrandom error
14. 14
Dimensions of data qualityDimensions of data quality
1. Intrinsic data quality
accuracy
2. Contextual data quality
relevant
timely
complete
16. 16
RELEVANCERELEVANCE
A good information source should include all
relevant content and exclude all irrelevant content.
. Decision making for RNTCP management
Relevant for what?
.
Assessing relevance is subjective and depends upon the
varying needs of users!
17. 17
TIMELINESSTIMELINESS
Refers to the moment data are compiled,
reported and analysed
Given RNTCP’s normalization of the data reporting
system, timeliness is not a major issue in India.
But it could be an issue in remote areas and in PPM
19. 19
Missing records
• Annual report 2001 NTP Bangladesh
Reports DOTS areas non DOTS areas
-------------------------------------------------------
Received 2230 180
Missing 59 4
% missing 3% 2%
20. 20
Dimensions of data qualityDimensions of data quality
1. Intrinsic data quality
accuracy
2. Contextual data quality
relevant
timely
complete
3. Representational data quality
interpretability, easy to understand
21. 21
Representational data qualityRepresentational data quality
Interpretability
Data must be in appropriate language and
units, and the data definitions must be
clear to all (language, jargon, concepts)
Ease of understanding
Data must be clear, without ambiguity, and
easily comprehended.
22. 22
Dimensions of data qualityDimensions of data quality
1. Intrinsic data quality
accuracy
2. Contextual data quality
relevant
timely
complete
3. Representational data quality
interpretability, easy to understand
4. Accessibility data quality
accessibility, security
23. 23
ACCESSIBILITYACCESSIBILITY
Essential element of any data quality assessment.Essential element of any data quality assessment.
If data is not accessible, then it has little or no valueIf data is not accessible, then it has little or no value..If data is not accessible, then it has little or no valueIf data is not accessible, then it has little or no value..
Accessibility = precondition for use, but no guarantee for use!
Data items should be easily obtainable and legal to collect.Data items should be easily obtainable and legal to collect.
In computer era, guidelines have to be established for whoIn computer era, guidelines have to be established for who
may access which datamay access which data
24. 24
SECURITYSECURITY
The protection of data from:
☞unauthorized modification (accidental or
intentional)
☞equipment malfunction (computer crash),
☞natural disasters (fire, tsunami..) and crime
Be aware!
Security threats are more serious when HMIS is
computerized:
unauthorized access to data
damage to files (viruses…)
Be aware!
Security threats are more serious when HMIS is
computerized:
unauthorized access to data
damage to files (viruses…)
25. 25
Data management covers the whole process, starting from data
recording to transcription, compilation, analysis & interpretation,
reporting, feedback and use.
TB CENTRE
(OPD or lab)
TB CENTRE
(OPD or lab)
TRANSCRIPTIONTRANSCRIPTIONRECORDINGRECORDING
COMPILATIONCOMPILATION
ANALYSIS
& INTERPRETATION
ANALYSIS
& INTERPRETATION
REPORTINGREPORTING
FEEDBACK & USEFEEDBACK & USE
26. 26
Where can errors occur?Where can errors occur?
At each step, especially during:
Data recording
Manual data transcription
Data compilation
Data entry in computer
Analysis
Interpretation
27. 27
Step in data flow Source of error
Data recording Information not registered
Wrong information (wrong address, etc )
Right information wrongly entered (in the wrong
place)
Missing records
Data compilation Wrong counts
Missed reports
Duplicate counting
Compterised data
entry
Wrong entry
Partial entry
Partial entry of records
Template based
computerised data
analysis
nil
28. 28
Prevention of data errorsPrevention of data errors
clarity of the instructions
training and motivation of the staff
honesty of the staff
user-friendliness of the data supports,
such as data forms and templates
supervision
29. 29
Prevention of data errorsPrevention of data errors
computerized data handling :
improves the accuracy of the data
prevents processing and analysis errors
makes fudging less easy, once the data
have been entered in the computer
use of independent double entry techniques
(and checking of inconsistencies between
the 2 entries)
data entry formatted to acceptable ranges
and modalities only
30. 30
How to proceed with the dataHow to proceed with the data
verification?verification?
1. Be alert
2. Routine checking of data
3. Quarterly report checking
31. 31
BE ALERT!BE ALERT!
Registers that look meticulously clean
All data entered with the same pen
Lack of variation / identically results every quarter
A too nice performance:
absence of initial defaulters
too low death rates
too high cure rates
absence of defaulting in IP …
Be alert to the likelihood of intentional
falsification of data!!!
Do not accept data without checking
their veracity!!!
32. 32
How to proceed with the dataHow to proceed with the data
verification?verification?
Routine checking of the data through
supervision
Completeness checking
Consistency checking
Quarterly report checking
Range checking
Modality checking
33. 33
Completeness checkingCompleteness checking
Completeness of report = all data have been reported!
A minimal completeness check verifies if
all variables contain data.
A minimal completeness check verifies if
all variables contain data.
Example:
200 NSP cases and age information only for 187 casesInformation is incomplete!
How to solve?
Verify via the original reports.
34. 34
Consistency checkingConsistency checking
Checks whether the values of data items are concordant
Example: CAT III and Sputum+
How to check for inconsistencies?How to check for inconsistencies?
By cross tabulation
CAT Sputum result
SP+ SP-
CAT I 1162 114
CAT II 300 148
CAT III 16 103016
Contradiction
35. 35
Range checkingRange checking
Any method of detecting whether a quantitative
variable is within an acceptable range
Example 1: Height of an adult patient
Acceptable range = 1.00 m to 2,00 m
3.00 m is impossible
0.98 is possible, but needs verification
Example 2: Age of an adult patient
Acceptable range =15 to 100 years
150 years is impossible
Any “impossible” or “out of range” value should
be verified via the original record or the patient.
Any “impossible” or “out of range” value should
be verified via the original record or the patient.
36. 36
Modality checkingModality checking
The data of a qualitative variable are classified in
groups or modalities.
Each data should belong to one modality only
Example : Sex
Two modalities: Male or Female
Other values are impossible!
“Not known” is sometimes entered but is not a valid
modality and should be verified and corrected!
37. 37
Correction of errorsCorrection of errors
ERROR ERRORS ??
Go back to the original data source.
But what if the original data source is erroneous?
The best method is to go back to a previous step in
the data flow, and verify patient records, lab records,
etc.
If correct data found, then modify the erroneous data
If correct data not found, then report as “missing”.
38. 38
Errors in dataErrors in data
Risk for wrong decisionsRisk for wrong decisions
Information has to be of good quality
• correct data
• correct data processing
ValidValid
ReliableReliable
CompleteComplete
ConsistentConsistent
TimelyTimely