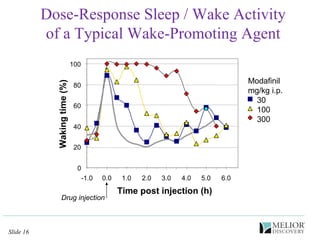
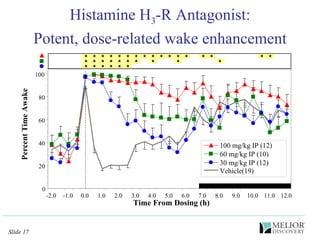
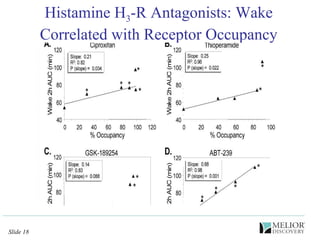
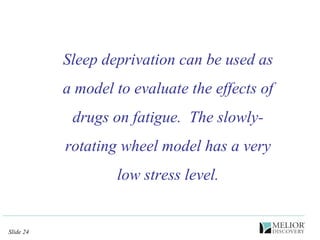
Sleep / Wake Activity Electrophysiology Models
Cortical  Electroencephalography (EEG) Overview
Utility of EEG Evaluation Neurologic evaluation and characterization of: -  Genetic disorders (mice and/or rats) Disease models: most neurological disorders impair sleep/wake regulation Physiological processes: attention, cognition, circadian activity, etc. Evaluation of drug efficacy: Waking, sedation, seizure liability, circadian regulation, etc.  Drug interactions, side effects (sedation, hyperactivity) and/or toxicity (seizure liability) Physiological interactions: sleep deprivation, stress, etc. Mechanism of action Pathways, transmitters, receptor agonists / antagonists, etc.
EEG Activity Outcome Measures Sleep / wake / rapid-eye movement (REMS) activity - Percent and cumulative time in state - Up to 48 h monitoring: circadian activity - Latency, duration, and frequency of states (sleep architecture) - Hyper- hyposomnolence (sleep rebound) EEG frequency analysis -  Fast fourier transform (FFT): power or energy of specific   frequencies for a given period of activity - Delta (0.5 – 4 Hz) power – dominant sleep frequency - Theta (6 – 9 Hz) hippocampal activity; change in power and   center frequency Motor activity, motor intensity, body temperature - Motor intensity = motor activity / EEG wake time
Why Evaluate EEG Activity in Rodents? Many neurological diseases affect sleep / wake activity, therefore rat EEG is a well-accepted translational model for evaluating drug efficacy and side-effect liability Rats are the most widely used subject apart from humans for sleep studies; however mice can also be used. Abundant reference data on stimulants, sedatives, psychoactive molecules, environmental factors, fatigue, etc. Many aspects of sleep/wake mechanism known (e.g. roles of transmitters and neural pathways) Numerous models available: genetic (orexin KO), lesion (surgical, chemical), physiological (sleep deprivation)
Measurement of  Rat Cortical EEG
Cortical Electrode Positions  for EEG Sleep/Wake Recording Hippocampal  area Frontal cortex
Bregma Lambda EEG Neck muscles Electromyogram Recording of Rat Cortical and Muscle  Activity for Sleep / Wake Determination EMG Electro- encephalogram Cortical EEG and neck muscle EMG signals can be visually scored to yield three sleep/wake state:  wake, slow-wave sleep (SWS), and rapid-eye movement sleep (REMS).
“ Awake” Waking theta Low frequency, hi amp. EEG Low amp. EMG 6 – 9 Hz, moderate amp. EEG No EMG Wake Slow-wave sleep REM (theta) sleep “ Asleep” EEG EMG EEG EMG Hi-frequency, low amp. EEG Moderate - high amp. EMG  EEG / EMG Based Scoring  of Sleep/Wake Activity in the Rat Moderate - high amp. EMG – 9 Hz, moderate amp. EEG 6
Chronic recording of EEG / EMG, Motor Activity, Body Temperature, & Behavior - Sound-attenuating cabinet Background masking sound Light, fan, video camera Locomotor monitoring - Food & water Up to 48 h EEG recording, 16 rats at a time Up to 32 rats tested per week Video observation Motor activity and body temperature recorded
Typical EEG Sleep/Wake Studies Circadian rhythm evaluation Dose-response of sedative or wake enhancing activity - Modafinil, Histamine H 3 -R antagonist Drug combinations  –   DAT inhibitor + amphetamine produces enhanced wake Drug antagonism  –   (nicotine +   2  4  nAChR blocker) Sleep deprivation –  effect on wake-promoting efficacy Seizure liability (pro-convulsive, anti-convulsive) EEG activity is quantitive and highly sensitive and has been shown in several models to provide support for and/or interpret physiological effects at the molecular level.
Melior EEG Validation:  Caffeine 0 Wake SWS REMS 4hr Cumulative  Wake (min) Vehicle Caffeine 15 mg/kg IP 4 h max time 60 120 180 240 * * * p< 0.001 * 0 20 40 60 80 100 -2.0 -1.0 0.0 1.0 2.0 3.0 4.0 5.0 6.0 7.0 8.0 9.0 Time (h from dosing) Percent Time Awake Caffeine 15 mg/kg IP (3) Vehicle (3) Historic Veh (8) Light Off
Effects of Caffeine on FFT Power Pre-dosing Post-dosing Wake SWS REMS 0.00 0.01 0.02 0.03 0.04 0 1 2 3 4 5 6 7 8 9 10 11 12 13 14 15 16 FFT amplitude -92.2 -66.7 -30.9 0.00 0.01 0.02 0.03 0.04 1 2 3 4 5 6 7 8 9 10 11 12 13 14 15 16 18.0 43.0 73.0 0.00 0.02 0.04 0.06 0.08 1 2 3 4 5 6 7 8 9 10 11 12 13 14 15 16 FFT amplitude -126.3 -106.1 -77.0 0.00 0.02 0.04 0.06 0.08 1 2 3 4 5 6 7 8 9 10 11 12 13 14 15 16 234.4 248.0 258.3 0.00 0.02 0.04 0.06 1 2 3 4 5 6 7 8 9 10 11 12 13 14 15 16 Frequency (Hz) FFT amplitude -118.9 -68.9 -37.3 0.00 0.02 0.04 0.06 1 2 3 4 5 6 7 8 9 10 11 12 13 14 15 16 Frequency (Hz) 244.0 305.7 326.6 Caffeine, 15 mg/kg IP ~6.5 Hz ~8.5 Hz Caffeine increased the amplitude and center frequency of theta (5 – 9 Hz) power during Wake.  Caffeine suppressed REMS for 4 h post dosing with no change in REMS center frequency after REMS recovery..
Circadian Activity Monitoring % Wake vs time (N= 8) Time (ZT); Light on @ 7 am) % Time Awake Light Off 0 20 40 60 80 100 22 0 2 4 6 8 10 12 14 16 18 20 22 0 2 Typical sleep / wake activity monitored over 24 h.
Evaluation of sleep and wake activity is a highly sensitive and quantifiable measure of CNS activity Sleep, wake, and REM sleep activity and associated measures can be used to determine lower limits of CNS activity and dose-response information on novel compound Activity can be correlated with receptor occupancy.
Dose-Response Sleep / Wake Activity of a Typical Wake-Promoting Agent Modafinil mg/kg i.p. 30 100 300 0 20 40 60 80 100 -1.0 0.0 1.0 2.0 3.0 4.0 5.0 6.0 Time post injection (h) Waking time (%) Drug injection
Histamine H 3 -R Antagonist: Potent, dose-related wake enhancement 0 20 40 60 80 100 -2.0 -1.0 0.0 1.0 2.0 3.0 4.0 5.0 6.0 7.0 8.0 9.0 10.0 11.0 12.0 Percent Time Awake Time From Dosing (h) 100 mg/kg IP (12) 60 mg/kg IP (10) 30 mg/kg IP (12) Vehicle(19)
Histamine H 3 -R Antagonists: Wake Correlated with Receptor Occupancy
Drug combination studies can be readily implemented to evaluate drug-drug interactions:  inhibition or facilitation
Drug Combinations: DAT Inhibitor + Amphetamine Enhances Wake d-Amphetamine (1 mg/kg i.p.) Nomifensine (3 mg/kg i.p.) : 0 20 40 60 80 100 -2 -1 0 1 2 3 4 5 6 7 8 9 10 11 12 Time (hr) Percent Time Awake Amp+Nom (20) Nomifensine(14) Amphetamine (10) Vehicle (14) Light Off
Combination of a DAT Inhibitor Plus Amphetamine Enhances Wake Cumulative Wake Surplus  d-Amphetamine (1 mg/kg IP), Nomifensine (3 mg/kg IP) -30 0 30 60 90 120 150 180 210 240 270 Pre 1 2 3 4 5 6 7 8 9 10 11 12 13 14 15 16 17 18 19 20 21 22 Time post dosing (h) Cumulative Wake Surplus (min) Amphetamine  + Nomifensine Nomifensine Amphetamine
DAT  Inhibitor + Amphetamine Amphetamine (1 mg/kg IP, N= 10)  peak CWS = 91 ±5  min at 3 h Nomifensine (3 mg/kg IP, N= 14) peak CWS = 102 ± 7 min min at 4 h Maximum CWS for amphetamine and nomifensine equal (p= 0.306) Combination amphetamine + nomifensine (N= 20)  Peak CWS = 224 ±8  min at 7 h p< 0.001 versus sum of individual drug CWS times (102 ±7) min . Total wake time (cumulative wake surplus, CWS) produced by dosing amphetamine + nomifensine was greater than the sum of the wake times of the individual drugs.  0 30 60 90 120 150 180 210 240 Amphetamine  Nomifensine  Cumulative Wake Surplus (min) p= 0.306 p< 0.001 Amphetamine + Nomifensien
Drug Antagonism  ( nicotine + nAChR blockers) -40 -20 0 20 40 60 Cumulative Wake  Surplus (min) -40 -20 0 20 40 60 Time post dosing (h) Cumulative Wake  Surplus (min) DHBE:   2  4 block Nicotine (1 mg/kg) produced a moderate increase in wake which was blocked by DHBE (nicotini-AChR antagonist) at 10 but not at 1 mg/kg. Nicotine-1 DHBE-1 DHBE-1 + Nic-1 Pre 1.0 2.0 3.0 4.0 5.0 6.0 7.0 8.0 Nicotine-1 DHBE-10 DHBE-10 + Nic-1 Pre 1.0 2.0 3.0 4.0 5.0 6.0 7.0 8.0
Sleep deprivation can be used as a model to evaluate the effects of drugs on fatigue.  The slowly-rotating wheel model has a very low stress level.
Sleep Deprivation Model Forced Rat Exercise  Wheel System Animals placed in enclosed wheels at end of activity period (light-on, 8 am) Wheels turn at 1 RPM  (1 m/min) forcing animals to remain awake Control animals housed in normal recording chambers After e.g. 6 hrs of sleep deprivation, sleep-deprived rats returned to recording  chambers  and are dosed along with controls Light  Off Light  On < Dose (normally active) 8 am 2 pm (normally asleep) Sleep deprivation
Effect of 6 hr sleep deprivation  on sleep / wake activity The efficacy of caffeine, modafinil, and amphetamine were compared after 6 h of sleep deprivation and modafinil was found to be superior to the other compounds.  Caffeine in particular did not maintain wake nearly as well following sleep deprivation (data not shown; Gruner et al in preparation). Percent Time Awake 0 20 40 60 80 100 6 7 8 9 10 11 12 13 14 15 16 17 18 19 20 21 22 23 0 1 2 3 4 5 Veh_Nsd (60) Veh_SD (60) o o o o o o o o o o o o o o o o o o o o + 0 200 400 600 800 1000 1200 Delta SD Delta Nsd Wake SD Wake Nsd SWS SD SWS Nsd REMS SD REMS Nsd Light off 0 1 2 3 4 6 7 8 9 10 11 12 13 14 15 16 17 18 19 20 21 22 23 5 6 0 200 400 600 800 1000 1200 Light off 0 1 2 3 4 6 7 8 9 10 11 12 13 14 15 16 17 18 19 20 21 22 23 5 6 0 200 400 600 800 1000 1200 Cumulative Wake  Time (min) Light off 0 1 2 3 4 6 7 8 9 10 11 12 13 14 15 16 17 18 19 20 21 22 23 5 6 0 1 2 3 4 6 7 8 9 10 11 12 13 14 15 16 17 18 19 20 21 22 23 5 6 Time (ZT, h)
Sleep Deprivation Reduces the Wake Promoting Effect of Caffeine Time (ZT, h) -180 -120 -60 0 60 120 180 6 7 8 9 10 11 12 13 14 15 16 17 18 19 20 21 22 23 0 1 2 3 4 5 Caf-15 Nsd Caf-15 SD Vehicle SD Caf-30 Nsd Caf-30 SD Cumulative Wake Surplus (min) SD = sleep deprived;  Nsd = non-sleep deprived Caf-15: Caffeine, 15 mg/kg ip  Caf-30: Caffeine, 15 mg/kg ip
EEG provides a sensitive and reliable measure of both pro- and anti-convulsant activity.  EEG can also identify CNS activity that may not be detected by behavioral observation.   Pro-convulsant activity is evaluated in terms of the maximal tolerated dose:  that dose above which over 50% of animals show unequivocal seizure activity.  Anti-convulsant activity is evaluated against PTZ-induced convulsant activity, either at a PTZ dose that produces seizures, or  at lower PTZ doses that can be quantitified  by their effects on EEG frequency.
Pro-Convulsive Seizure liability Cortical seizure induced by H3-R antagonist FFT RT049 10:20:24 205 0:20:24 Wake theta -103 12:59:42 1798 2:59:42 57 EEG FFT 15:14:48 3149 5:14:48 Wake theta 192 16:35:48 3959 6:35:48 Slow rhythmic  waves 273 16:35:54 3960 6:35:54 Spike/wave  complexes 273 16:36:06 3962 6:36:06 increasing amplitude  and frequency of  spike-wave complexes 273 16:36:12 3963 6:36:12 273 16:36:18 3964 6:36:18 273 16:36:24 3965 6:36:24 spike-waves  with long  afterpotentials 273 16:36:36 3967 6:36:36 273 long after- potentials &  isoelectricity 16:36:54 3970 6:36:54 Isoelectricity 274 16:37:30 3976 6:37:30 274 16:37:48 3979 6:37:48 Isoelectricity 275 16:41:48 4019 6:41:48 EEG recovery 279 Time of day Time > recording start Min. from start EEG recording scale:  ± 500   µV) 16:41:48 4019 6:41:48 279 Epoch Dosing Slow spiking
Epoch 2154  (3:35:18 post recording start) Dosing: 2:37:12 (~60 min > PTZ @ 40 mg/kg SC) Epoch 2156 (3:35:30) (~60 min > PTZ dosing) EEG Pattern Following PTZ Administration Rat RT022 (PTZ/vehicle treated) File 06291122 29 June 2010 Epoch 2427 (4:02:36) (~85 min > PTZ dosing) The “bursting” pattern produced by doses of PTZ that do not produce overt seizures can be quantified in terms EEG power at a specific frequency.  This allows an ED 50  curve to be generated for anti-convulsant activity.  This method is applicable to rats and mice. EEG ±500 µV FFT C EEG ±500 µV FFT EEG ±500 µV FFT A B
Wake Diazepam / Veh PTZ FFT Power 0.0 0.1 0.2 0.3 0.4 0.5 0.6 Veh + PTZ Diaz + PTZ N= 5 / group * p= 0.005 p= 0.71 p= 0.72 0 5 10 15 20 25 30 35 40 Vehicle  + PTZ Diazepam + PTZ Seizure Onset  Latency (min  p= 0.006  * Onset (min) to first PTZ burst following PTZ dosing Diazepam Blocks PTZ-Induced  Rhythmic EEG Activity PTZ-induced bursting was quantified by FFT analysis and shown to be specifically reduced by diazepam.
RT034 e2011 0.00 0.10 0.20 0.30 0.40 1 2 3 4 5 6 7 Evaluation of Drug-Induced EEG Frequency Changes 10 min Pre-dosing FFT* 71 min Post-dosing Raw EEG (6 sec  epoch) FFT Power: Pre -> Post dosing Frequency (Hz) FFT amplitude (power) -10 20 71 345 570 Time post dosing (min) Pre 20 min post * Fast Fourier Transform: power as a function of  deconvoluted waveform frequency Each curve = average of 5 – 6 min of EEG at each time point. RT034 e1232 This drug produced an unexpected increase in slow-wave (delta) activity indicating potential sedative or hypnotic application.
THE END Publications Le S, JA Gruner, JR M athiasen, MJ Marino, and H Schaffhauser.  (2008). Correlation between  ex vivo  receptor occupancy and wake promoting activity of selective H3 receptor antagonists.  J Pharmacol Exp Ther.  325:902-9.  Fiocchi EM, YG Lin, L Aimone, JA Gruner, DG Flood.  (2009).  Armodafinil promotes wakefulness and activates Fos in rat brain. Pharmacol Biochem Behav. May;92:549-57. Gruner JA, VR Marcy, Y-G Lin, D Bozyczko-Coyne, MJ Marino, M Gasior.  2009. The Roles of Dopamine Transport Inhibition and Dopamine Release Facilitation in Wake Enhancement and Rebound Hypersomnolence Induced by Dopaminergic Agents.  Sleep 32:1425-1438. Gruner JA, JR Mathiasen, DG Flood, MJ Marino, M Gasior. 2011. Biochemical, pharmacological, and behavioral characterization of the dopaminergic stimulant sydnocarb in rats.  J. Pharmacol. Expt. Ther.. 337:380-90. Hudkins RL, Raddatz R, Tao M, Mathiasen JR, Aimone LD, Becknell NC, Prouty CP, Knutsen LJ, Yazdanian M, Moachon G, Ator MA, Mallamo JP, Marino MJ, Bacon ER, Williams M. 2011. Discovery and Characterization of 6-{4-[3-(R)-2-Methylpyrrolidin-1-yl)propoxy]phenyl}-2H-pyridazin-3-one (CEP-26401, Irdabisant): A Potent, Selective Histamine H(3) Receptor Inverse Agonist. J Med Chem. 54:4781-92.  Papers in progress Gruner JA, VR Marcy, Y-G Lin, MJ Marino.  The Relative Efficacies of Caffeine, Amphetamine, and Modafinil in the Presence and Absence of Sleep Deprivation in the Rat.  2009.  ( In preparation ) Raddatz R, RL Hudkins, JR Mathiasen, JA Gruner, S Le, H Schaffhauser, D Bozyczko-Coyne, MJ Marino, MA Ator, ER Bacon, JP Mallamo, M Williams.  A potent and selective histamine H3 receptor antagonist/ inverse agonist with cognition-enhancing and wake promoting activities.  ( In preparation. ) Gasior M, JA Gruner, VR Marcy, Y-G Lin, MJ Marino.  Wake Promoting Effects of Nicotine are Mediated by alpha-4 beta-2 and alpha-7 Subunit-Containing Nicotinic Acetylcholine Receptors in Rats.  ( In preparation. )

Eeg Sleep Wake Evaluation

  • 1.
    Sleep / WakeActivity Electrophysiology Models
  • 2.
  • 3.
    Utility of EEGEvaluation Neurologic evaluation and characterization of: - Genetic disorders (mice and/or rats) Disease models: most neurological disorders impair sleep/wake regulation Physiological processes: attention, cognition, circadian activity, etc. Evaluation of drug efficacy: Waking, sedation, seizure liability, circadian regulation, etc. Drug interactions, side effects (sedation, hyperactivity) and/or toxicity (seizure liability) Physiological interactions: sleep deprivation, stress, etc. Mechanism of action Pathways, transmitters, receptor agonists / antagonists, etc.
  • 4.
    EEG Activity OutcomeMeasures Sleep / wake / rapid-eye movement (REMS) activity - Percent and cumulative time in state - Up to 48 h monitoring: circadian activity - Latency, duration, and frequency of states (sleep architecture) - Hyper- hyposomnolence (sleep rebound) EEG frequency analysis - Fast fourier transform (FFT): power or energy of specific frequencies for a given period of activity - Delta (0.5 – 4 Hz) power – dominant sleep frequency - Theta (6 – 9 Hz) hippocampal activity; change in power and center frequency Motor activity, motor intensity, body temperature - Motor intensity = motor activity / EEG wake time
  • 5.
    Why Evaluate EEGActivity in Rodents? Many neurological diseases affect sleep / wake activity, therefore rat EEG is a well-accepted translational model for evaluating drug efficacy and side-effect liability Rats are the most widely used subject apart from humans for sleep studies; however mice can also be used. Abundant reference data on stimulants, sedatives, psychoactive molecules, environmental factors, fatigue, etc. Many aspects of sleep/wake mechanism known (e.g. roles of transmitters and neural pathways) Numerous models available: genetic (orexin KO), lesion (surgical, chemical), physiological (sleep deprivation)
  • 6.
    Measurement of Rat Cortical EEG
  • 7.
    Cortical Electrode Positions for EEG Sleep/Wake Recording Hippocampal area Frontal cortex
  • 8.
    Bregma Lambda EEGNeck muscles Electromyogram Recording of Rat Cortical and Muscle Activity for Sleep / Wake Determination EMG Electro- encephalogram Cortical EEG and neck muscle EMG signals can be visually scored to yield three sleep/wake state: wake, slow-wave sleep (SWS), and rapid-eye movement sleep (REMS).
  • 9.
    “ Awake” Wakingtheta Low frequency, hi amp. EEG Low amp. EMG 6 – 9 Hz, moderate amp. EEG No EMG Wake Slow-wave sleep REM (theta) sleep “ Asleep” EEG EMG EEG EMG Hi-frequency, low amp. EEG Moderate - high amp. EMG EEG / EMG Based Scoring of Sleep/Wake Activity in the Rat Moderate - high amp. EMG – 9 Hz, moderate amp. EEG 6
  • 10.
    Chronic recording ofEEG / EMG, Motor Activity, Body Temperature, & Behavior - Sound-attenuating cabinet Background masking sound Light, fan, video camera Locomotor monitoring - Food & water Up to 48 h EEG recording, 16 rats at a time Up to 32 rats tested per week Video observation Motor activity and body temperature recorded
  • 11.
    Typical EEG Sleep/WakeStudies Circadian rhythm evaluation Dose-response of sedative or wake enhancing activity - Modafinil, Histamine H 3 -R antagonist Drug combinations – DAT inhibitor + amphetamine produces enhanced wake Drug antagonism – (nicotine +  2  4 nAChR blocker) Sleep deprivation – effect on wake-promoting efficacy Seizure liability (pro-convulsive, anti-convulsive) EEG activity is quantitive and highly sensitive and has been shown in several models to provide support for and/or interpret physiological effects at the molecular level.
  • 12.
    Melior EEG Validation: Caffeine 0 Wake SWS REMS 4hr Cumulative Wake (min) Vehicle Caffeine 15 mg/kg IP 4 h max time 60 120 180 240 * * * p< 0.001 * 0 20 40 60 80 100 -2.0 -1.0 0.0 1.0 2.0 3.0 4.0 5.0 6.0 7.0 8.0 9.0 Time (h from dosing) Percent Time Awake Caffeine 15 mg/kg IP (3) Vehicle (3) Historic Veh (8) Light Off
  • 13.
    Effects of Caffeineon FFT Power Pre-dosing Post-dosing Wake SWS REMS 0.00 0.01 0.02 0.03 0.04 0 1 2 3 4 5 6 7 8 9 10 11 12 13 14 15 16 FFT amplitude -92.2 -66.7 -30.9 0.00 0.01 0.02 0.03 0.04 1 2 3 4 5 6 7 8 9 10 11 12 13 14 15 16 18.0 43.0 73.0 0.00 0.02 0.04 0.06 0.08 1 2 3 4 5 6 7 8 9 10 11 12 13 14 15 16 FFT amplitude -126.3 -106.1 -77.0 0.00 0.02 0.04 0.06 0.08 1 2 3 4 5 6 7 8 9 10 11 12 13 14 15 16 234.4 248.0 258.3 0.00 0.02 0.04 0.06 1 2 3 4 5 6 7 8 9 10 11 12 13 14 15 16 Frequency (Hz) FFT amplitude -118.9 -68.9 -37.3 0.00 0.02 0.04 0.06 1 2 3 4 5 6 7 8 9 10 11 12 13 14 15 16 Frequency (Hz) 244.0 305.7 326.6 Caffeine, 15 mg/kg IP ~6.5 Hz ~8.5 Hz Caffeine increased the amplitude and center frequency of theta (5 – 9 Hz) power during Wake. Caffeine suppressed REMS for 4 h post dosing with no change in REMS center frequency after REMS recovery..
  • 14.
    Circadian Activity Monitoring% Wake vs time (N= 8) Time (ZT); Light on @ 7 am) % Time Awake Light Off 0 20 40 60 80 100 22 0 2 4 6 8 10 12 14 16 18 20 22 0 2 Typical sleep / wake activity monitored over 24 h.
  • 15.
    Evaluation of sleepand wake activity is a highly sensitive and quantifiable measure of CNS activity Sleep, wake, and REM sleep activity and associated measures can be used to determine lower limits of CNS activity and dose-response information on novel compound Activity can be correlated with receptor occupancy.
  • 16.
    Dose-Response Sleep /Wake Activity of a Typical Wake-Promoting Agent Modafinil mg/kg i.p. 30 100 300 0 20 40 60 80 100 -1.0 0.0 1.0 2.0 3.0 4.0 5.0 6.0 Time post injection (h) Waking time (%) Drug injection
  • 17.
    Histamine H 3-R Antagonist: Potent, dose-related wake enhancement 0 20 40 60 80 100 -2.0 -1.0 0.0 1.0 2.0 3.0 4.0 5.0 6.0 7.0 8.0 9.0 10.0 11.0 12.0 Percent Time Awake Time From Dosing (h) 100 mg/kg IP (12) 60 mg/kg IP (10) 30 mg/kg IP (12) Vehicle(19)
  • 18.
    Histamine H 3-R Antagonists: Wake Correlated with Receptor Occupancy
  • 19.
    Drug combination studiescan be readily implemented to evaluate drug-drug interactions: inhibition or facilitation
  • 20.
    Drug Combinations: DATInhibitor + Amphetamine Enhances Wake d-Amphetamine (1 mg/kg i.p.) Nomifensine (3 mg/kg i.p.) : 0 20 40 60 80 100 -2 -1 0 1 2 3 4 5 6 7 8 9 10 11 12 Time (hr) Percent Time Awake Amp+Nom (20) Nomifensine(14) Amphetamine (10) Vehicle (14) Light Off
  • 21.
    Combination of aDAT Inhibitor Plus Amphetamine Enhances Wake Cumulative Wake Surplus d-Amphetamine (1 mg/kg IP), Nomifensine (3 mg/kg IP) -30 0 30 60 90 120 150 180 210 240 270 Pre 1 2 3 4 5 6 7 8 9 10 11 12 13 14 15 16 17 18 19 20 21 22 Time post dosing (h) Cumulative Wake Surplus (min) Amphetamine + Nomifensine Nomifensine Amphetamine
  • 22.
    DAT Inhibitor+ Amphetamine Amphetamine (1 mg/kg IP, N= 10) peak CWS = 91 ±5 min at 3 h Nomifensine (3 mg/kg IP, N= 14) peak CWS = 102 ± 7 min min at 4 h Maximum CWS for amphetamine and nomifensine equal (p= 0.306) Combination amphetamine + nomifensine (N= 20) Peak CWS = 224 ±8 min at 7 h p< 0.001 versus sum of individual drug CWS times (102 ±7) min . Total wake time (cumulative wake surplus, CWS) produced by dosing amphetamine + nomifensine was greater than the sum of the wake times of the individual drugs. 0 30 60 90 120 150 180 210 240 Amphetamine Nomifensine Cumulative Wake Surplus (min) p= 0.306 p< 0.001 Amphetamine + Nomifensien
  • 23.
    Drug Antagonism ( nicotine + nAChR blockers) -40 -20 0 20 40 60 Cumulative Wake Surplus (min) -40 -20 0 20 40 60 Time post dosing (h) Cumulative Wake Surplus (min) DHBE:  2  4 block Nicotine (1 mg/kg) produced a moderate increase in wake which was blocked by DHBE (nicotini-AChR antagonist) at 10 but not at 1 mg/kg. Nicotine-1 DHBE-1 DHBE-1 + Nic-1 Pre 1.0 2.0 3.0 4.0 5.0 6.0 7.0 8.0 Nicotine-1 DHBE-10 DHBE-10 + Nic-1 Pre 1.0 2.0 3.0 4.0 5.0 6.0 7.0 8.0
  • 24.
    Sleep deprivation canbe used as a model to evaluate the effects of drugs on fatigue. The slowly-rotating wheel model has a very low stress level.
  • 25.
    Sleep Deprivation ModelForced Rat Exercise Wheel System Animals placed in enclosed wheels at end of activity period (light-on, 8 am) Wheels turn at 1 RPM (1 m/min) forcing animals to remain awake Control animals housed in normal recording chambers After e.g. 6 hrs of sleep deprivation, sleep-deprived rats returned to recording chambers and are dosed along with controls Light Off Light On < Dose (normally active) 8 am 2 pm (normally asleep) Sleep deprivation
  • 26.
    Effect of 6hr sleep deprivation on sleep / wake activity The efficacy of caffeine, modafinil, and amphetamine were compared after 6 h of sleep deprivation and modafinil was found to be superior to the other compounds. Caffeine in particular did not maintain wake nearly as well following sleep deprivation (data not shown; Gruner et al in preparation). Percent Time Awake 0 20 40 60 80 100 6 7 8 9 10 11 12 13 14 15 16 17 18 19 20 21 22 23 0 1 2 3 4 5 Veh_Nsd (60) Veh_SD (60) o o o o o o o o o o o o o o o o o o o o + 0 200 400 600 800 1000 1200 Delta SD Delta Nsd Wake SD Wake Nsd SWS SD SWS Nsd REMS SD REMS Nsd Light off 0 1 2 3 4 6 7 8 9 10 11 12 13 14 15 16 17 18 19 20 21 22 23 5 6 0 200 400 600 800 1000 1200 Light off 0 1 2 3 4 6 7 8 9 10 11 12 13 14 15 16 17 18 19 20 21 22 23 5 6 0 200 400 600 800 1000 1200 Cumulative Wake Time (min) Light off 0 1 2 3 4 6 7 8 9 10 11 12 13 14 15 16 17 18 19 20 21 22 23 5 6 0 1 2 3 4 6 7 8 9 10 11 12 13 14 15 16 17 18 19 20 21 22 23 5 6 Time (ZT, h)
  • 27.
    Sleep Deprivation Reducesthe Wake Promoting Effect of Caffeine Time (ZT, h) -180 -120 -60 0 60 120 180 6 7 8 9 10 11 12 13 14 15 16 17 18 19 20 21 22 23 0 1 2 3 4 5 Caf-15 Nsd Caf-15 SD Vehicle SD Caf-30 Nsd Caf-30 SD Cumulative Wake Surplus (min) SD = sleep deprived; Nsd = non-sleep deprived Caf-15: Caffeine, 15 mg/kg ip Caf-30: Caffeine, 15 mg/kg ip
  • 28.
    EEG provides asensitive and reliable measure of both pro- and anti-convulsant activity. EEG can also identify CNS activity that may not be detected by behavioral observation. Pro-convulsant activity is evaluated in terms of the maximal tolerated dose: that dose above which over 50% of animals show unequivocal seizure activity. Anti-convulsant activity is evaluated against PTZ-induced convulsant activity, either at a PTZ dose that produces seizures, or at lower PTZ doses that can be quantitified by their effects on EEG frequency.
  • 29.
    Pro-Convulsive Seizure liabilityCortical seizure induced by H3-R antagonist FFT RT049 10:20:24 205 0:20:24 Wake theta -103 12:59:42 1798 2:59:42 57 EEG FFT 15:14:48 3149 5:14:48 Wake theta 192 16:35:48 3959 6:35:48 Slow rhythmic waves 273 16:35:54 3960 6:35:54 Spike/wave complexes 273 16:36:06 3962 6:36:06 increasing amplitude and frequency of spike-wave complexes 273 16:36:12 3963 6:36:12 273 16:36:18 3964 6:36:18 273 16:36:24 3965 6:36:24 spike-waves with long afterpotentials 273 16:36:36 3967 6:36:36 273 long after- potentials & isoelectricity 16:36:54 3970 6:36:54 Isoelectricity 274 16:37:30 3976 6:37:30 274 16:37:48 3979 6:37:48 Isoelectricity 275 16:41:48 4019 6:41:48 EEG recovery 279 Time of day Time > recording start Min. from start EEG recording scale: ± 500 µV) 16:41:48 4019 6:41:48 279 Epoch Dosing Slow spiking
  • 30.
    Epoch 2154 (3:35:18 post recording start) Dosing: 2:37:12 (~60 min > PTZ @ 40 mg/kg SC) Epoch 2156 (3:35:30) (~60 min > PTZ dosing) EEG Pattern Following PTZ Administration Rat RT022 (PTZ/vehicle treated) File 06291122 29 June 2010 Epoch 2427 (4:02:36) (~85 min > PTZ dosing) The “bursting” pattern produced by doses of PTZ that do not produce overt seizures can be quantified in terms EEG power at a specific frequency. This allows an ED 50 curve to be generated for anti-convulsant activity. This method is applicable to rats and mice. EEG ±500 µV FFT C EEG ±500 µV FFT EEG ±500 µV FFT A B
  • 31.
    Wake Diazepam /Veh PTZ FFT Power 0.0 0.1 0.2 0.3 0.4 0.5 0.6 Veh + PTZ Diaz + PTZ N= 5 / group * p= 0.005 p= 0.71 p= 0.72 0 5 10 15 20 25 30 35 40 Vehicle + PTZ Diazepam + PTZ Seizure Onset Latency (min p= 0.006 * Onset (min) to first PTZ burst following PTZ dosing Diazepam Blocks PTZ-Induced Rhythmic EEG Activity PTZ-induced bursting was quantified by FFT analysis and shown to be specifically reduced by diazepam.
  • 32.
    RT034 e2011 0.000.10 0.20 0.30 0.40 1 2 3 4 5 6 7 Evaluation of Drug-Induced EEG Frequency Changes 10 min Pre-dosing FFT* 71 min Post-dosing Raw EEG (6 sec epoch) FFT Power: Pre -> Post dosing Frequency (Hz) FFT amplitude (power) -10 20 71 345 570 Time post dosing (min) Pre 20 min post * Fast Fourier Transform: power as a function of deconvoluted waveform frequency Each curve = average of 5 – 6 min of EEG at each time point. RT034 e1232 This drug produced an unexpected increase in slow-wave (delta) activity indicating potential sedative or hypnotic application.
  • 33.
    THE END PublicationsLe S, JA Gruner, JR M athiasen, MJ Marino, and H Schaffhauser. (2008). Correlation between ex vivo receptor occupancy and wake promoting activity of selective H3 receptor antagonists. J Pharmacol Exp Ther. 325:902-9. Fiocchi EM, YG Lin, L Aimone, JA Gruner, DG Flood. (2009). Armodafinil promotes wakefulness and activates Fos in rat brain. Pharmacol Biochem Behav. May;92:549-57. Gruner JA, VR Marcy, Y-G Lin, D Bozyczko-Coyne, MJ Marino, M Gasior. 2009. The Roles of Dopamine Transport Inhibition and Dopamine Release Facilitation in Wake Enhancement and Rebound Hypersomnolence Induced by Dopaminergic Agents. Sleep 32:1425-1438. Gruner JA, JR Mathiasen, DG Flood, MJ Marino, M Gasior. 2011. Biochemical, pharmacological, and behavioral characterization of the dopaminergic stimulant sydnocarb in rats. J. Pharmacol. Expt. Ther.. 337:380-90. Hudkins RL, Raddatz R, Tao M, Mathiasen JR, Aimone LD, Becknell NC, Prouty CP, Knutsen LJ, Yazdanian M, Moachon G, Ator MA, Mallamo JP, Marino MJ, Bacon ER, Williams M. 2011. Discovery and Characterization of 6-{4-[3-(R)-2-Methylpyrrolidin-1-yl)propoxy]phenyl}-2H-pyridazin-3-one (CEP-26401, Irdabisant): A Potent, Selective Histamine H(3) Receptor Inverse Agonist. J Med Chem. 54:4781-92. Papers in progress Gruner JA, VR Marcy, Y-G Lin, MJ Marino. The Relative Efficacies of Caffeine, Amphetamine, and Modafinil in the Presence and Absence of Sleep Deprivation in the Rat. 2009. ( In preparation ) Raddatz R, RL Hudkins, JR Mathiasen, JA Gruner, S Le, H Schaffhauser, D Bozyczko-Coyne, MJ Marino, MA Ator, ER Bacon, JP Mallamo, M Williams. A potent and selective histamine H3 receptor antagonist/ inverse agonist with cognition-enhancing and wake promoting activities. ( In preparation. ) Gasior M, JA Gruner, VR Marcy, Y-G Lin, MJ Marino. Wake Promoting Effects of Nicotine are Mediated by alpha-4 beta-2 and alpha-7 Subunit-Containing Nicotinic Acetylcholine Receptors in Rats. ( In preparation. )