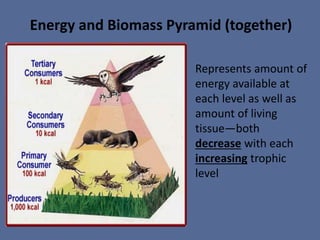
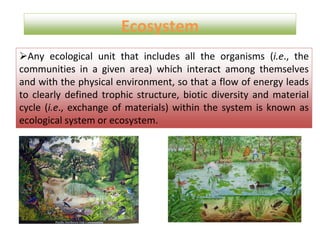
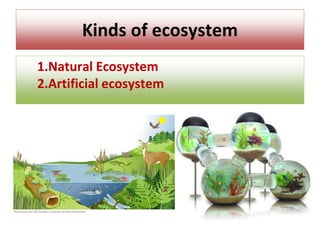
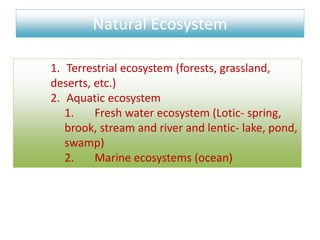
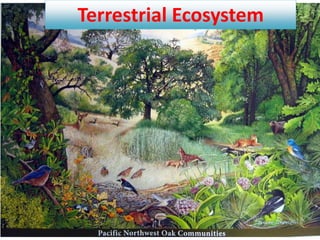
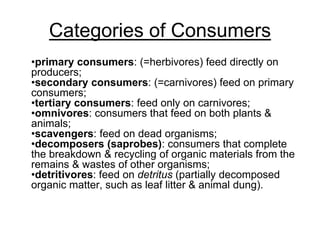
Mahabubur Rahman (Farhad)
Lecturer
Department of Fisheries and Marine Science
Noakhali Science and Technology University
EDITED BY:Al Nahian AVRO
FIMS 11th batch of NSTU
Ecosystem
Ecosystem
Any ecological unit that includes all the organisms (i.e., the
communities in a given area) which interact among themselves
and with the physical environment, so that a flow of energy leads
to clearly defined trophic structure, biotic diversity and material
cycle (i.e., exchange of materials) within the system is known as
ecological system or ecosystem.
Kinds of ecosystem
1.Natural Ecosystem
2.Artificial ecosystem
Natural Ecosystem
1. Terrestrial ecosystem (forests, grassland,
deserts, etc.)
2. Aquatic ecosystem
1. Fresh water ecosystem (Lotic- spring,
brook, stream and river and lentic- lake, pond,
swamp)
2. Marine ecosystems (ocean)
Classification of ecosystem
Terrestrial Ecosystem
Major components of terrestrial ecosystems.
Fresh water ecosystem
Marine water ecosystem
Artificial ecosystem
Natural vs Artificial Ecosystem
Structure of Ecosystem
The structure of an ecosystem is basically a description of the
species of organisms that are present, including information on
their life histories, populations and distribution in space. It also
includes information on the non-living features of environment,
including the amount and distribution of nutrients.
1.Abiotic or non-living components
2.Biotic or living components
1.Abiotic or non-living components
1.Climatic condition and physical factors (air, water, soil,
temperature, light, moisture, pH etc.)
2.Inorganic substances (water, carbon, nitrogen, sulphur,
phosphorus)
3.Organic substances (proteins, carbohydrates, lipids, humic
substances, etc.)
2. Biotic or living components
1.Autotrophic component (Auto=self, trophic=nourishing)
Autotrophic component of ecosystem includes the producers
or energy transducers which convert solar energy into
chemical energy with the help of simple inorganic substances
such as water and carbon dioxide and organic substances such
as enzymes. Autotrophs are also called producers.
Autotrophs fall into two groups:
1.Photoautotrophs
2.Chemoautotrophs
Photosynthesis
ii) Heterotrophs (hetero=other; trophic=nourishing)
Heterotrophic organisms are called consumers as they
consume the matter built up by the producers. The consumers
are of two main type:
1.Macroconsumers (Primary consumer-herbivore animals like
insects, zooplanktons, deer, cattle and elephant; Secondary
consumer and tertiary consumer.
2.Microconsumers: these are also called decomposers,
reducers, saprotrophs and scavangers. (Bacteria, fungi and
actinomycetes)
Categories of Consumers
•primary consumers: (=herbivores) feed directly on
producers;
•secondary consumers: (=carnivores) feed on primary
consumers;
•tertiary consumers: feed only on carnivores;
•omnivores: consumers that feed on both plants &
animals;
•scavengers: feed on dead organisms;
•decomposers (saprobes): consumers that complete
the breakdown & recycling of organic materials from the
remains & wastes of other organisms;
•detritivores: feed on detritus (partially decomposed
organic matter, such as leaf litter & animal dung).
The Importance of Decomposers
Pond Ecosystem
Abiotic component: heat, light, pH, carbon dioxide gas, oxygen
gas, calcium, nitrogen, phosphates, amino acids, humic acid, etc.
Biotic component:
1.Producres:
1. Macrophytes: These include mainly the rooted large
sized plants which comprising three types of hydrophytes-
floating, submerged and emergent aquatic plants (Trapa,
Typha, Nymphaea, Hydrilla, Nelumbo, etc.)
2. Phytoplanktons: These are microscopic, floating or
suspended lower plants that are distributed through out the
water (Spirogyra, Ulothrix, Zygnema, Chlorella, Closterium,
Cosmarium, Volvox, Diatoms, Anabeana, Oscillatoria,
Spirulina, etc.)
b) Macroconsumers:
1.Herbivores (primary consumers):
1. Benthos (Fish, insect, beetles, molluscs, crustaceans
etc.)
2. Zooplankton (Brachionus, Asplanchna, Lecane,
Euglena, Coleps, Dileptus, Cyclops, etc.)
ii) Carnivore order-1 (Secondary consumers): insects, fish,
and amphibians.
iii) Carnivoe order-2 (Tertiary consumers): these are some
large fish that feed on the smaller fish.
Decomposers (Microconsumers): Among fungi species
Aspergillus, Cladosporium, Pythium, Peniccillium, Circinella,
Fusarium, Saprolegnia etc.
Major components of aquatic ecosystems.
Function of an Ecosystem
Productivity of Ecosystem ( The productivity of an
ecosystem refers to the rate of production, i.e., the
amount of organic matter accumulated in any unit
time.)
1.Primary productivity
1. Gross primary productivity
2. Net primary productivity
2. Secondary productivity
3. Net productivity
Primary Productivity of Ecosytem
•1.Gross primary productivity (GPP) is the rate at
which an ecosystem's producers convert solar
energy into chemical energy as biomass.
•2. Net primary productivity (NPP) is the rate at
which energy for use by consumers is stored in new
biomass.
•NPP = GPP – R [rate at which producers use
biomass]
Net Primary Productivity
Estimated annual net primary productivity of major
biomes & aquatic life zones, expressed as kilocalories
per square meter per year.
Fig. 4–24
Fig . illustration of the flow of matter and energy in
ecosystem.
•The transfer of food energy from the source
through a series of organism by regular eating
and eaten up
•In food chain each stage of transfer of food
energy is known as trophic level
•Therefore trophic level refers to successive
levels of energy flow that form the link of food
chain
Food Chain
Food Chain
Food Chain—series of steps in which organisms transfer
energy by eating and being eaten
1. Arrows go in the direction of how energy is
transferred
2. Start with producer and end with top consumer or
carnivore
Ex: grass cricket frog raccoon
Type of food chain
Grazing food chain: Common in nature. Producer
form the first link , herbivores as second and
secondary consumer as the third
Detritus food chain: The organic waste and dead
matter derived from grazing food chain is termed as
detritus. Detrivores are the animal that consume
detritus and in doing so contribute to decomposition
and recycling of nutrient
 e.g. algea, bacteria, earthworms, millipedes
 Organism in this food chain are generally smaller,
and functional role do not fall in catagories
 However grazing and detritus food chain are
interlinked
Food webs
•It is not possible to depict the real world by
means of simple food chain, because the
interconnection between different trophic
level in real world are extremely complex
•Various food chain are interlinked with each
other and these interlocking pattern formed
by several food chain linked together are
called food web
Food Web—network of food chains within an
ecosystem
Which of the organisms above is the producer?
Which of the organisms above is the top consumer?
Hawks
Weasels Raccoon
s
Mice
Grass
Ecological Pyramids
An ecological
pyramid is a diagram
that shows the
relationship amounts
of energy or matter
contained within
each trophic level in
a food web or food
chain.
Pyramids Continued
Biomass pyramids show the total amount of living
tissue available at each trophic level. This shows the
amount of tissue available for the next trophic level.
Numbers pyramid shows the number of species at
each trophic level.
Energy Pyramid only 10 of the energy available within
one trophic level is transferred to organisms at the next
trophic level.
 Because each trophic level harvests only about one
tenth of the energy from the level below, it can support
only about one 10th the amount of living tissue.
Pyramid of Numbers
Pyramid of numbers displays the number of individuals
at each level.
1 owl
25 voles
2000
grass plants
PYRAMID OF BIOMASS
The total amount of matter present in
organisms of an ecosystem at each trophic
level is biomass.
Biomass is preferred to the use of numbers
of organisms because individual organisms
can vary in size. It is the total mass not the
size that is important.
Pyramid of biomass records the total dry
organic matter of organisms at each trophic
level in a given area of an ecosystem.
Biomass Pyramids
Displays the biomass at each trophic level.
PYRAMID OF ENERGY
Shows the amount of energy input to
each trophic level in a given area of an
ecosystem over an extended period.
Energy Pyramid
Fig. 4–19
In nature, ecological
efficiency varies from
5% to 20% energy
available between
successive trophic
levels (95% to 80%
loss). About 10%
efficiency is a general
rule.
Diagram that shows the
relative amount of
energy or organisms
contained within each
trophic level of a food
chain or web
Ecological Pyramids
Energy Pyramid
Biomass Pyramid
100%
10%
1%
0.1%
Represents amount of
energy available at
each level as well as
amount of living
tissue—both
decrease with each
increasing trophic
level
Energy and Biomass Pyramid (together)

Ecosystem in ecology

  • 1.
    Mahabubur Rahman (Farhad) Lecturer Departmentof Fisheries and Marine Science Noakhali Science and Technology University EDITED BY:Al Nahian AVRO FIMS 11th batch of NSTU Ecosystem
  • 2.
    Ecosystem Any ecological unitthat includes all the organisms (i.e., the communities in a given area) which interact among themselves and with the physical environment, so that a flow of energy leads to clearly defined trophic structure, biotic diversity and material cycle (i.e., exchange of materials) within the system is known as ecological system or ecosystem.
  • 3.
    Kinds of ecosystem 1.NaturalEcosystem 2.Artificial ecosystem
  • 4.
    Natural Ecosystem 1. Terrestrialecosystem (forests, grassland, deserts, etc.) 2. Aquatic ecosystem 1. Fresh water ecosystem (Lotic- spring, brook, stream and river and lentic- lake, pond, swamp) 2. Marine ecosystems (ocean)
  • 5.
  • 6.
  • 7.
    Major components ofterrestrial ecosystems.
  • 8.
  • 9.
  • 10.
  • 11.
  • 12.
    Structure of Ecosystem Thestructure of an ecosystem is basically a description of the species of organisms that are present, including information on their life histories, populations and distribution in space. It also includes information on the non-living features of environment, including the amount and distribution of nutrients. 1.Abiotic or non-living components 2.Biotic or living components
  • 13.
    1.Abiotic or non-livingcomponents 1.Climatic condition and physical factors (air, water, soil, temperature, light, moisture, pH etc.) 2.Inorganic substances (water, carbon, nitrogen, sulphur, phosphorus) 3.Organic substances (proteins, carbohydrates, lipids, humic substances, etc.)
  • 14.
    2. Biotic orliving components 1.Autotrophic component (Auto=self, trophic=nourishing) Autotrophic component of ecosystem includes the producers or energy transducers which convert solar energy into chemical energy with the help of simple inorganic substances such as water and carbon dioxide and organic substances such as enzymes. Autotrophs are also called producers. Autotrophs fall into two groups: 1.Photoautotrophs 2.Chemoautotrophs
  • 15.
  • 16.
    ii) Heterotrophs (hetero=other;trophic=nourishing) Heterotrophic organisms are called consumers as they consume the matter built up by the producers. The consumers are of two main type: 1.Macroconsumers (Primary consumer-herbivore animals like insects, zooplanktons, deer, cattle and elephant; Secondary consumer and tertiary consumer. 2.Microconsumers: these are also called decomposers, reducers, saprotrophs and scavangers. (Bacteria, fungi and actinomycetes)
  • 17.
    Categories of Consumers •primaryconsumers: (=herbivores) feed directly on producers; •secondary consumers: (=carnivores) feed on primary consumers; •tertiary consumers: feed only on carnivores; •omnivores: consumers that feed on both plants & animals; •scavengers: feed on dead organisms; •decomposers (saprobes): consumers that complete the breakdown & recycling of organic materials from the remains & wastes of other organisms; •detritivores: feed on detritus (partially decomposed organic matter, such as leaf litter & animal dung).
  • 18.
    The Importance ofDecomposers
  • 20.
  • 21.
    Abiotic component: heat,light, pH, carbon dioxide gas, oxygen gas, calcium, nitrogen, phosphates, amino acids, humic acid, etc. Biotic component: 1.Producres: 1. Macrophytes: These include mainly the rooted large sized plants which comprising three types of hydrophytes- floating, submerged and emergent aquatic plants (Trapa, Typha, Nymphaea, Hydrilla, Nelumbo, etc.) 2. Phytoplanktons: These are microscopic, floating or suspended lower plants that are distributed through out the water (Spirogyra, Ulothrix, Zygnema, Chlorella, Closterium, Cosmarium, Volvox, Diatoms, Anabeana, Oscillatoria, Spirulina, etc.)
  • 22.
    b) Macroconsumers: 1.Herbivores (primaryconsumers): 1. Benthos (Fish, insect, beetles, molluscs, crustaceans etc.) 2. Zooplankton (Brachionus, Asplanchna, Lecane, Euglena, Coleps, Dileptus, Cyclops, etc.) ii) Carnivore order-1 (Secondary consumers): insects, fish, and amphibians. iii) Carnivoe order-2 (Tertiary consumers): these are some large fish that feed on the smaller fish. Decomposers (Microconsumers): Among fungi species Aspergillus, Cladosporium, Pythium, Peniccillium, Circinella, Fusarium, Saprolegnia etc.
  • 23.
    Major components ofaquatic ecosystems.
  • 24.
    Function of anEcosystem Productivity of Ecosystem ( The productivity of an ecosystem refers to the rate of production, i.e., the amount of organic matter accumulated in any unit time.) 1.Primary productivity 1. Gross primary productivity 2. Net primary productivity 2. Secondary productivity 3. Net productivity
  • 25.
    Primary Productivity ofEcosytem •1.Gross primary productivity (GPP) is the rate at which an ecosystem's producers convert solar energy into chemical energy as biomass. •2. Net primary productivity (NPP) is the rate at which energy for use by consumers is stored in new biomass. •NPP = GPP – R [rate at which producers use biomass]
  • 26.
    Net Primary Productivity Estimatedannual net primary productivity of major biomes & aquatic life zones, expressed as kilocalories per square meter per year. Fig. 4–24
  • 27.
    Fig . illustrationof the flow of matter and energy in ecosystem.
  • 28.
    •The transfer offood energy from the source through a series of organism by regular eating and eaten up •In food chain each stage of transfer of food energy is known as trophic level •Therefore trophic level refers to successive levels of energy flow that form the link of food chain Food Chain
  • 29.
    Food Chain Food Chain—seriesof steps in which organisms transfer energy by eating and being eaten 1. Arrows go in the direction of how energy is transferred 2. Start with producer and end with top consumer or carnivore Ex: grass cricket frog raccoon
  • 31.
    Type of foodchain Grazing food chain: Common in nature. Producer form the first link , herbivores as second and secondary consumer as the third Detritus food chain: The organic waste and dead matter derived from grazing food chain is termed as detritus. Detrivores are the animal that consume detritus and in doing so contribute to decomposition and recycling of nutrient  e.g. algea, bacteria, earthworms, millipedes  Organism in this food chain are generally smaller, and functional role do not fall in catagories  However grazing and detritus food chain are interlinked
  • 32.
    Food webs •It isnot possible to depict the real world by means of simple food chain, because the interconnection between different trophic level in real world are extremely complex •Various food chain are interlinked with each other and these interlocking pattern formed by several food chain linked together are called food web
  • 33.
    Food Web—network offood chains within an ecosystem Which of the organisms above is the producer? Which of the organisms above is the top consumer? Hawks Weasels Raccoon s Mice Grass
  • 36.
    Ecological Pyramids An ecological pyramidis a diagram that shows the relationship amounts of energy or matter contained within each trophic level in a food web or food chain.
  • 37.
    Pyramids Continued Biomass pyramidsshow the total amount of living tissue available at each trophic level. This shows the amount of tissue available for the next trophic level. Numbers pyramid shows the number of species at each trophic level. Energy Pyramid only 10 of the energy available within one trophic level is transferred to organisms at the next trophic level.  Because each trophic level harvests only about one tenth of the energy from the level below, it can support only about one 10th the amount of living tissue.
  • 38.
    Pyramid of Numbers Pyramidof numbers displays the number of individuals at each level. 1 owl 25 voles 2000 grass plants
  • 39.
    PYRAMID OF BIOMASS Thetotal amount of matter present in organisms of an ecosystem at each trophic level is biomass. Biomass is preferred to the use of numbers of organisms because individual organisms can vary in size. It is the total mass not the size that is important. Pyramid of biomass records the total dry organic matter of organisms at each trophic level in a given area of an ecosystem.
  • 40.
    Biomass Pyramids Displays thebiomass at each trophic level.
  • 41.
    PYRAMID OF ENERGY Showsthe amount of energy input to each trophic level in a given area of an ecosystem over an extended period.
  • 42.
    Energy Pyramid Fig. 4–19 Innature, ecological efficiency varies from 5% to 20% energy available between successive trophic levels (95% to 80% loss). About 10% efficiency is a general rule.
  • 43.
    Diagram that showsthe relative amount of energy or organisms contained within each trophic level of a food chain or web Ecological Pyramids
  • 45.
  • 46.
    Represents amount of energyavailable at each level as well as amount of living tissue—both decrease with each increasing trophic level Energy and Biomass Pyramid (together)