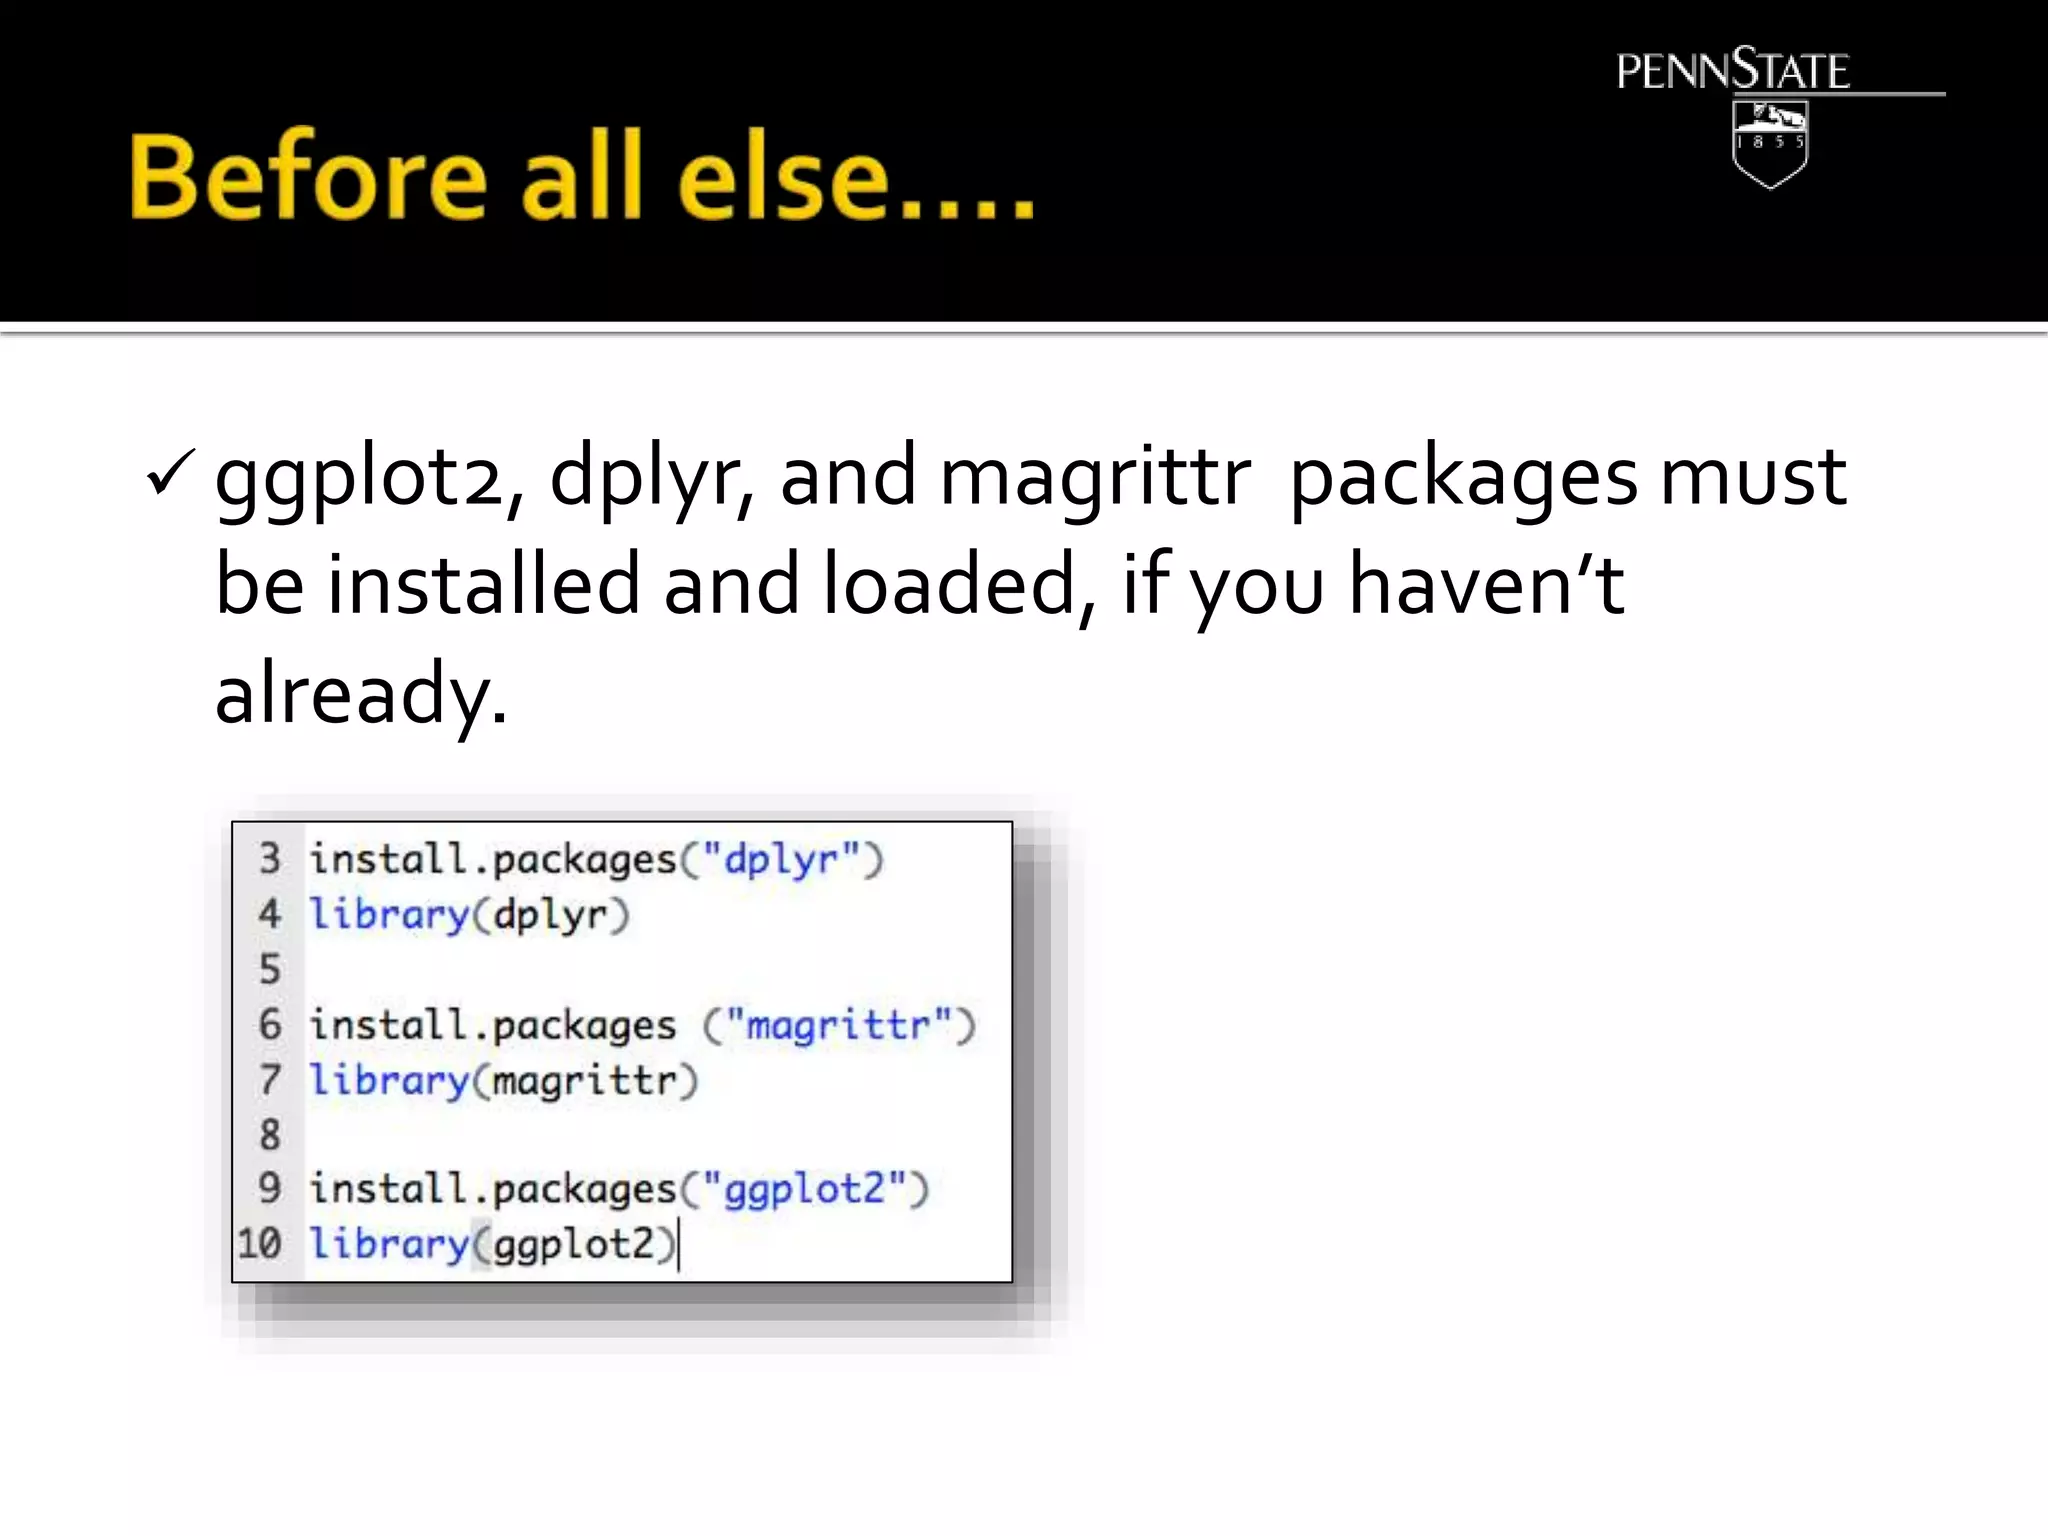
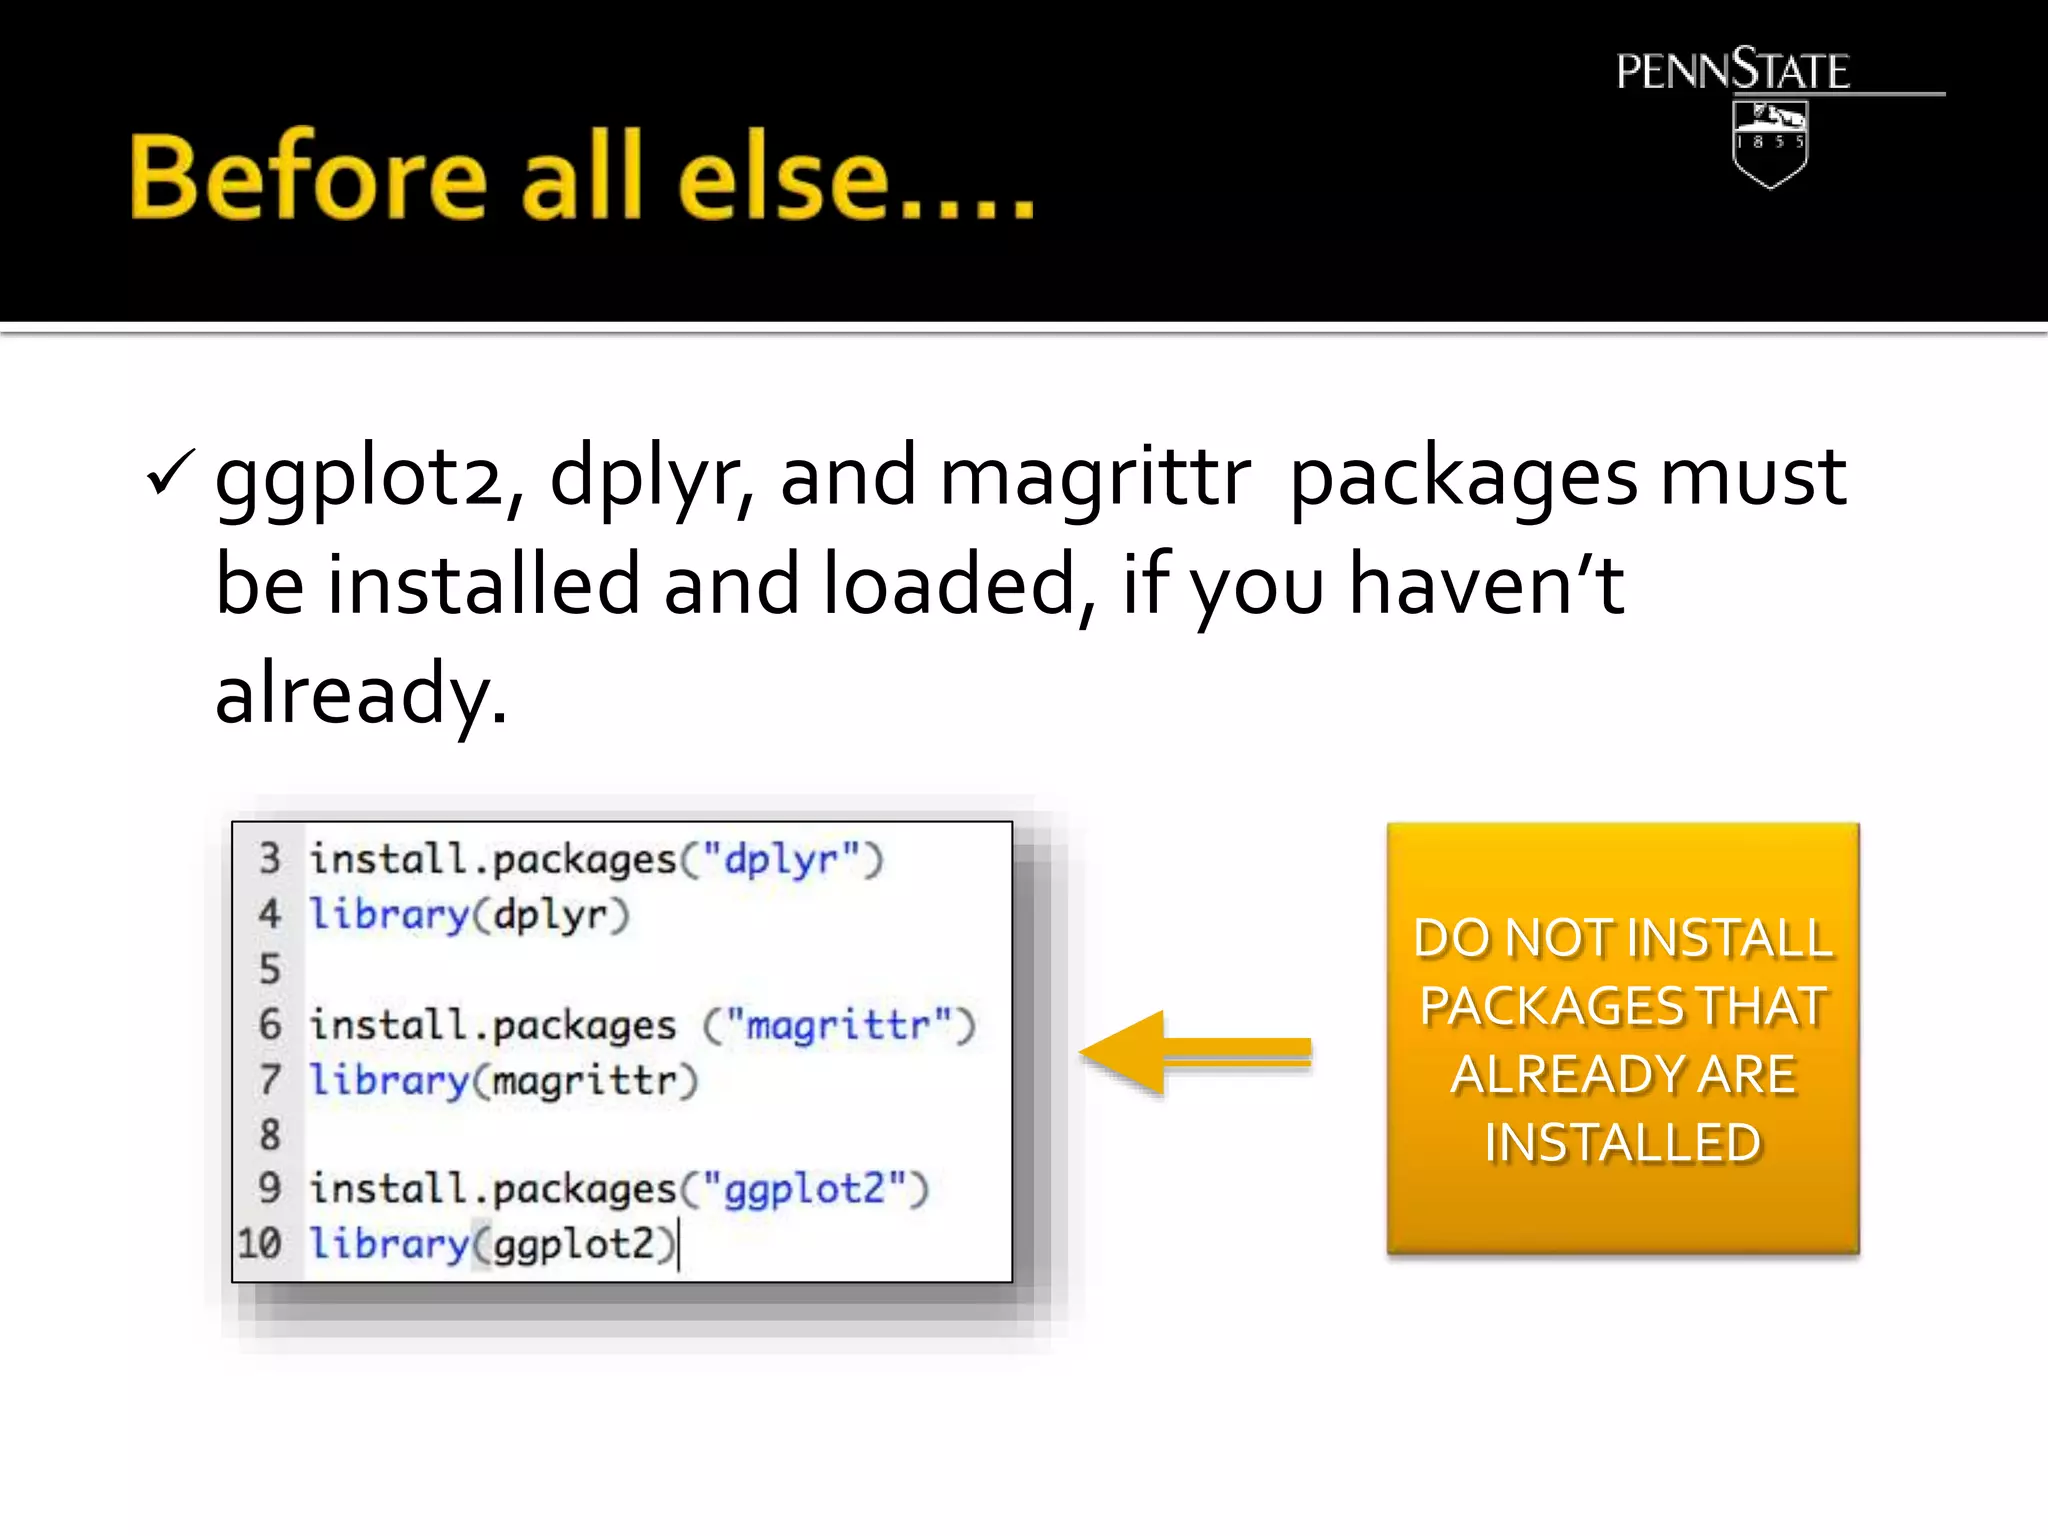
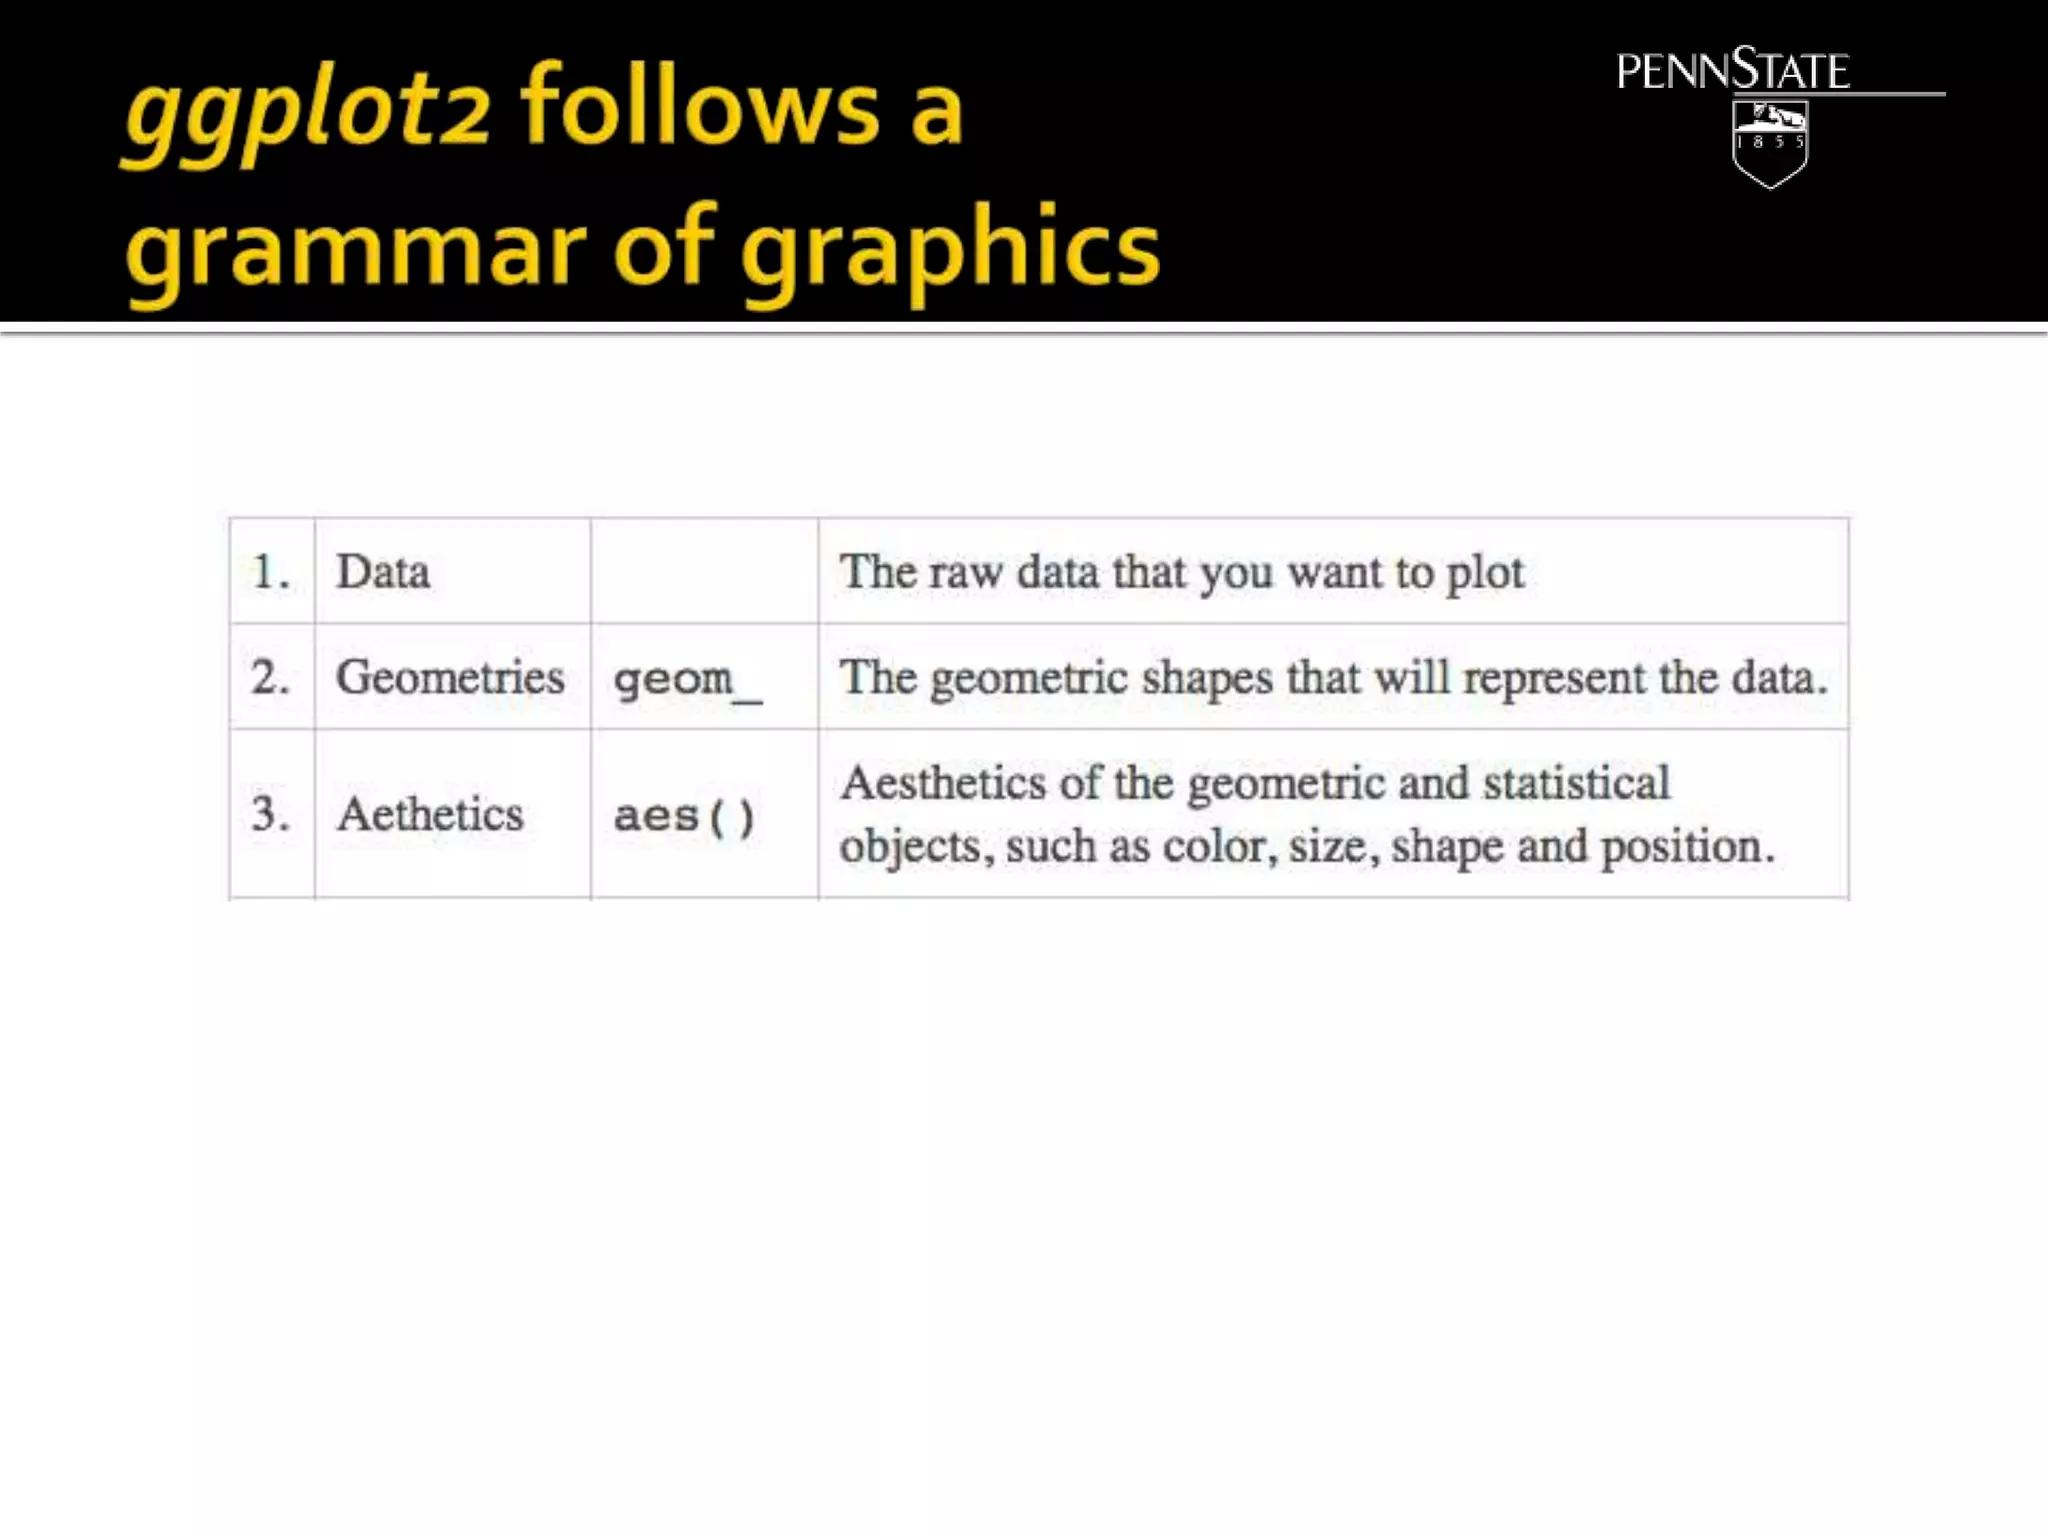
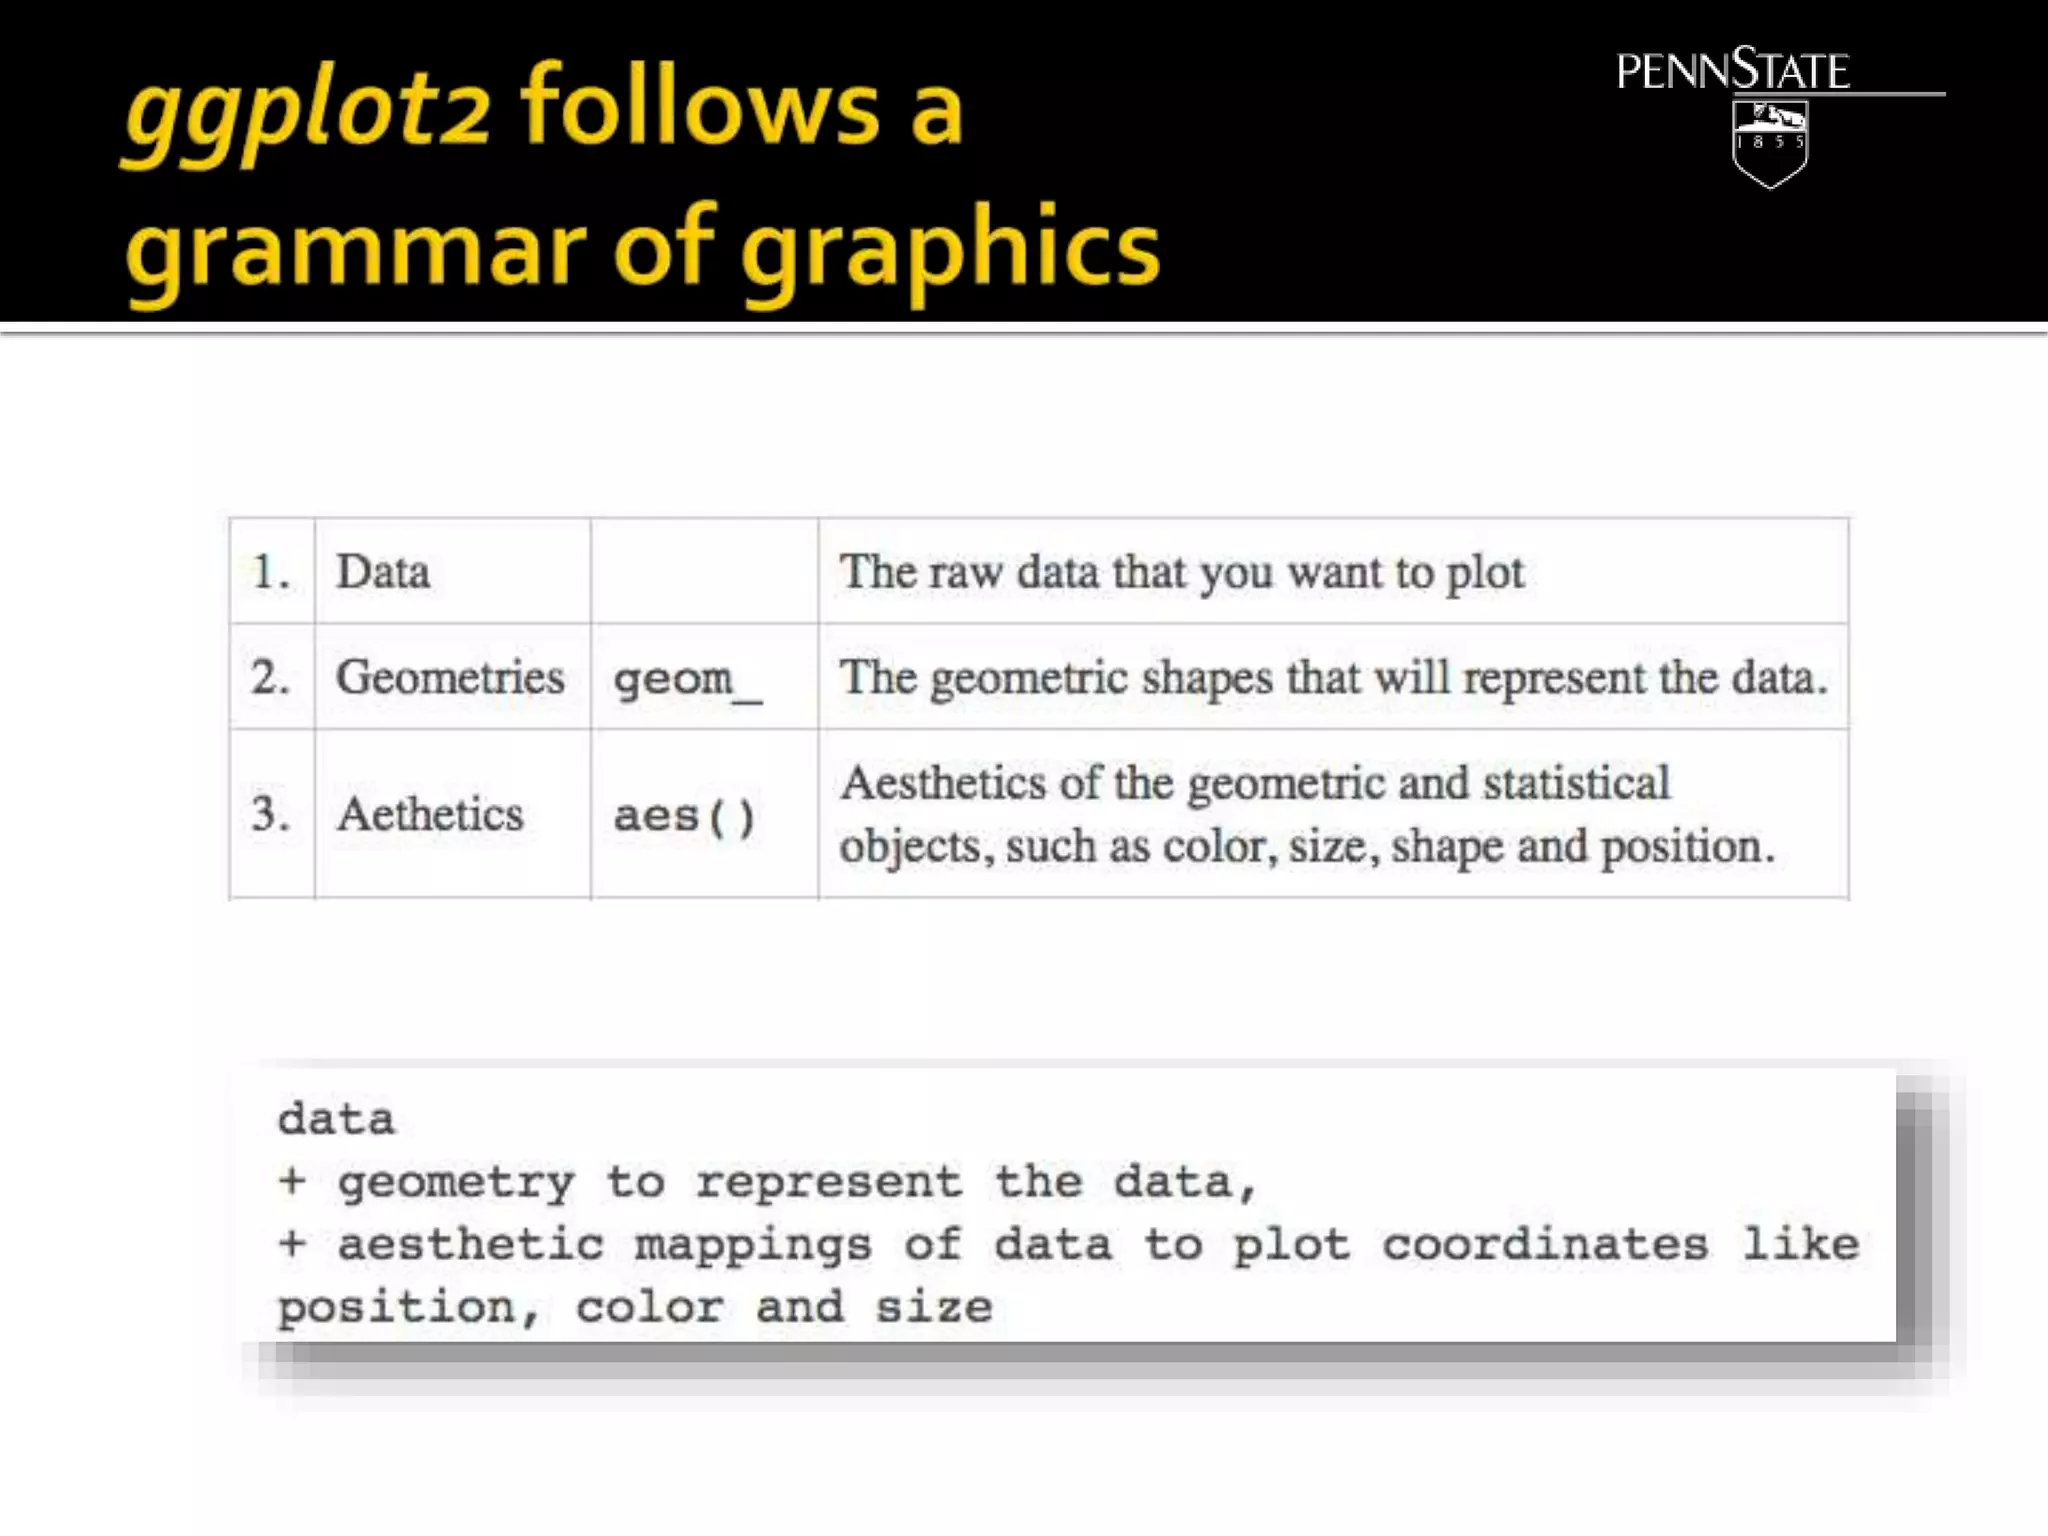
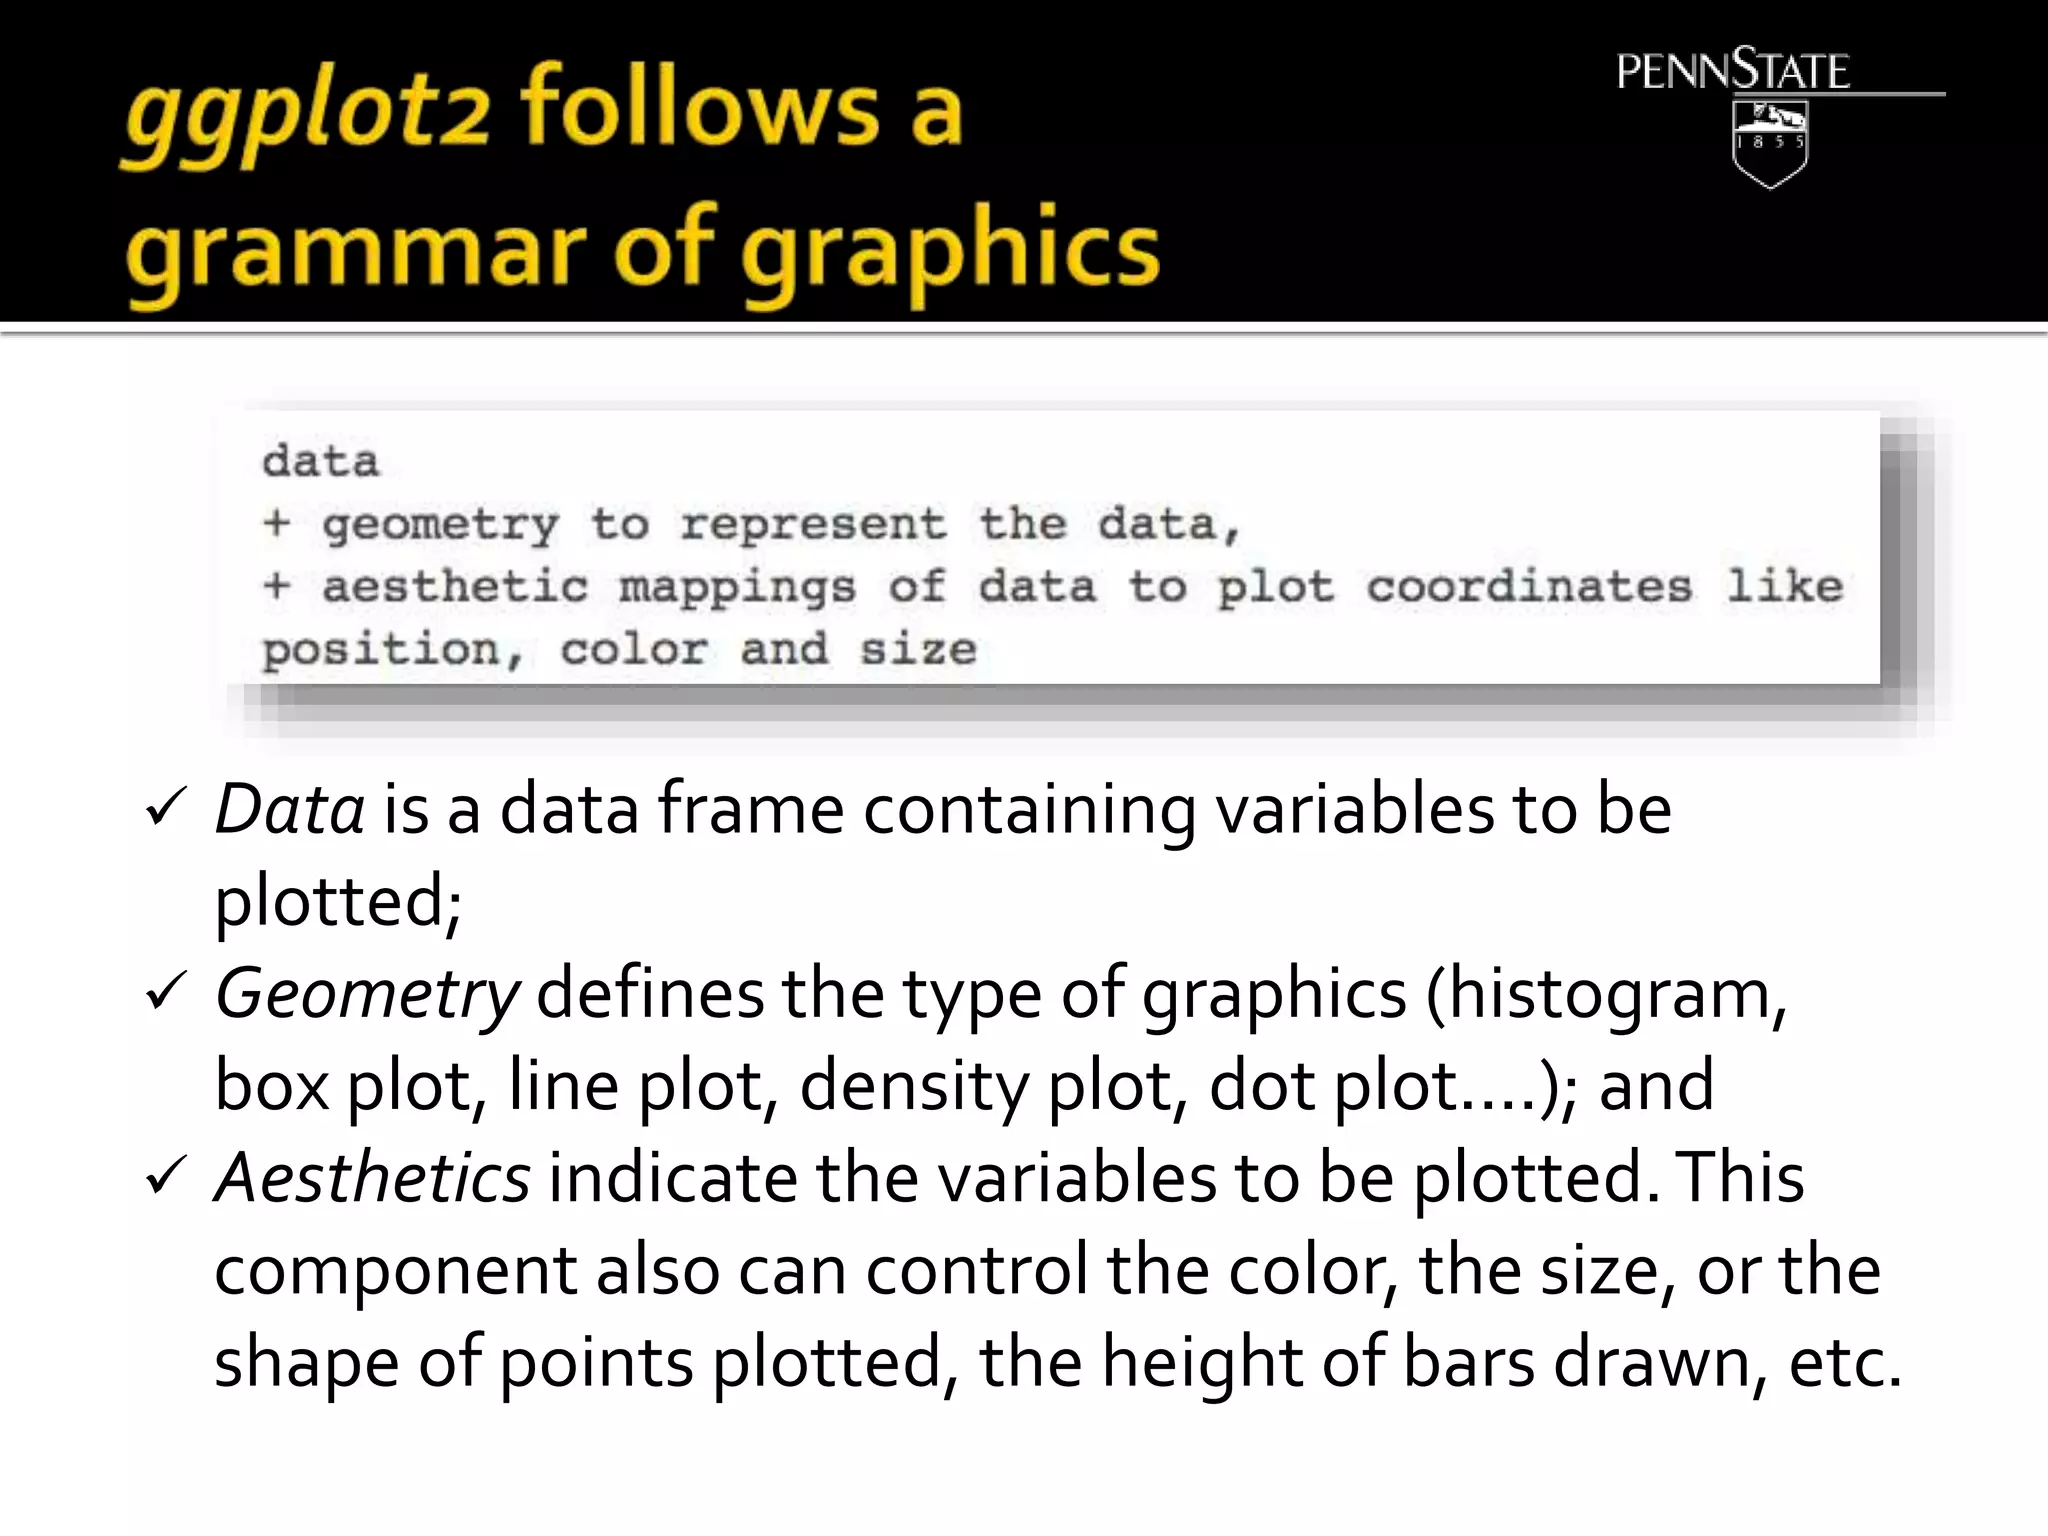
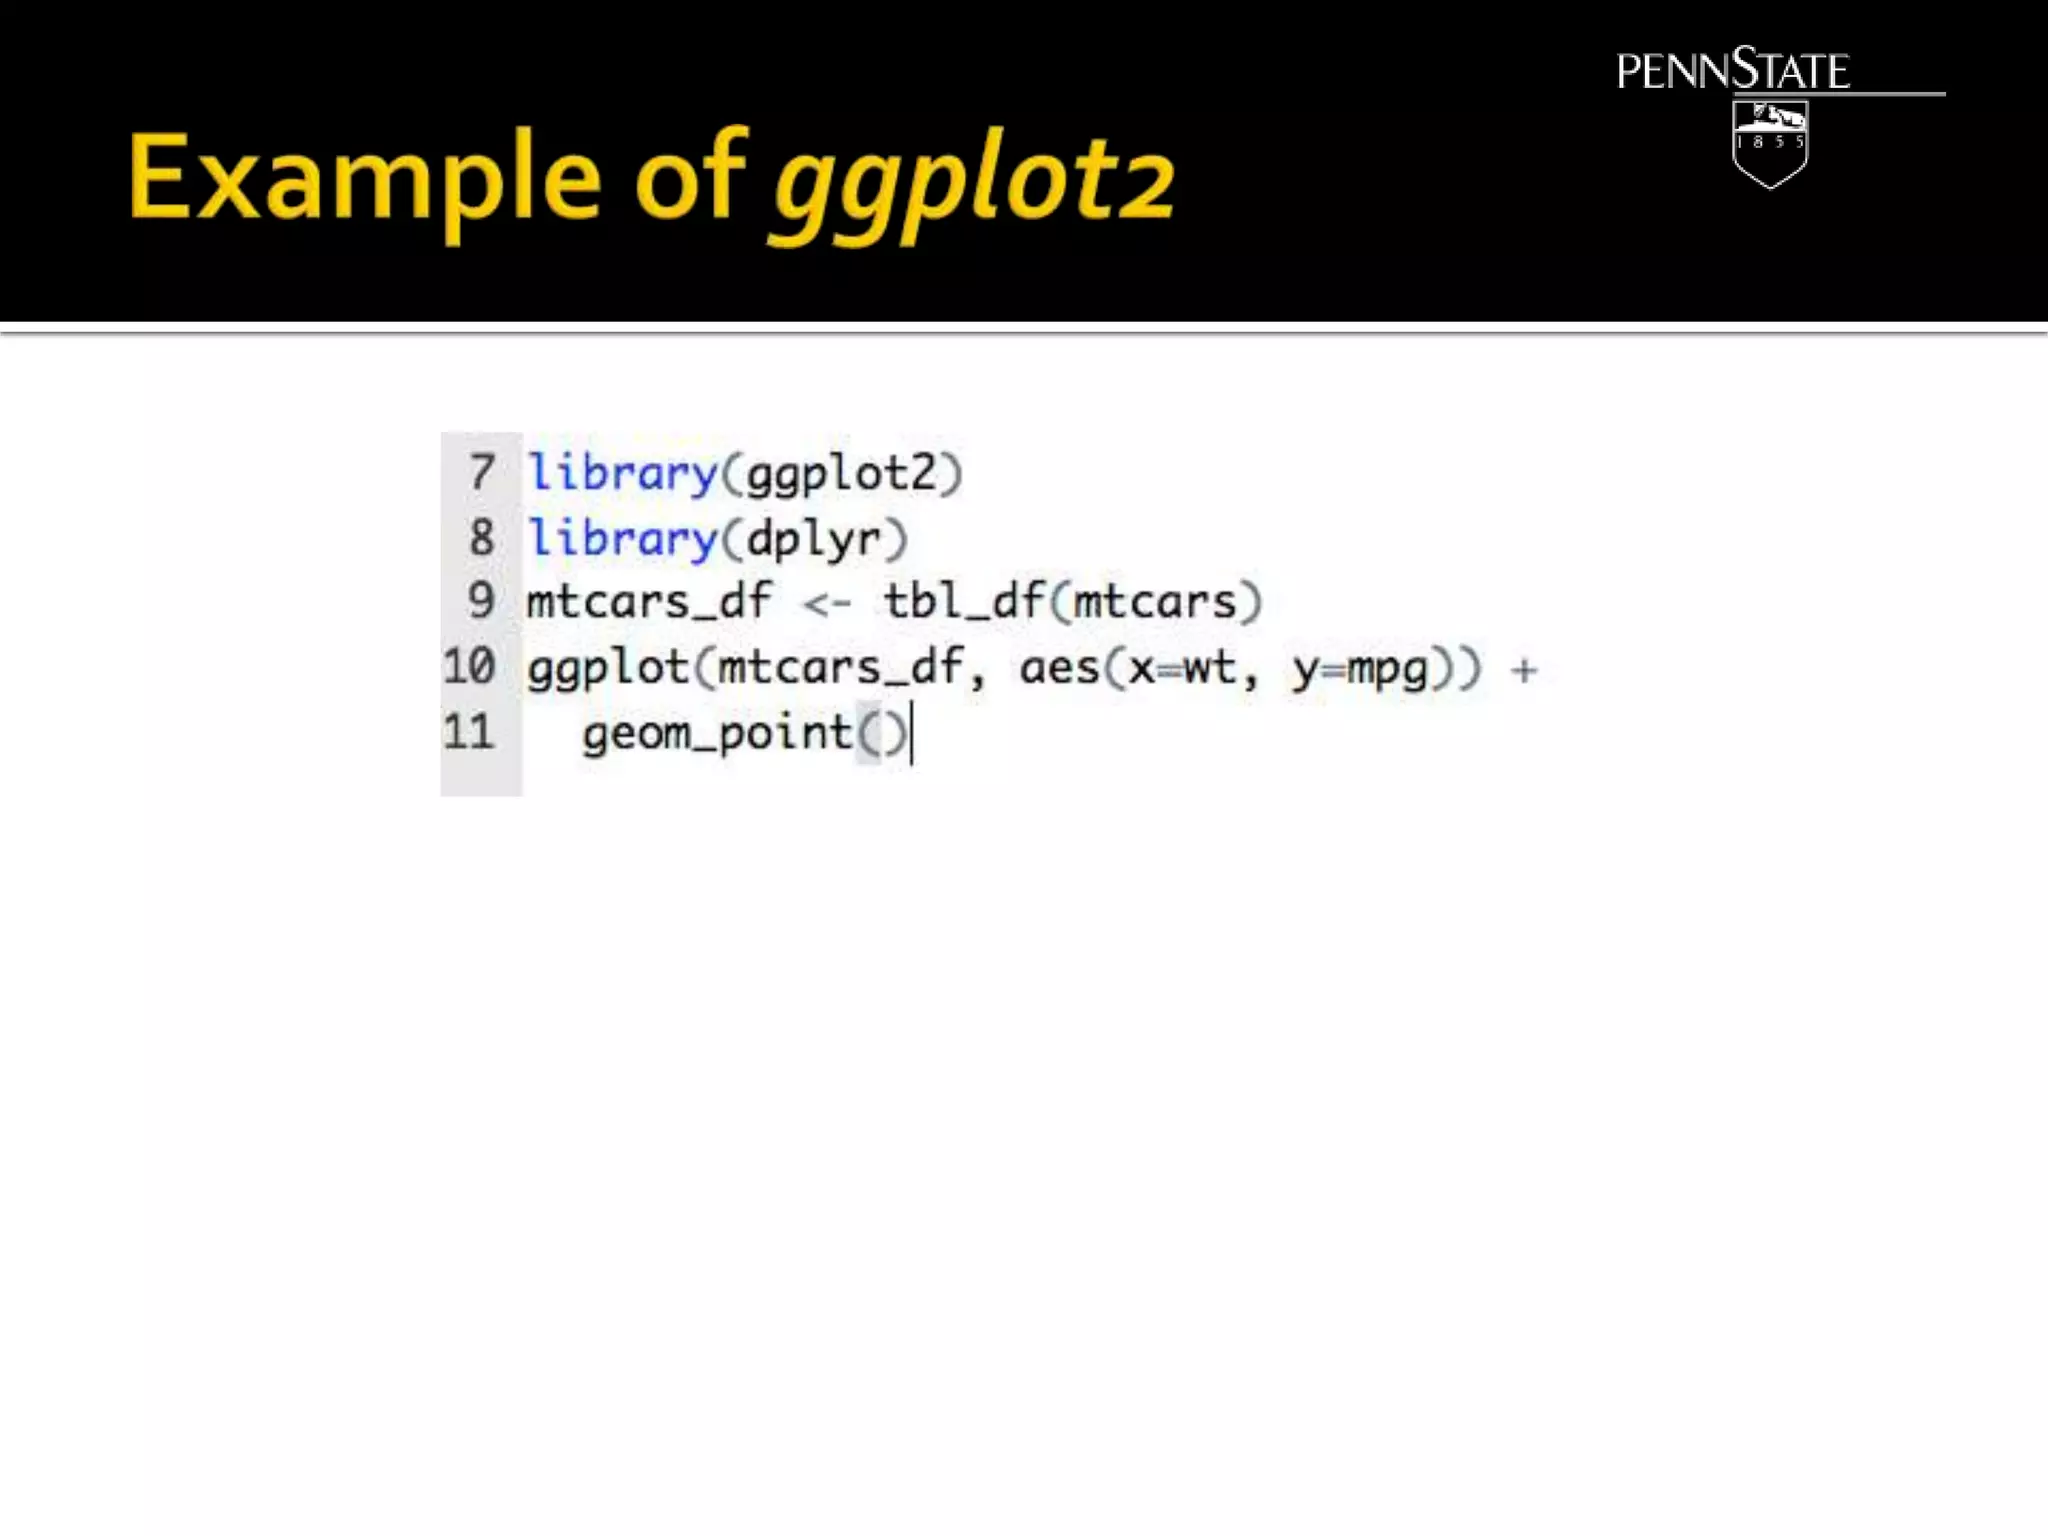
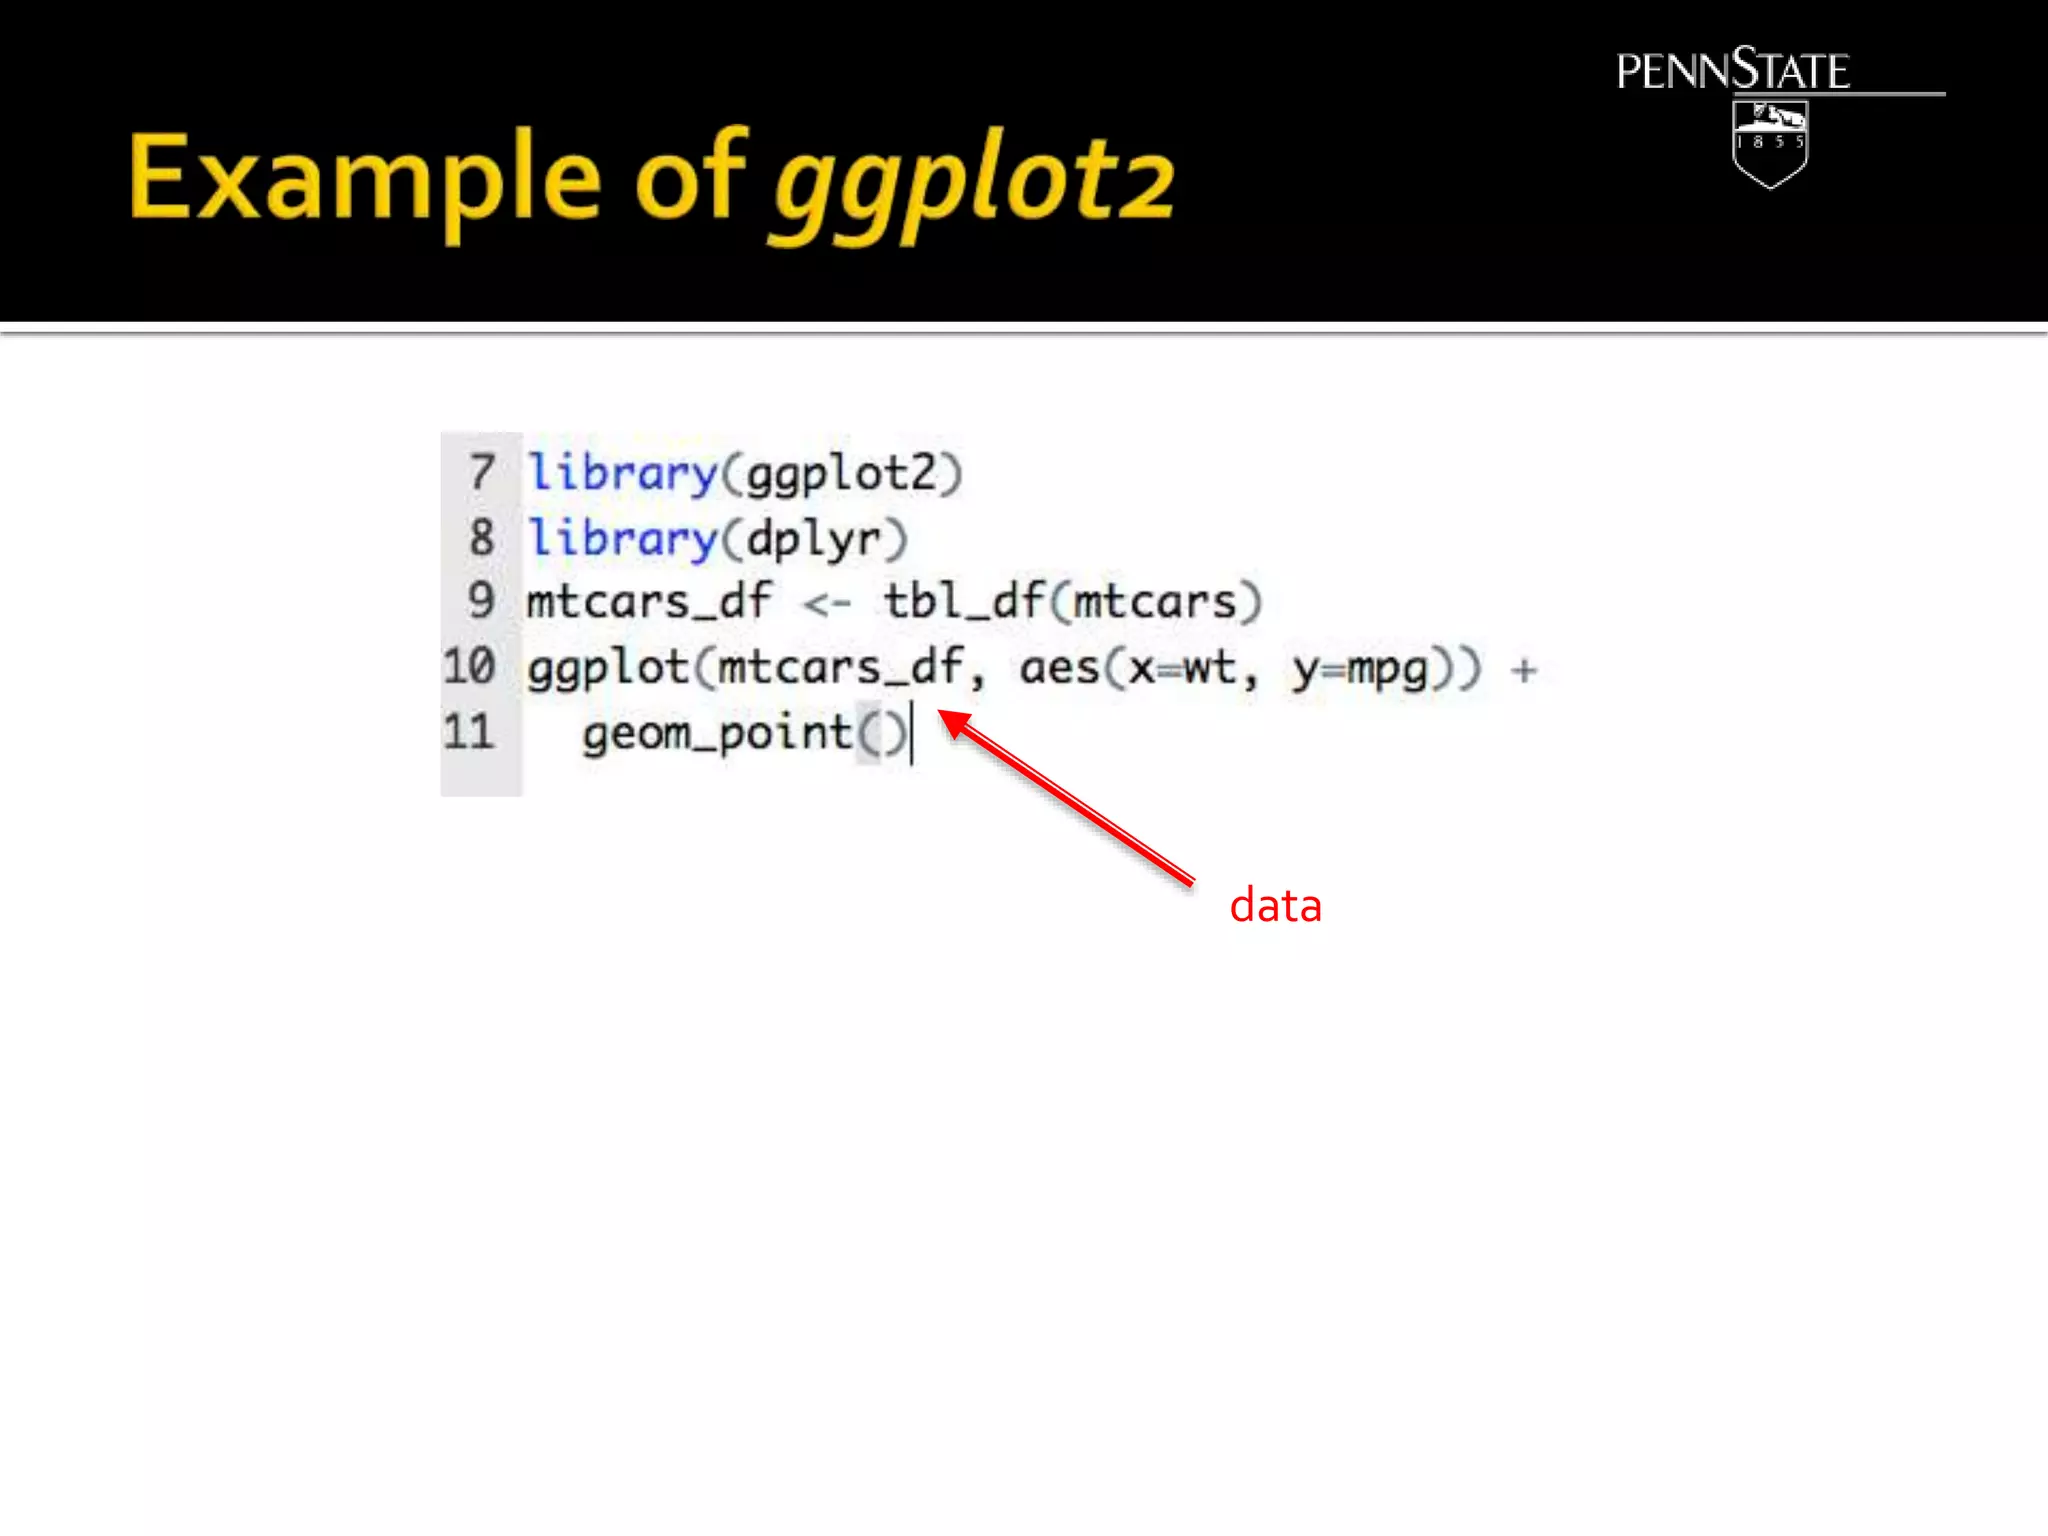
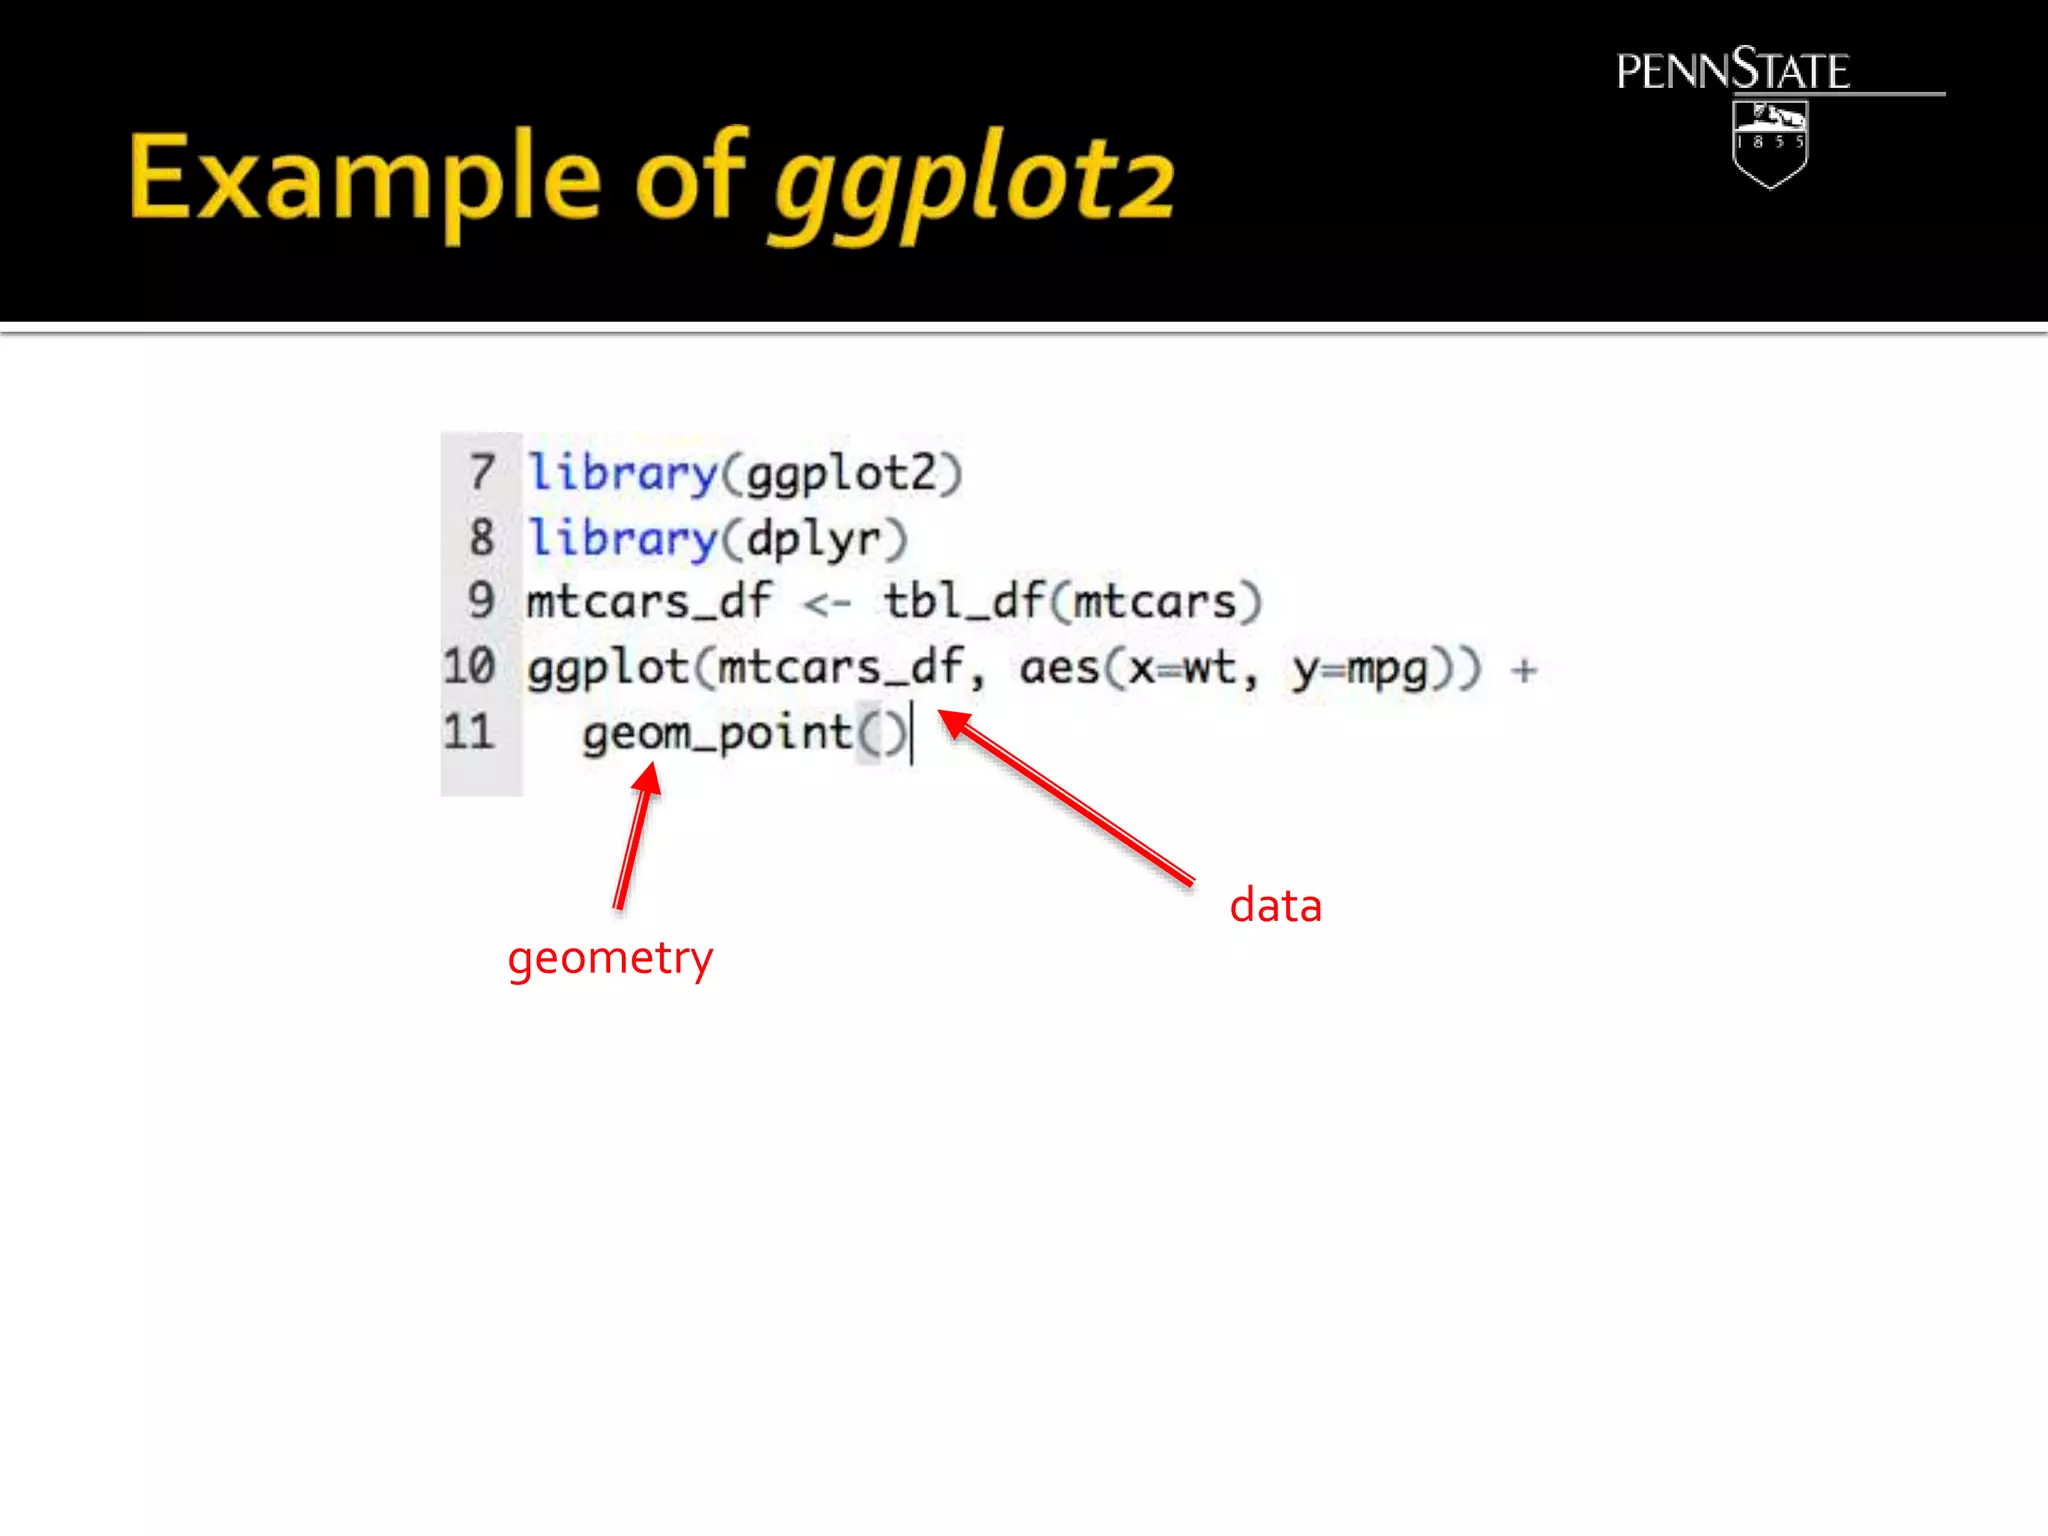
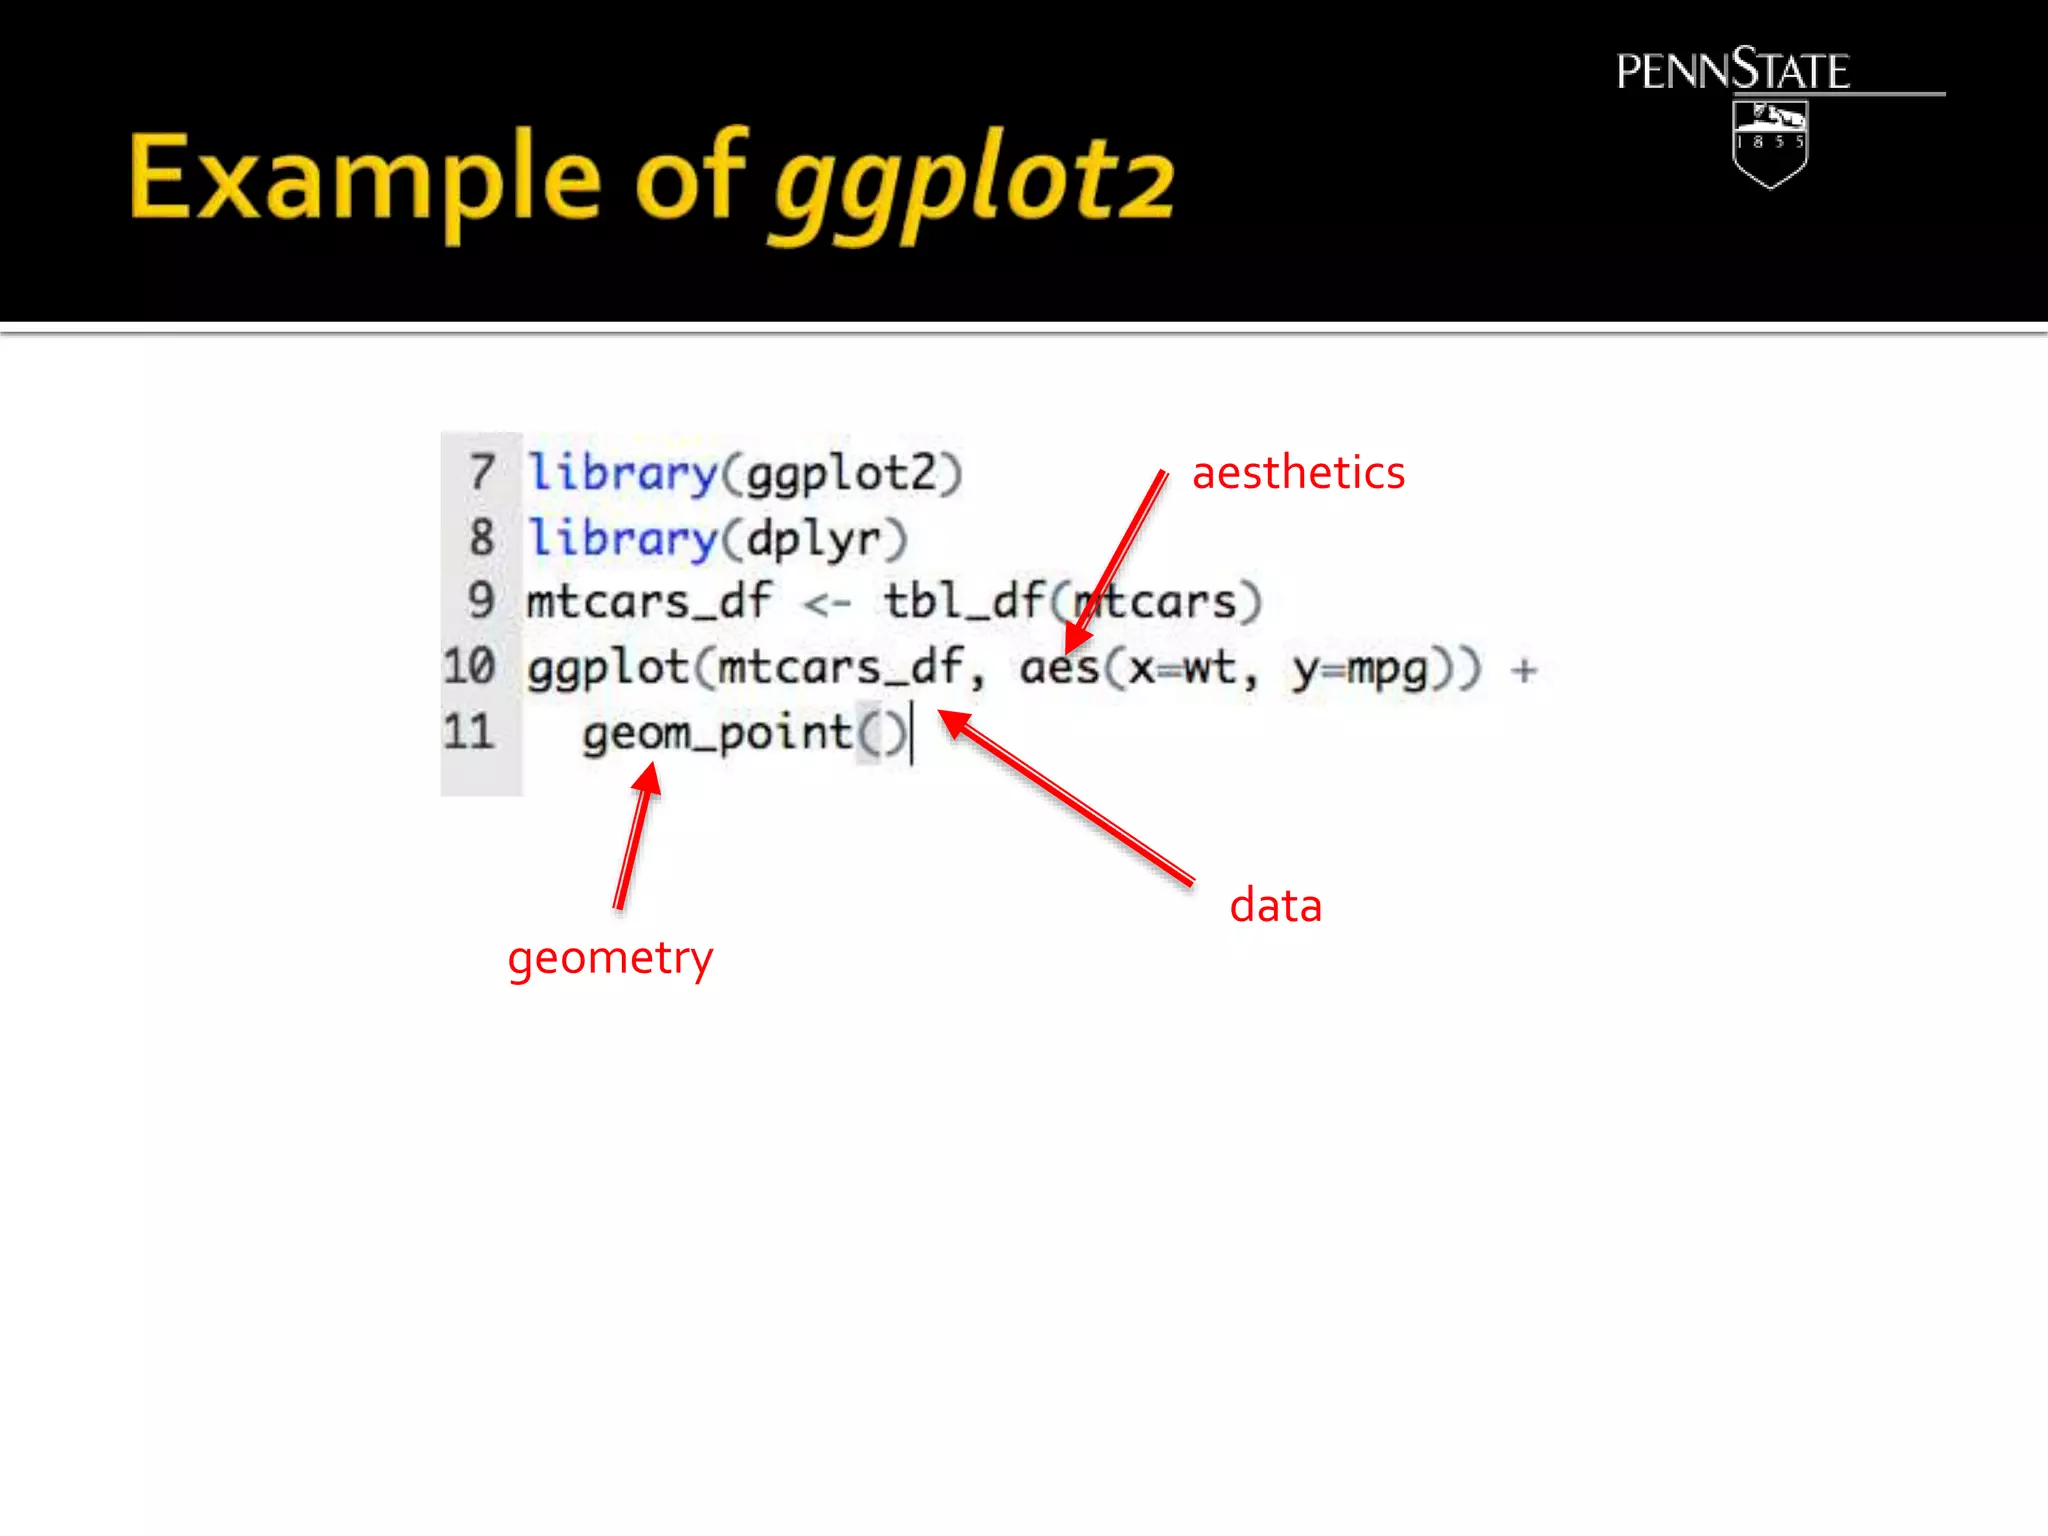
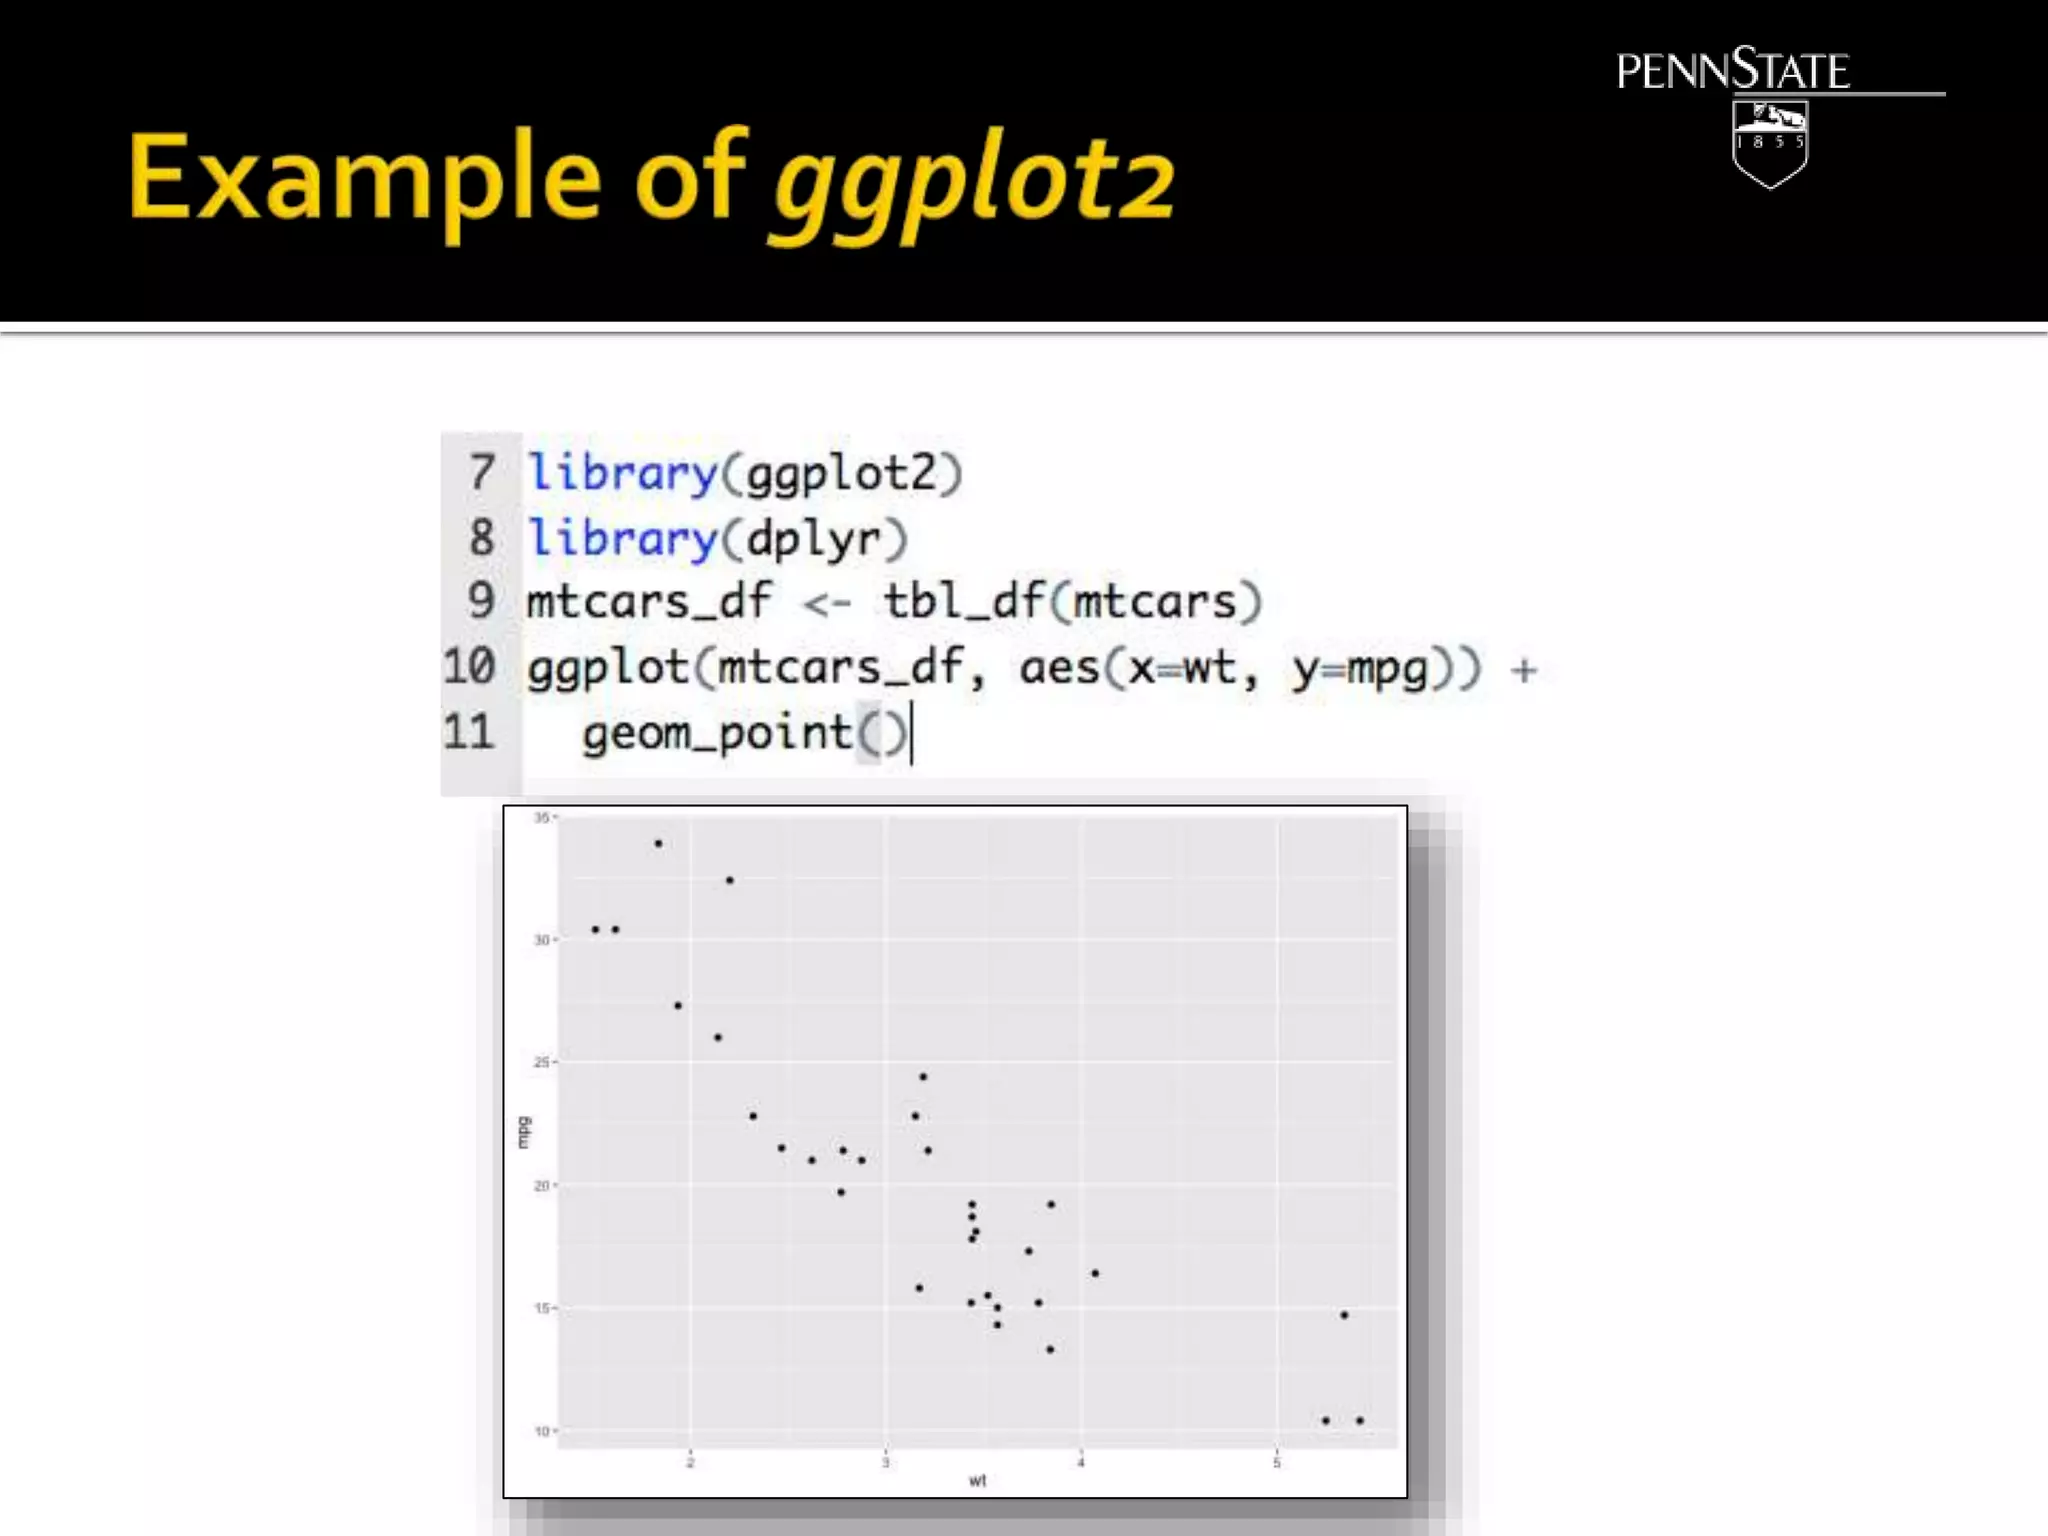
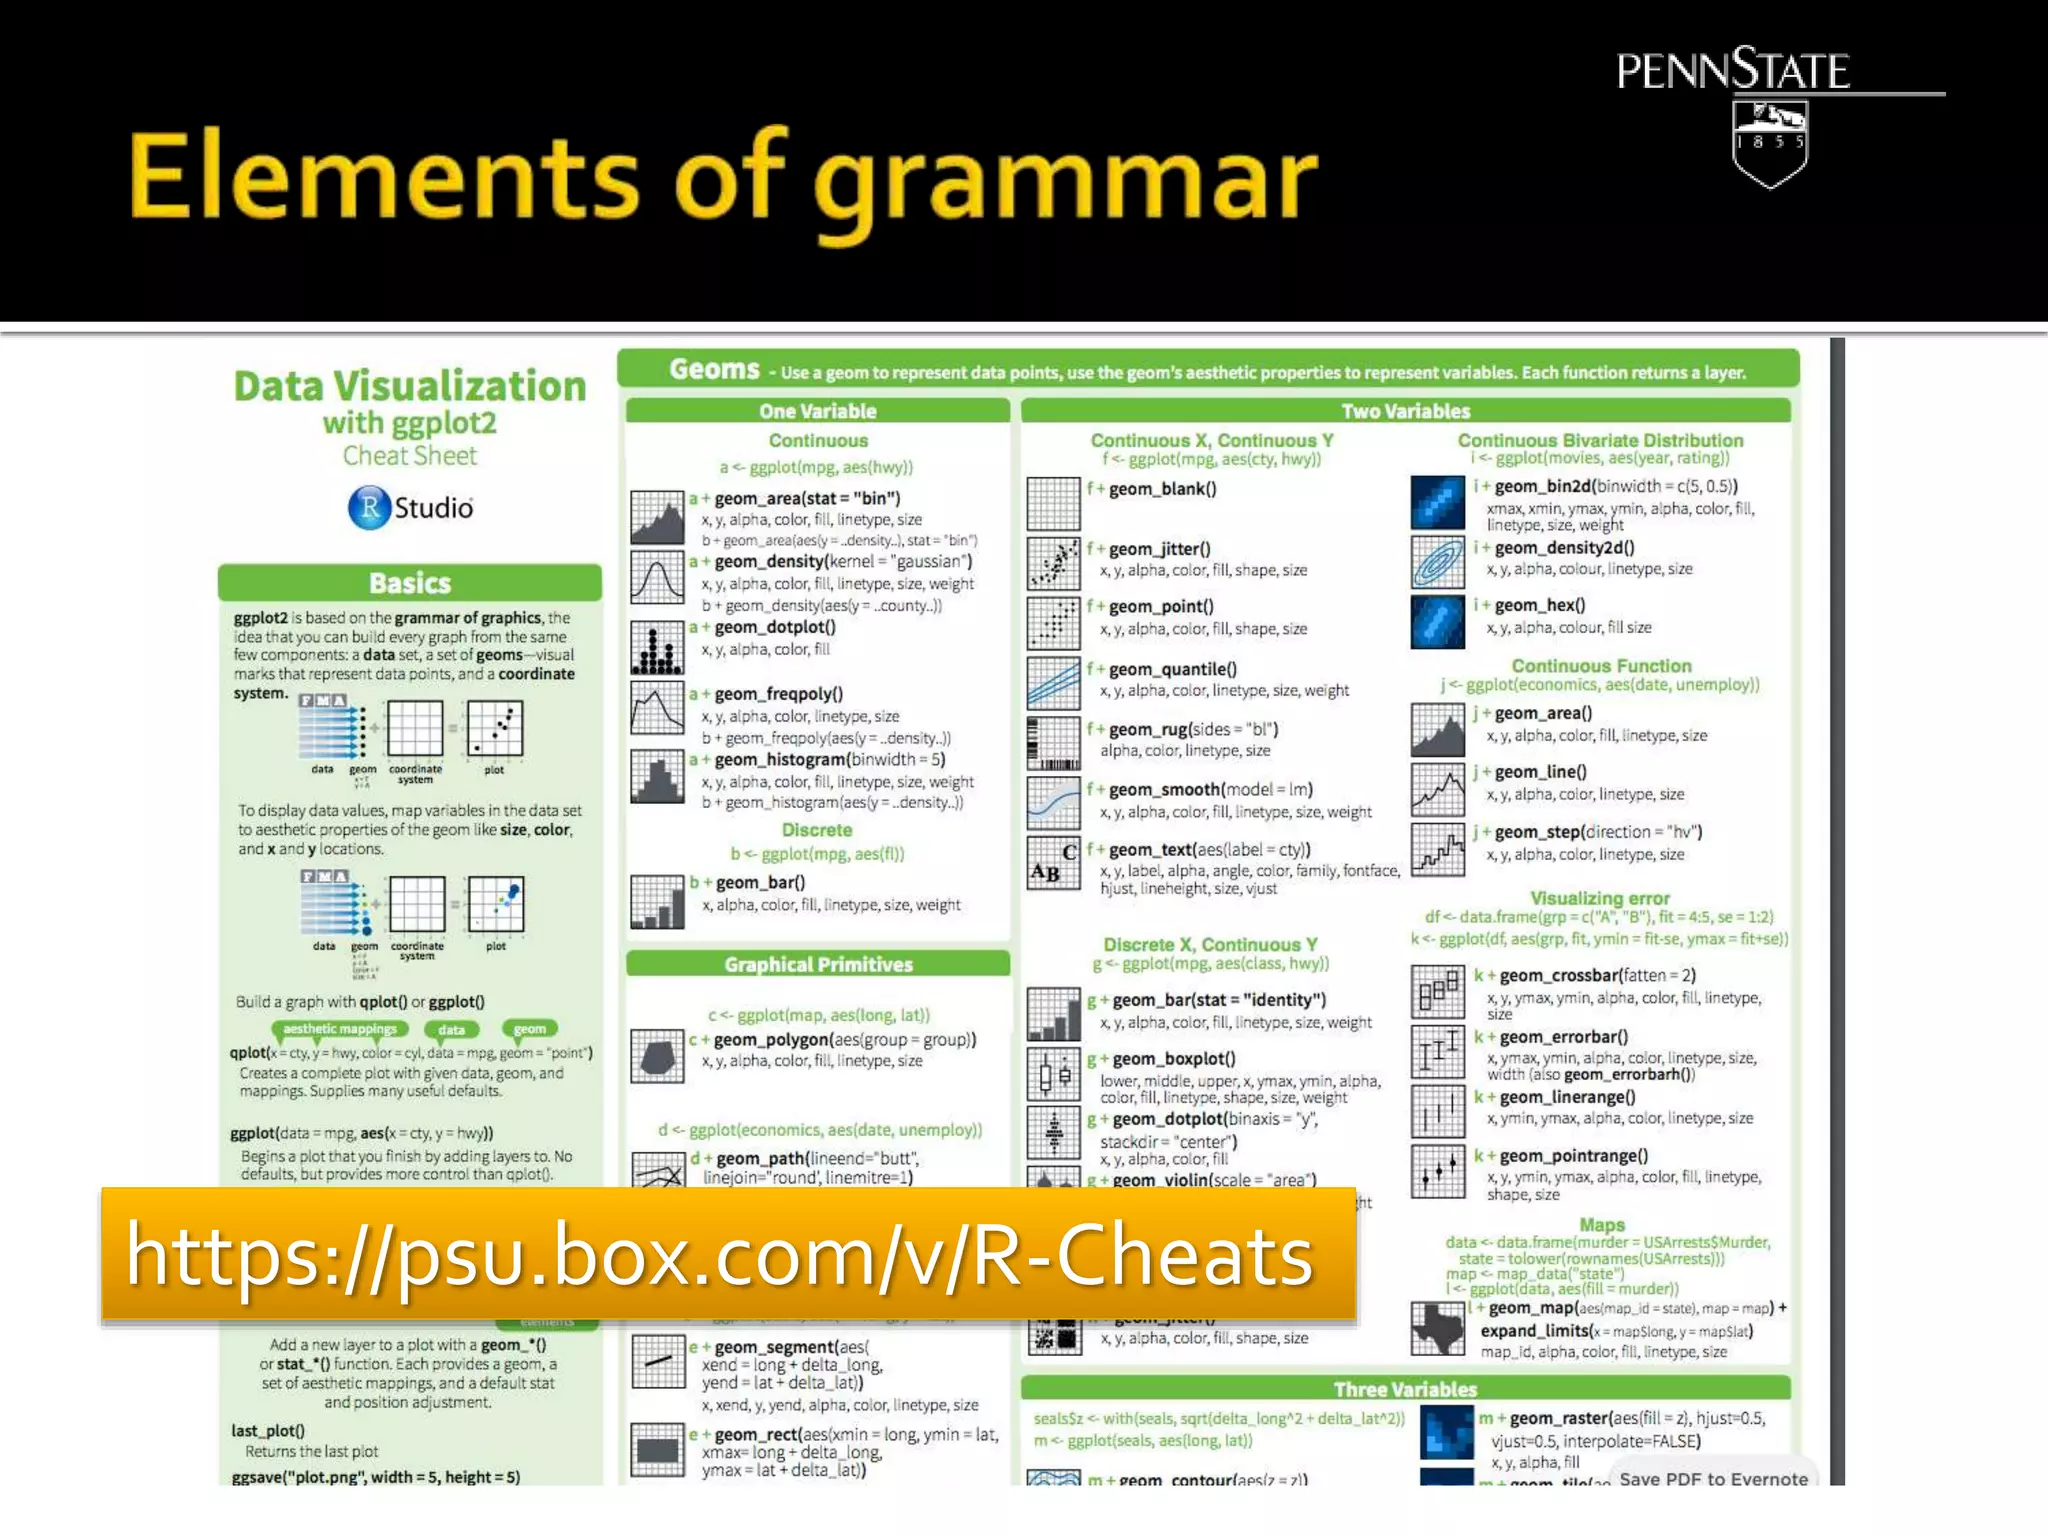
DataAnalysis inWF ED
9 October 2017
 ggplot2, dplyr, and magrittr packages must
be installed and loaded, if you haven’t
already.
 ggplot2, dplyr, and magrittr packages must
be installed and loaded, if you haven’t
already.
DO NOT INSTALL
PACKAGESTHAT
ALREADYARE
INSTALLED
Visualization is any technique for creating images,
diagrams, or animations to communicate a message.
ggplot2 is a data visualization package (one of
many) for the statistical programming language
R.
Created by HadleyWickham in 2005, ggplot2 is
an implementation of LelandWilkinson's
Grammar of Graphics—a general scheme for
data visualization which breaks up graphs into
semantic components such as scales and layers.
 The ggplot2 package must be installed.
 If installed, the ggplot2 package must be
loaded.
 As with all R packages, do not install this
package if the package already is installed—
merely load the installed package.
 A grammar constitutes the structure and
systems for communication.
 A grammar of language consists of syntax
(arrangement of words for meaning) and
morphology (meanings of words in
language).
 A grammar of graphics consist of system of
syntax and meaning to communicate
understanding of data.
 Data is a data frame containing variables to be
plotted;
 Geometry defines the type of graphics (histogram,
box plot, line plot, density plot, dot plot....); and
 Aesthetics indicate the variables to be plotted.This
component also can control the color, the size, or the
shape of points plotted, the height of bars drawn, etc.
data
data
geometry
data
aesthetics
geometry
which is the same as
http://docs.ggplot2.org/current/
https://psu.box.com/v/R-Cheats
DataAnalysis inWF ED
9 October 2017

WF ED 540 - Class Meeting 7 - Fall Semester 2017

  • 1.
  • 3.
     ggplot2, dplyr,and magrittr packages must be installed and loaded, if you haven’t already.
  • 4.
     ggplot2, dplyr,and magrittr packages must be installed and loaded, if you haven’t already. DO NOT INSTALL PACKAGESTHAT ALREADYARE INSTALLED
  • 6.
    Visualization is anytechnique for creating images, diagrams, or animations to communicate a message.
  • 7.
    ggplot2 is adata visualization package (one of many) for the statistical programming language R. Created by HadleyWickham in 2005, ggplot2 is an implementation of LelandWilkinson's Grammar of Graphics—a general scheme for data visualization which breaks up graphs into semantic components such as scales and layers.
  • 8.
     The ggplot2package must be installed.  If installed, the ggplot2 package must be loaded.  As with all R packages, do not install this package if the package already is installed— merely load the installed package.
  • 10.
     A grammarconstitutes the structure and systems for communication.  A grammar of language consists of syntax (arrangement of words for meaning) and morphology (meanings of words in language).  A grammar of graphics consist of system of syntax and meaning to communicate understanding of data.
  • 13.
     Data isa data frame containing variables to be plotted;  Geometry defines the type of graphics (histogram, box plot, line plot, density plot, dot plot....); and  Aesthetics indicate the variables to be plotted.This component also can control the color, the size, or the shape of points plotted, the height of bars drawn, etc.
  • 16.
  • 17.
  • 18.
  • 20.
    which is thesame as
  • 32.
  • 34.
  • 35.