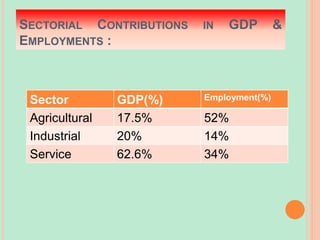
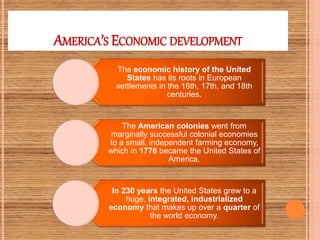
INDIAN ECONOMIC
DEVELOPMENT
By : TUSHAR DHIMAN
CLASS –IX B
ROLL NO - 10
OVERVIEW OF INDIAN ECONOMY:
 The Indian economy has transformed into a vibrant,
rapidly growing consumer market, comprising over
300 million strong middle class with increasing
purchasing power.
 An abundant and diversified natural resource base,
sound economic, industrial and market
fundamentals and highly skilled and talented
human resources, make India a destination for
business and investment opportunities with an
assured potential for attractive returns.
G.D.P DURING THE LAST THREE YEARS :
GDP Growth Year
2007 9.4%
2008 7.3%
2009 5.4%
2010 7.2%
SECTOR OF THE INDIAN ECONOMY :
 Primary Sector
 Secondary Sector
 Tertiary Sector
PRIMARY SECTOR :
 Activities undertaken by directly using natural
resources.
 Example—Agriculture, Mining, Fishing, Forestry,
Dairy etc.
 It is called primary sector because it forms the
base for all other products that we subsequently
make.
SECONDARY SECTOR :
 It covers activities in which natural products are
changed into other forms through ways of
manufacturing that we associate with industrial
activity.
 It is a next step after primary, where the product is
not produced by nature but has to be made.
 Some process of manufacturing is essential, it
could be in a factory, a workshop or at home.
TERTIARY SECTOR :
 These are the activities that help in the
development of the primary & secondary sector.
 These activities by themselves do not produce
good but they are an aid and support to the
production process.
 Example: Transportation, Goods that are
produced in the primary sector need to be
transported by trucks or trains and than sold in the
wholesale and retail shops.
SECTORIAL CONTRIBUTIONS IN GDP &
EMPLOYMENTS :
Sector GDP(%) Employment(%)
Agricultural 17.5% 52%
Industrial 20% 14%
Service 62.6% 34%
HIGHLIGHTS OF ECONOMIC SURVEY 2011-
12
 Rate of growth estimated to be 6.9%. Outlook for growth
and stability is promising with real GDP growth expected
to pick up to 7.6% in 2012-13 and 8.6% in 2013-14.
 Agriculture and Services sectors continue to perform
well. 2.5 % growth in Agro sector forecast. Services
sector grows by 9.4 %, its share in GDP goes up to
59%.
 Industrial growth pegged at 4-5 percent, expected to
improve as economic recovery resumes.
 Food inflation dropped from 20.2% in February 2010 to
1.6% in January 2012.
HIGHLIGHTS OF ECONOMIC SURVEY 2011-
12
 Savings & capital formation expected to rise.
 Exports grew @ 40.5% in the first half of this fiscal
and imports grew by 30.4%. Foreign trade
performance to remain a key driver of growth.
 Central spending on social services goes up to
18.5% this fiscal from 13.4% in 2006-07.
 Sustainable development and climate change
concerns on high priority.
AMERICA’S ECONOMIC DEVELOPMENT
The economic history of the United
States has its roots in European
settlements in the 16th, 17th, and 18th
centuries.
The American colonies went from
marginally successful colonial economies
to a small, independent farming economy,
which in 1776 became the United States of
America.
In 230 years the United States grew to a
huge, integrated, industrialized
economy that makes up over a quarter of
the world economy.
OVERALL ANALYSIS
The U.S. economy
maintains a relatively
high GDP per capita,
with the caveat that it
may be elevated by
borrowing and a low to
moderate GDP growth
rate making it attractive
to immigrants
worldwide.
JAPAN’S ECONOMY
Statistics( 20010) Japan trends
Population (millions) 126,475,664
Superficy (km²) 377,915
Median agae 44.8
GDP trillion$ 4.31 trillion
Growth 3,9
Pop active 62.97 mi.
Unemployment rate 5%
Inflation rate 0,7%
Exchanges
Exports billion$ $ 765.2
Imports billion $ $ 639.1
Finance
Investment rate 19.1% GDP
Budget -7,7% GDP
Official currency YEN
Change Euro/JPY 110, 55
JAPAN, MAIN SECTORS
Ship industry Textile Machine tools Chemicals
Electronics Automobile Food
Bangladesh Economy
 GDP: 242.2 billion
 GDP per capita: 1,600$ per capita
 Unemployment rate: 2.5%
 Import: 2o.22 billion $ ( 2009)
 Machinery, equipment, chemicals, iron and steel,
textiles, foodstuffs, petroleum products and cement.
Trade partners include China and India
 Export: 15.91 billion $ (2009)
 Garmets, frozen fish and seafood, and leather. Trade
partners include USA and Germany.
Economic developement

Economic developement

  • 1.
    INDIAN ECONOMIC DEVELOPMENT By :TUSHAR DHIMAN CLASS –IX B ROLL NO - 10
  • 2.
    OVERVIEW OF INDIANECONOMY:  The Indian economy has transformed into a vibrant, rapidly growing consumer market, comprising over 300 million strong middle class with increasing purchasing power.  An abundant and diversified natural resource base, sound economic, industrial and market fundamentals and highly skilled and talented human resources, make India a destination for business and investment opportunities with an assured potential for attractive returns.
  • 3.
    G.D.P DURING THELAST THREE YEARS : GDP Growth Year 2007 9.4% 2008 7.3% 2009 5.4% 2010 7.2%
  • 4.
    SECTOR OF THEINDIAN ECONOMY :  Primary Sector  Secondary Sector  Tertiary Sector
  • 5.
    PRIMARY SECTOR : Activities undertaken by directly using natural resources.  Example—Agriculture, Mining, Fishing, Forestry, Dairy etc.  It is called primary sector because it forms the base for all other products that we subsequently make.
  • 6.
    SECONDARY SECTOR : It covers activities in which natural products are changed into other forms through ways of manufacturing that we associate with industrial activity.  It is a next step after primary, where the product is not produced by nature but has to be made.  Some process of manufacturing is essential, it could be in a factory, a workshop or at home.
  • 7.
    TERTIARY SECTOR : These are the activities that help in the development of the primary & secondary sector.  These activities by themselves do not produce good but they are an aid and support to the production process.  Example: Transportation, Goods that are produced in the primary sector need to be transported by trucks or trains and than sold in the wholesale and retail shops.
  • 8.
    SECTORIAL CONTRIBUTIONS INGDP & EMPLOYMENTS : Sector GDP(%) Employment(%) Agricultural 17.5% 52% Industrial 20% 14% Service 62.6% 34%
  • 9.
    HIGHLIGHTS OF ECONOMICSURVEY 2011- 12  Rate of growth estimated to be 6.9%. Outlook for growth and stability is promising with real GDP growth expected to pick up to 7.6% in 2012-13 and 8.6% in 2013-14.  Agriculture and Services sectors continue to perform well. 2.5 % growth in Agro sector forecast. Services sector grows by 9.4 %, its share in GDP goes up to 59%.  Industrial growth pegged at 4-5 percent, expected to improve as economic recovery resumes.  Food inflation dropped from 20.2% in February 2010 to 1.6% in January 2012.
  • 10.
    HIGHLIGHTS OF ECONOMICSURVEY 2011- 12  Savings & capital formation expected to rise.  Exports grew @ 40.5% in the first half of this fiscal and imports grew by 30.4%. Foreign trade performance to remain a key driver of growth.  Central spending on social services goes up to 18.5% this fiscal from 13.4% in 2006-07.  Sustainable development and climate change concerns on high priority.
  • 11.
    AMERICA’S ECONOMIC DEVELOPMENT Theeconomic history of the United States has its roots in European settlements in the 16th, 17th, and 18th centuries. The American colonies went from marginally successful colonial economies to a small, independent farming economy, which in 1776 became the United States of America. In 230 years the United States grew to a huge, integrated, industrialized economy that makes up over a quarter of the world economy.
  • 12.
    OVERALL ANALYSIS The U.S.economy maintains a relatively high GDP per capita, with the caveat that it may be elevated by borrowing and a low to moderate GDP growth rate making it attractive to immigrants worldwide.
  • 14.
    JAPAN’S ECONOMY Statistics( 20010)Japan trends Population (millions) 126,475,664 Superficy (km²) 377,915 Median agae 44.8 GDP trillion$ 4.31 trillion Growth 3,9 Pop active 62.97 mi. Unemployment rate 5% Inflation rate 0,7% Exchanges Exports billion$ $ 765.2 Imports billion $ $ 639.1 Finance Investment rate 19.1% GDP Budget -7,7% GDP Official currency YEN Change Euro/JPY 110, 55
  • 15.
    JAPAN, MAIN SECTORS Shipindustry Textile Machine tools Chemicals Electronics Automobile Food
  • 16.
    Bangladesh Economy  GDP:242.2 billion  GDP per capita: 1,600$ per capita  Unemployment rate: 2.5%  Import: 2o.22 billion $ ( 2009)  Machinery, equipment, chemicals, iron and steel, textiles, foodstuffs, petroleum products and cement. Trade partners include China and India  Export: 15.91 billion $ (2009)  Garmets, frozen fish and seafood, and leather. Trade partners include USA and Germany.