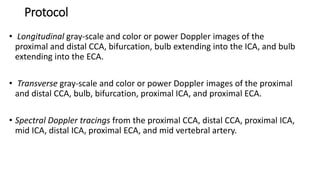
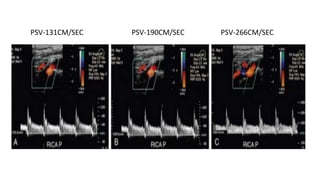
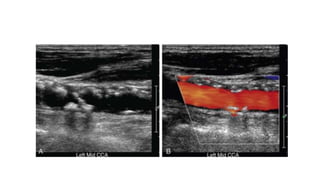
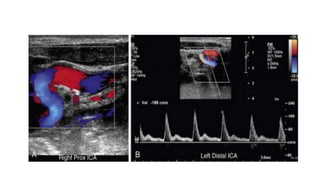
This document provides guidance on using ultrasound to assess the carotid arteries for atherosclerotic disease. It outlines the technical requirements, examination techniques, diagnostic criteria, and normal and abnormal findings. Doppler ultrasound is an accurate noninvasive method to diagnose high-grade carotid stenosis by measuring peak systolic velocities. Key findings include plaques that are hypoechoic or irregular in shape posing higher risk. Proper technique and accounting for vascular anomalies are important to avoid overestimating stenosis.

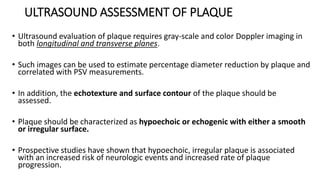
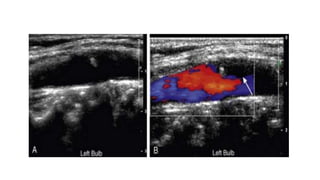
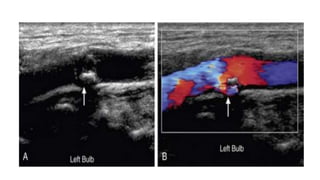
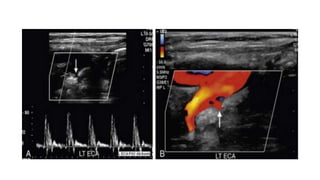
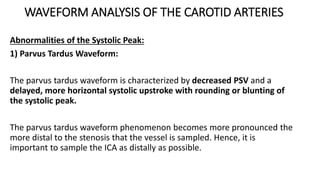
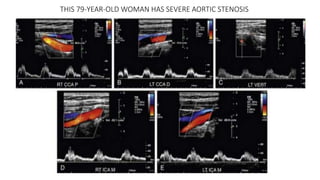


![carotid stenosis [Autosaved].pptx for master students](https://cdn.slidesharecdn.com/ss_thumbnails/carotidstenosisautosaved-241229032708-f20dd02c-thumbnail.jpg?width=640&height=640&fit=bounds)


