This PowerPoint presentation is designed to introduce beginners to the fundamentals of ECG (electrocardiogram) reading and interpretation. It covers the basic principles of ECG, including electrode placement, waveforms (P wave, QRS complex, T wave), intervals, and normal vs. abnormal findings. The presentation breaks down common arrhythmias, heart blocks, and ischemic changes in an easy-to-understand format with visual examples. Practical tips for systematic ECG analysis and real-world case scenarios help reinforce learning. By the end of the presentation, attendees will have a foundational understanding of ECG interpretation and its clinical significance.

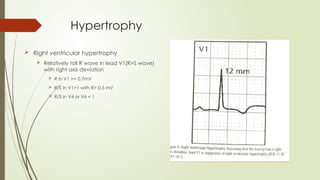
![Hypertrophy
Left Ventricular hypertrophy
Sokolow-Lyon Criteria:
[S in V1] + [R in V5 or V6] > 35mm (>35 small
boxes)
R in aVL > 11 mm
Cornell Criteria
S in V3 + R in aVL:
Female >= 20mm
Male>=28m](https://image.slidesharecdn.com/ecg-250316082806-5e593991/85/ECG-reading-and-interpretation-for-beginners-pptx-17-320.jpg)