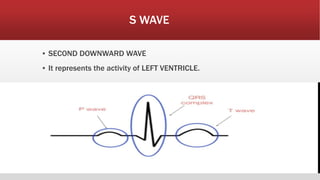
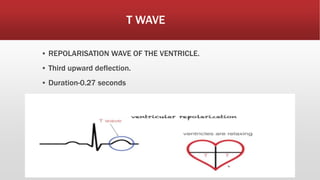
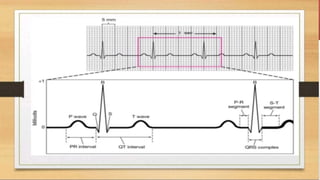
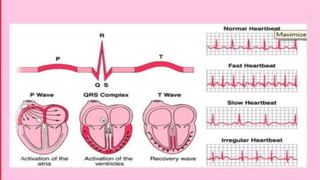
The document provides an overview of electrocardiograms (ECG), including their function in monitoring heart activity through electrical impulses. It outlines the historical development of ECG technology, significant scientists involved, and the interpretation of heart rhythm through defined waves (PQRST). Additionally, it discusses various clinical uses of ECG, including diagnosing heart conditions and the effects of medication.


![ECG [electrocardiogram].pptx](https://cdn.slidesharecdn.com/ss_thumbnails/ecgelectrocardiogram-220416062706-thumbnail.jpg?width=640&height=640&fit=bounds)