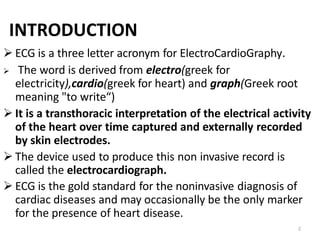
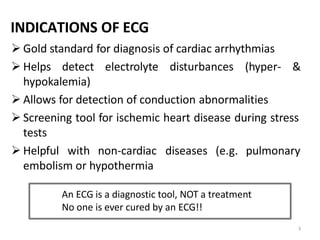
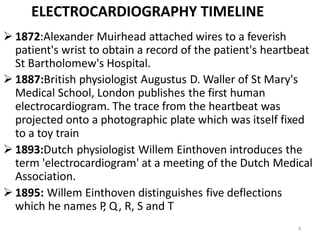
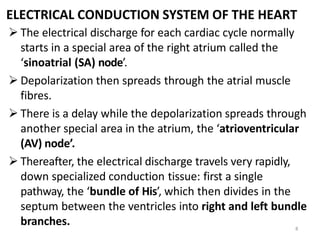
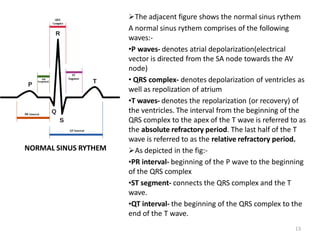
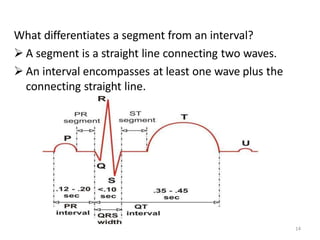
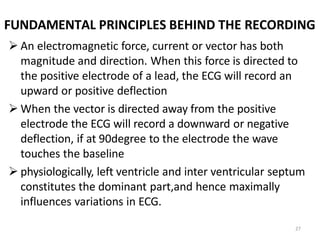
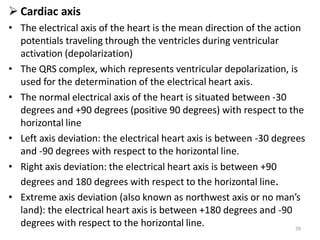
An ECG is a record of the heart's electrical activity over time captured by skin electrodes. It is a diagnostic tool used to detect cardiac arrhythmias, conduction abnormalities, electrolyte disturbances, and screen for heart disease. An ECG involves placing electrodes on the skin of the limbs and chest to record the heart's electrical activity through 12 leads that detect the heart from different angles based on Einthoven's triangle. The ECG trace shows the P, QRS, and T waves that correspond to atrial depolarization, ventricular depolarization and repolarization.

![15
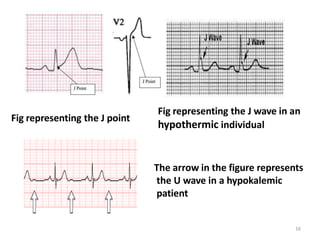
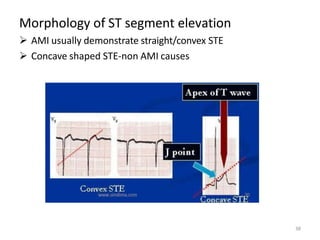
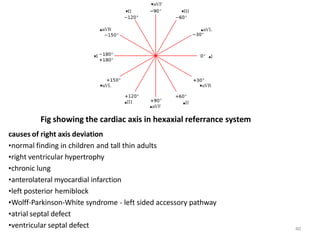
J point- J-point is the point at which the QRS complex meets the ST wave.
Its an isoelectric point and its importance lies in the fact that ST segment
elevation is measured with respect to it
J WAVE AND U WAVE:These are two abnormal waves that may be seen
sumtime in the ecg recordings.
o J wave
• also known as camel-hump sign, late delta wave, hathook junction, hypothermic
wave, prominent J wave ,[1] K wave, H wave or current of injury
• positive deflections occurring at the junction between the QRS complex and ST
segment(j point)
• observed in people suffering from hypothermia with a temperature of less than
32
o U wave
• typically small, and, by definition, follows the T wave
• Prominent U waves are most often seen in hypokalemia, but may be present
in hypercalcemia, thyrotoxicosis](https://image.slidesharecdn.com/ecgpresentation-130425002449-phpapp011-230411022313-3c6209f9/85/ECG-Electrocardiogram-presentation-15-320.jpg)
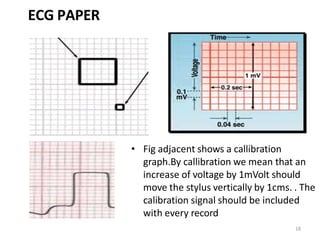


![ECG [electrocardiogram].pptx](https://cdn.slidesharecdn.com/ss_thumbnails/ecgelectrocardiogram-220416062706-thumbnail.jpg?width=640&height=640&fit=bounds)


