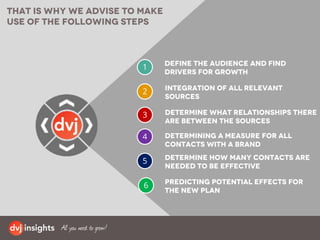
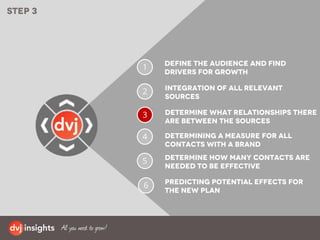
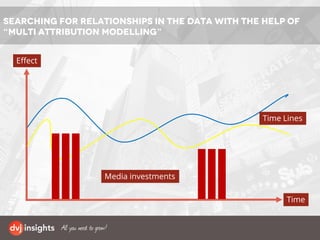
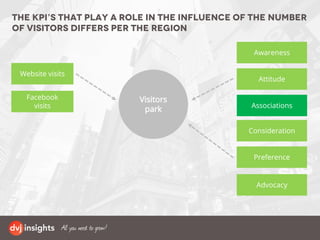
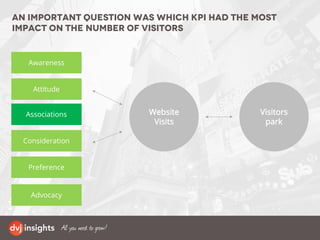
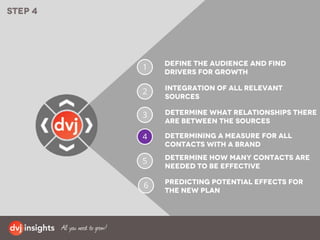
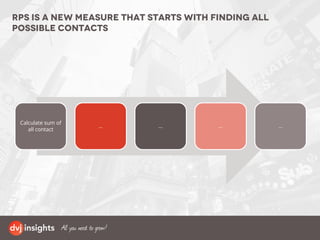
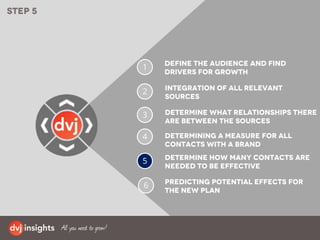
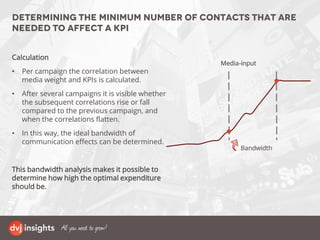
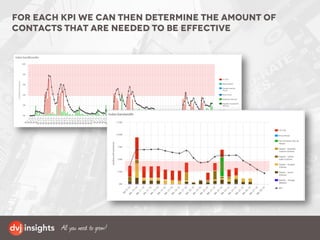
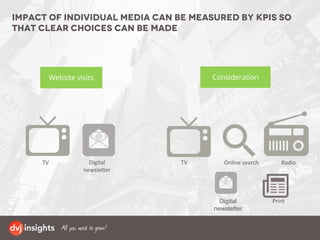
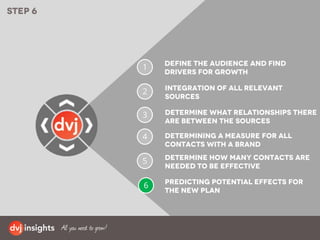
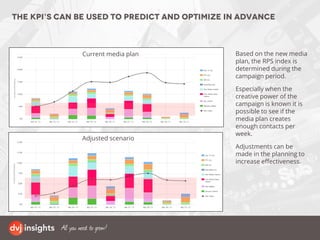
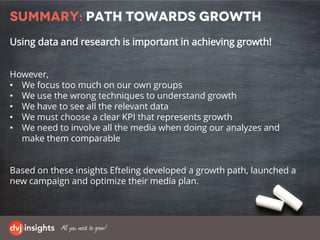
2016, DVJ Insights
Unleashing
Data excellence
Growth is the most
important KPI when
determining marketing
success for many Cmo’s
How do you find the
drivers for growth?
What is the best way to
influence these drivers?
Which data should be used
to find this path?
Many of the available
tools and methods are
only able to solve small
pieces of the puzzle
We have developed a
stepwise approach that is
based upon experience and
scientific knowledge
1
2
Determining a measure for all
contacts with a brand
Integration of all relevant
sources
That is why we advise to make
use of the following steps
3 Determine what relationships there
are between the sources
Determine how many contacts are
needed to be effective
4
Predicting potential effects for
the new plan
5
6
Define the audience and find
drivers for growth
1
2
Determining a measure for all
contacts with a brand
Integration of all relevant
sources
Step 1
3 Determine what relationships there
are between the sources
Determine how many contacts are
needed to be effective
4
Predicting potential effects for
the new plan
5
6
Define the audience and find
drivers for growth
Buying behavior:
Marketers mainly focus on the
smaller buying segments
Byron Sharp (2012): ā€œAcquisition is vital for growth and maintenance.
Reaching all buyers is vital, especially light, occasional buyers of the brand.ā€
Storytelling:
to unlock drivers and motives of all audiences
• Integration of storytelling and Free associations
• We were able to classify people and understand motives
De Pelsmacker & Van Kenhove (2012): ā€œTo understand the real motives and drivers we have
to look beyond a standardized set of statement and measuresā€
• The first step in the research
process was to ask people to
share a story on the process
they follow last time they …
• We did this by asking people to
describe their last day out.
Sharing a story
My story is about:
Story Marking
To understand the drivers in the
journey we worked with a series
of story markers to see which
aspects were important for
buying a product.
• We asked people to mark
the words that represented
the crucial stage in their
journey.
• This will be compared with
the results of the next
exercise
Marking of important stages
Understanding drivers for growth by using
storytelling
11
Based upon the drivers of the category and actual
behavior we are able to determine the path to growth
CORE
Brand most used
SWITCH
High usage of category
and low usage of
brand
REJECT
Never consumes
Brand
POTENTIAL
High usage of
category and no
usage of brand
MODERATE
Low usage of category
and low usage of
brand
The core group are
those that state that
they often eat Brand
brand. These are loyal
to brand.
The switch group are
those that eat category
(very) often. This group
also eats Brand brand
but states that they
mostly use other
brands.
The potential group are
those that eat category
(very) often but no
brand.
The moderate group are
those that use little
category and have a low
usage of Brand brand
(once a (half) year)
The reject group are
those that never use
brand
1
2
Determining a measure for all
contacts with a brand
Integration of all relevant
sources
Step 2
3 Determine what relationships there
are between the sources
Determine how many contacts are
needed to be effective
4
Predicting potential effects for
the new plan
5
6
Define the audience and find
drivers for growth
Integration of all relevant data
Mind:
Tracking research that gives an overview of
the brand funnel of the Efteling. Here fore,
we used 2.5 years of historic data
Media:
- TV (GRP’s per week)
- Radio (GRP’s per week)
- Out of home (contacts per period)
- Print (contacts per week)
- Digital newsletter (contacts per week)
- Online search (contacts per period)
- Facebook (contacts per week)
- Cinema (contacts per period)
Behavior:
- Bookings
- Visitors
- Online Sales
Intent:
- Facebook Engagement
- Website visits:
• Total
• Homepage
• Park
• Accommodation
• Tickets
1
2
Determining a measure for all
contacts with a brand
Integration of all relevant
sources
Step 3
3 Determine what relationships there
are between the sources
Determine how many contacts are
needed to be effective
4
Predicting potential effects for
the new plan
5
6
Define the audience and find
drivers for growth
Searching for relationships in the data with the help of
ā€œmulti attribution modellingā€
Effect
Time
Time Lines
Media investments
The KPI’s that play a role in the influence of the number
of visitors differs per the region
Visitors
park
Website visits
Awareness
Facebook
visits
Attitude
Consideration
Preference
Advocacy
Associations
An important question was which KPI had the most
impact on the number of visitors
Website
Visits
Visitors
park
Awareness
Attitude
Consideration
Preference
Advocacy
Associations
Before the shifting of data
After the shifting of data
Week 1 Week 2 Week 3 Week 4 Week 5 Week 6 Week 7 Week 8 Week 9 Week 10 Week 11 Week 12 Week 13 Week 14 Week 15
Mind Intent Gedrag
Week 1 Week 2 Week 3 Week 4 Week 5 Week 6 Week 7 Week 8 Week 9 Week 10 Week 11 Week 12 Week 13 Week 14 Week 15
Mind Intent Gedrag
ā€œLagged Effectsā€ are also taken into account in the time
Creating a very clear view of the customer journey
Visit
Online booking
Orientation on the visit
itself
Facebook orientation
Orientation on
a day trip
Reminisce
Reminisce
1
2
Determining a measure for all
contacts with a brand
Integration of all relevant
sources
Step 4
3 Determine what relationships there
are between the sources
Determine how many contacts are
needed to be effective
4
Predicting potential effects for
the new plan
5
6
Define the audience and find
drivers for growth
Rps is a new measure that starts with finding all
possible contacts
Calculate sum of
all contact
… … … …
Reality FACT: Different media contribute in different ways to campaign effects. An exposure
to a 60ā€œ ad in the cinema for example, has more impact than a single exposure to display a
banner.
Each medium is unique:
Not every medium has the same impact- or memorization potential
Each medium is unique:
Not every medium has the same impact- or memorization potential
De Pelsmacker, Geuens, & Van den Bergh (2011): ā€œMorgensztern’s beta analysis takes
into account that memorization of a message depends on the medium used.ā€
Media work differently.
En even within a medium type there are many
different formats
The power of a creation can differ enormously.
Keep that in mind
Arguments vs. emotions?
Celebrity endorser?
Humor?
One-sided or two-sided arguments?
Angst appeals?
Social norm?
Likeability?
Irritation?
Expert?
Credibility?
Comparison with competition?
Heuristics?
Mystery ad?
Music?
Case study: two leading brands within the same online retail
category spend equally as much, but the effects on aided ad
recall vary widely
Brand A Brand B
0%
10%
20%
30%
40%
50%
60%
70%
W41 W42 W43 W44 W45 W46
Brand A
Brand B
Reality FACT: If people are confronted with advertisements this week, then chances are that
they still remember some of it the following week .
Do people have memories:
people do not loose their memory on Monday at 00:01
Effect
Time
Time Lines
Media investments
People have memories:
Each brand and category has its own unique decay effect
Tellis, 2009: ā€œThere are more than 260 estimates of advertising elasticity carried out in numerous
studies using a variety of models and data across many countries, product categories, brands, and time
periods.ā€
Consumers have memories: they remember (parts
of) previous campaigns.
Rps is a new measure that provides an overview of all
the contacts with a brand
Calculate sum of
all contact
Weight each
media type to
the Beta factor
Take format
within mediums
into account
Take the force of
the medium into
account
Take the decay
effect of the
week before
along
based on these principles, the media plan is translated
into a Rps line
And the relationship and the strength of the
relationship with all KPIs is determined
RPS
Website visits Publicity/acquainta
nceship
Facebook
visits Attitude
Consideration
Preference
Advocacy
1
2
Determining a measure for all
contacts with a brand
Integration of all relevant
sources
Step 5
3 Determine what relationships there
are between the sources
Determine how many contacts are
needed to be effective
4
Predicting potential effects for
the new plan
5
6
Define the audience and find
drivers for growth
Media-input
Determining the minimum number of contacts that are
needed to affect a KPI
Calculation
• Per campaign the correlation between
media weight and KPIs is calculated.
• After several campaigns it is visible whether
the subsequent correlations rise or fall
compared to the previous campaign, and
when the correlations flatten.
• In this way, the ideal bandwidth of
communication effects can be determined.
This bandwidth analysis makes it possible to
determine how high the optimal expenditure
should be.
Bandwidth
For each KPI we can then determine the amount of
contacts that are needed to be effective
Impact of individual media can be measured by KPIs so
that clear choices can be made
TV TVDigital
newsletter
Digital
newsletter
Print
Online search Radio
Website visits Consideration
1
2
Determining a measure for all
contacts with a brand
Integration of all relevant
sources
Step 6
3 Determine what relationships there
are between the sources
Determine how many contacts are
needed to be effective
4
Predicting potential effects for
the new plan
5
6
Define the audience and find
drivers for growth
Based on the new media
plan, the RPS index is
determined during the
campaign period.
Especially when the
creative power of the
campaign is known it is
possible to see if the
media plan creates
enough contacts per
week.
Adjustments can be
made in the planning to
increase effectiveness.
The KPI’s can be used to predict and optimize in advance
Adjusted scenario
Current media plan
Summary: Path towards growth
Using data and research is important in achieving growth!
However,
• We focus too much on our own groups
• We use the wrong techniques to understand growth
• We have to see all the relevant data
• We must choose a clear KPI that represents growth
• We need to involve all the media when doing our analyzes and
make them comparable
Based on these insights Efteling developed a growth path, launched a
new campaign and optimize their media plan.
38

Dvj insights

  • 1.
  • 2.
    Growth is themost important KPI when determining marketing success for many Cmo’s
  • 3.
    How do youfind the drivers for growth? What is the best way to influence these drivers? Which data should be used to find this path?
  • 4.
    Many of theavailable tools and methods are only able to solve small pieces of the puzzle
  • 5.
    We have developeda stepwise approach that is based upon experience and scientific knowledge
  • 6.
    1 2 Determining a measurefor all contacts with a brand Integration of all relevant sources That is why we advise to make use of the following steps 3 Determine what relationships there are between the sources Determine how many contacts are needed to be effective 4 Predicting potential effects for the new plan 5 6 Define the audience and find drivers for growth
  • 7.
    1 2 Determining a measurefor all contacts with a brand Integration of all relevant sources Step 1 3 Determine what relationships there are between the sources Determine how many contacts are needed to be effective 4 Predicting potential effects for the new plan 5 6 Define the audience and find drivers for growth
  • 8.
    Buying behavior: Marketers mainlyfocus on the smaller buying segments Byron Sharp (2012): ā€œAcquisition is vital for growth and maintenance. Reaching all buyers is vital, especially light, occasional buyers of the brand.ā€
  • 9.
    Storytelling: to unlock driversand motives of all audiences • Integration of storytelling and Free associations • We were able to classify people and understand motives De Pelsmacker & Van Kenhove (2012): ā€œTo understand the real motives and drivers we have to look beyond a standardized set of statement and measuresā€
  • 10.
    • The firststep in the research process was to ask people to share a story on the process they follow last time they … • We did this by asking people to describe their last day out. Sharing a story My story is about: Story Marking To understand the drivers in the journey we worked with a series of story markers to see which aspects were important for buying a product. • We asked people to mark the words that represented the crucial stage in their journey. • This will be compared with the results of the next exercise Marking of important stages Understanding drivers for growth by using storytelling
  • 11.
    11 Based upon thedrivers of the category and actual behavior we are able to determine the path to growth CORE Brand most used SWITCH High usage of category and low usage of brand REJECT Never consumes Brand POTENTIAL High usage of category and no usage of brand MODERATE Low usage of category and low usage of brand The core group are those that state that they often eat Brand brand. These are loyal to brand. The switch group are those that eat category (very) often. This group also eats Brand brand but states that they mostly use other brands. The potential group are those that eat category (very) often but no brand. The moderate group are those that use little category and have a low usage of Brand brand (once a (half) year) The reject group are those that never use brand
  • 12.
    1 2 Determining a measurefor all contacts with a brand Integration of all relevant sources Step 2 3 Determine what relationships there are between the sources Determine how many contacts are needed to be effective 4 Predicting potential effects for the new plan 5 6 Define the audience and find drivers for growth
  • 13.
    Integration of allrelevant data Mind: Tracking research that gives an overview of the brand funnel of the Efteling. Here fore, we used 2.5 years of historic data Media: - TV (GRP’s per week) - Radio (GRP’s per week) - Out of home (contacts per period) - Print (contacts per week) - Digital newsletter (contacts per week) - Online search (contacts per period) - Facebook (contacts per week) - Cinema (contacts per period) Behavior: - Bookings - Visitors - Online Sales Intent: - Facebook Engagement - Website visits: • Total • Homepage • Park • Accommodation • Tickets
  • 14.
    1 2 Determining a measurefor all contacts with a brand Integration of all relevant sources Step 3 3 Determine what relationships there are between the sources Determine how many contacts are needed to be effective 4 Predicting potential effects for the new plan 5 6 Define the audience and find drivers for growth
  • 15.
    Searching for relationshipsin the data with the help of ā€œmulti attribution modellingā€ Effect Time Time Lines Media investments
  • 16.
    The KPI’s thatplay a role in the influence of the number of visitors differs per the region Visitors park Website visits Awareness Facebook visits Attitude Consideration Preference Advocacy Associations
  • 17.
    An important questionwas which KPI had the most impact on the number of visitors Website Visits Visitors park Awareness Attitude Consideration Preference Advocacy Associations
  • 18.
    Before the shiftingof data After the shifting of data Week 1 Week 2 Week 3 Week 4 Week 5 Week 6 Week 7 Week 8 Week 9 Week 10 Week 11 Week 12 Week 13 Week 14 Week 15 Mind Intent Gedrag Week 1 Week 2 Week 3 Week 4 Week 5 Week 6 Week 7 Week 8 Week 9 Week 10 Week 11 Week 12 Week 13 Week 14 Week 15 Mind Intent Gedrag ā€œLagged Effectsā€ are also taken into account in the time
  • 19.
    Creating a veryclear view of the customer journey Visit Online booking Orientation on the visit itself Facebook orientation Orientation on a day trip Reminisce Reminisce
  • 20.
    1 2 Determining a measurefor all contacts with a brand Integration of all relevant sources Step 4 3 Determine what relationships there are between the sources Determine how many contacts are needed to be effective 4 Predicting potential effects for the new plan 5 6 Define the audience and find drivers for growth
  • 21.
    Rps is anew measure that starts with finding all possible contacts Calculate sum of all contact … … … …
  • 22.
    Reality FACT: Differentmedia contribute in different ways to campaign effects. An exposure to a 60ā€œ ad in the cinema for example, has more impact than a single exposure to display a banner. Each medium is unique: Not every medium has the same impact- or memorization potential
  • 23.
    Each medium isunique: Not every medium has the same impact- or memorization potential De Pelsmacker, Geuens, & Van den Bergh (2011): ā€œMorgensztern’s beta analysis takes into account that memorization of a message depends on the medium used.ā€ Media work differently. En even within a medium type there are many different formats
  • 24.
    The power ofa creation can differ enormously. Keep that in mind Arguments vs. emotions? Celebrity endorser? Humor? One-sided or two-sided arguments? Angst appeals? Social norm? Likeability? Irritation? Expert? Credibility? Comparison with competition? Heuristics? Mystery ad? Music?
  • 25.
    Case study: twoleading brands within the same online retail category spend equally as much, but the effects on aided ad recall vary widely Brand A Brand B 0% 10% 20% 30% 40% 50% 60% 70% W41 W42 W43 W44 W45 W46 Brand A Brand B
  • 26.
    Reality FACT: Ifpeople are confronted with advertisements this week, then chances are that they still remember some of it the following week . Do people have memories: people do not loose their memory on Monday at 00:01 Effect Time Time Lines Media investments
  • 27.
    People have memories: Eachbrand and category has its own unique decay effect Tellis, 2009: ā€œThere are more than 260 estimates of advertising elasticity carried out in numerous studies using a variety of models and data across many countries, product categories, brands, and time periods.ā€ Consumers have memories: they remember (parts of) previous campaigns.
  • 28.
    Rps is anew measure that provides an overview of all the contacts with a brand Calculate sum of all contact Weight each media type to the Beta factor Take format within mediums into account Take the force of the medium into account Take the decay effect of the week before along
  • 29.
    based on theseprinciples, the media plan is translated into a Rps line
  • 30.
    And the relationshipand the strength of the relationship with all KPIs is determined RPS Website visits Publicity/acquainta nceship Facebook visits Attitude Consideration Preference Advocacy
  • 31.
    1 2 Determining a measurefor all contacts with a brand Integration of all relevant sources Step 5 3 Determine what relationships there are between the sources Determine how many contacts are needed to be effective 4 Predicting potential effects for the new plan 5 6 Define the audience and find drivers for growth
  • 32.
    Media-input Determining the minimumnumber of contacts that are needed to affect a KPI Calculation • Per campaign the correlation between media weight and KPIs is calculated. • After several campaigns it is visible whether the subsequent correlations rise or fall compared to the previous campaign, and when the correlations flatten. • In this way, the ideal bandwidth of communication effects can be determined. This bandwidth analysis makes it possible to determine how high the optimal expenditure should be. Bandwidth
  • 33.
    For each KPIwe can then determine the amount of contacts that are needed to be effective
  • 34.
    Impact of individualmedia can be measured by KPIs so that clear choices can be made TV TVDigital newsletter Digital newsletter Print Online search Radio Website visits Consideration
  • 35.
    1 2 Determining a measurefor all contacts with a brand Integration of all relevant sources Step 6 3 Determine what relationships there are between the sources Determine how many contacts are needed to be effective 4 Predicting potential effects for the new plan 5 6 Define the audience and find drivers for growth
  • 36.
    Based on thenew media plan, the RPS index is determined during the campaign period. Especially when the creative power of the campaign is known it is possible to see if the media plan creates enough contacts per week. Adjustments can be made in the planning to increase effectiveness. The KPI’s can be used to predict and optimize in advance Adjusted scenario Current media plan
  • 37.
    Summary: Path towardsgrowth Using data and research is important in achieving growth! However, • We focus too much on our own groups • We use the wrong techniques to understand growth • We have to see all the relevant data • We must choose a clear KPI that represents growth • We need to involve all the media when doing our analyzes and make them comparable Based on these insights Efteling developed a growth path, launched a new campaign and optimize their media plan.
  • 38.