Download to read offline

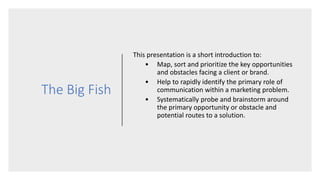
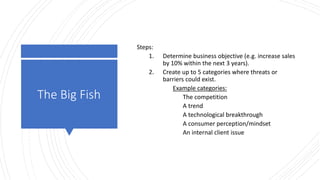
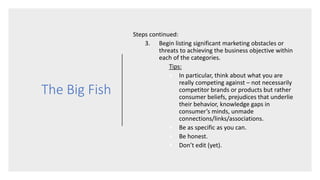
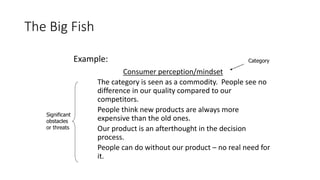
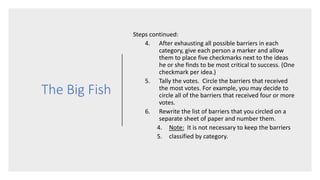
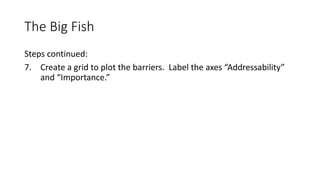
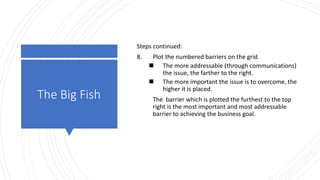
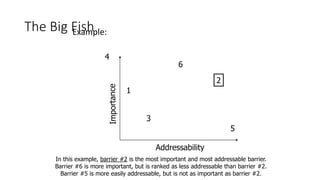
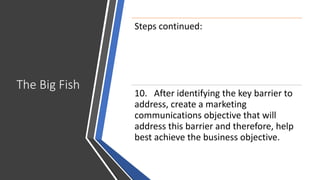


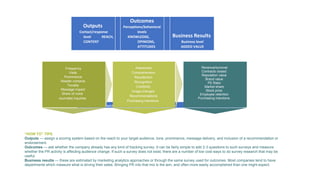

This document outlines a methodology called "The Big Fish" for systematically identifying key marketing opportunities and obstacles. It involves the following steps: 1. Determine a business objective such as increasing sales by 10% within 3 years. 2. Create categories for potential threats or barriers, such as competition, trends, technology, consumer perceptions. 3. List significant obstacles within each category, being specific. 4. Vote on the most critical obstacles. Circle the top barriers. 5. Plot the barriers on a grid by addressability versus importance to identify the most important and addressable barrier. 6. Develop a marketing communications objective to address this key barrier and help achieve the business goal.


