


Experimentation Strategy & Value
Hazjier Pourkhalkhali
Global Director, Strategy & Value
2
Optimizely is constantly researching the characteristics and impact
of high performing experimentation programs
● Analysis of over 1,000 companies and more than
100,000 experiments
● Identification of best practices for experimentation
Global Optimization Benchmark
● Analysis of 14,000 experiments to identify the
best practices that make companies more
successful in experimentation
Experiment Design and Performance
● Analysis of 1,000’s of experiments to understand
how risk-taking and innovation evolve over time
● Analysis of how risk-taking affects
experimentation performance
Experimentation and Innovation Experimentation and Firm Performance
● Analysis of how the scale of experimentation
affects the financial performance of organizations
3
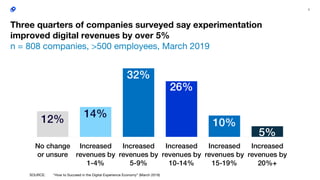
12% 14%
32%
26%
10%
5%
No change
or unsure
Increased
revenues by
1-4%
Increased
revenues by
5-9%
Increased
revenues by
10-14%
Increased
revenues by
15-19%
Increased
revenues by
20%+
SOURCE: “How to Succeed in the Digital Experience Economy” (March 2019)
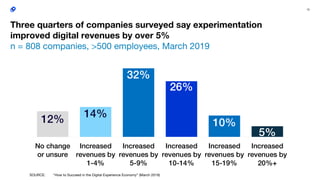
Three quarters of companies surveyed say experimentation
improved digital revenues by over 5%
n = 808 companies, >500 employees, March 2019
4
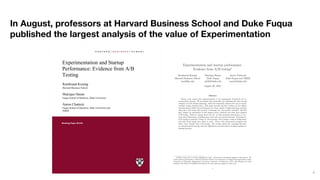
In August, professors at Harvard Business School and Duke Fuqua
published the largest analysis of the value of Experimentation
Experimentation and startup performance:
Evidence from A/B testingú
Rembrand Koning
Harvard Business School
rem@hbs.edu
Sharique Hasan
Duke Fuqua
sh424@duke.edu
Aaron Chatterji
Duke Fuqua and NBER
ronnie@duke.edu
August 20, 2019
Abstract
Recent work argues that experimentation is the appropriate framework for en-
trepreneurial strategy. We investigate this proposition by exploiting the time-varying
adoption of A/B testing technology, which has drastically reduced the cost of experi-
mentally testing business ideas. This paper provides the first evidence of how digital
experimentation a ects the performance of a large sample of high-technology startups
using data that tracks their growth, technology use, and product launches. We find
that, despite its prominence in the business press, relatively few firms have adopted
A/B testing. However, among those that do, we find increased performance on sev-
eral critical dimensions, including page views and new product features. Furthermore,
A/B testing is positively related to tail outcomes, with younger ventures failing faster
and older firms being more likely to scale. Firms with experienced managers also
derive more benefits from A/B testing. Our results inform the emerging literature
on entrepreneurial strategy and how digitization and data-driven decision-making are
shaping strategy.
ú
Authors names are in reverse alphabetical order. All authors contributed equally to this project. We
thank seminar participants at Harvard Business School, the Conference on Digital Experimentation, Duke,
University of Maryland, Binghamton University, University of Minnesota, NYU, and Wharton for their
feedback. We thank the Kau man Foundation for their generous support of this work.
1
Experimentation and Startup
Performance: Evidence from A/B
Testing
Rembrand Koning
Sharique Hasan
Aaron Chatterji
Working Paper 20-018
Copyright © 2019 by Rembrand Koning, Sharique Hasan, and Aaron Chatterji
Experimentation and Startup
Performance: Evidence from
A/B Testing
Rembrand Koning
Harvard Business School
Sharique Hasan
Fuqua School of Business, Duke University
Aaron Chatterji
Fuqua School of Business, Duke University and
NBER
Experimentation and Startup
Performance: Evidence from A/B
Testing
Rembrand Koning
Sharique Hasan
Aaron Chatterji
Working Paper 20-018
5
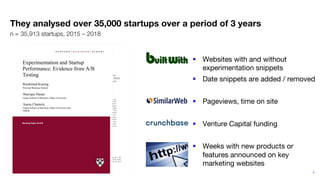
They analysed over 35,000 startups over a period of 3 years
Experimentation and startup performance:
Evidence from A/B testingú
Rembrand Koning
Harvard Business School
rem@hbs.edu
Sharique Hasan
Duke Fuqua
sh424@duke.edu
Aaron Chatterji
Duke Fuqua and NBER
ronnie@duke.edu
August 20, 2019
Abstract
Recent work argues that experimentation is the appropriate framework for en-
trepreneurial strategy. We investigate this proposition by exploiting the time-varying
adoption of A/B testing technology, which has drastically reduced the cost of experi-
mentally testing business ideas. This paper provides the first evidence of how digital
experimentation a ects the performance of a large sample of high-technology startups
using data that tracks their growth, technology use, and product launches. We find
that, despite its prominence in the business press, relatively few firms have adopted
A/B testing. However, among those that do, we find increased performance on sev-
eral critical dimensions, including page views and new product features. Furthermore,
A/B testing is positively related to tail outcomes, with younger ventures failing faster
and older firms being more likely to scale. Firms with experienced managers also
derive more benefits from A/B testing. Our results inform the emerging literature
on entrepreneurial strategy and how digitization and data-driven decision-making are
shaping strategy.
ú
Authors names are in reverse alphabetical order. All authors contributed equally to this project. We
thank seminar participants at Harvard Business School, the Conference on Digital Experimentation, Duke,
University of Maryland, Binghamton University, University of Minnesota, NYU, and Wharton for their
feedback. We thank the Kau man Foundation for their generous support of this work.
1
Experimentation and Startup
Performance: Evidence from A/B
Testing
Rembrand Koning
Sharique Hasan
Aaron Chatterji
Working Paper 20-018
Copyright © 2019 by Rembrand Koning, Sharique Hasan, and Aaron Chatterji
Experimentation and Startup
Performance: Evidence from
A/B Testing
Rembrand Koning
Harvard Business School
Sharique Hasan
Fuqua School of Business, Duke University
Aaron Chatterji
Fuqua School of Business, Duke University and
NBER
Experimentation and Startup
Performance: Evidence from A/B
Testing
Rembrand Koning
Sharique Hasan
Aaron Chatterji
Working Paper 20-018
§ Websites with and without
experimentation snippets
§ Date snippets are added / removed
§ Pageviews, time on site
§ Venture Capital funding
§ Weeks with new products or
features announced on key
marketing websites
n = 35,913 startups, 2015 – 2018
6
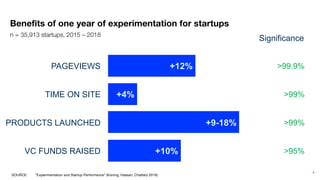
Benefits of one year of experimentation for startups
n = 35,913 startups, 2015 – 2018
PAGEVIEWS
TIME ON SITE
PRODUCTS LAUNCHED
VC FUNDS RAISED
+12%
+4%
+9-18%
+10%
>99.9%
>99%
>99%
>95%
Significance
SOURCE: “Experimentation and Startup Performance” (Koning, Hassan, Chatterji 2019)
7
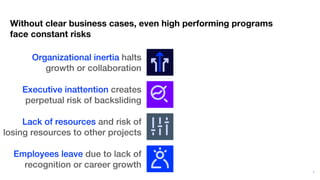
Without clear business cases, even high performing programs
face constant risks
Organizational inertia halts
growth or collaboration
Executive inattention creates
perpetual risk of backsliding
Lack of resources and risk of
losing resources to other projects
Employees leave due to lack of
recognition or career growth
8
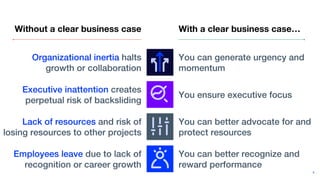
Without a clear business case
Organizational inertia halts
growth or collaboration
You can generate urgency and
momentum
Executive inattention creates
perpetual risk of backsliding
You ensure executive focus
Lack of resources and risk of
losing resources to other projects
You can better advocate for and
protect resources
Employees leave due to lack of
recognition or career growth
You can better recognize and
reward performance
With a clear business case…
9
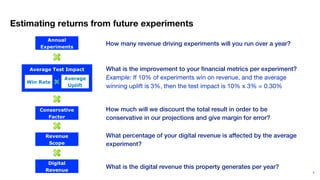
Estimating returns from future experiments
Average Test Impact
Annual
Experiments
Win Rate
Conservative
Factor
Average
Uplift
How many revenue driving experiments will you run over a year?
What is the improvement to your financial metrics per experiment?
Example: If 10% of experiments win on revenue, and the average
winning uplift is 3%, then the test impact is 10% x 3% = 0.30%
How much will we discount the total result in order to be
conservative in our projections and give margin for error?
What percentage of your digital revenue is affected by the average
experiment?
Revenue
Scope
Digital
Revenue
What is the digital revenue this property generates per year?
10
12% 14%
32%
26%
10%
5%
No change
or unsure
Increased
revenues by
1-4%
Increased
revenues by
5-9%
Increased
revenues by
10-14%
Increased
revenues by
15-19%
Increased
revenues by
20%+
SOURCE: “How to Succeed in the Digital Experience Economy” (March 2019)
Three quarters of companies surveyed say experimentation
improved digital revenues by over 5%
n = 808 companies, >500 employees, March 2019
11
2.1X
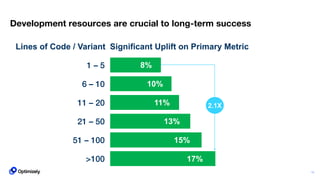
Development resources are crucial to long-term success
8%
10%
11%
13%
15%
1 – 5
6 – 10
11 – 20
21 – 50
51 – 100
17%>100
Lines of Code / Variant Significant Uplift on Primary Metric
12
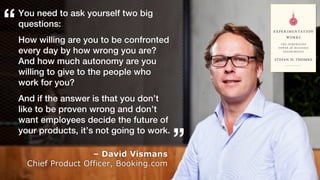
You need to ask yourself two big
questions:
How willing are you to be confronted
every day by how wrong you are?
And how much autonomy are you
willing to give to the people who
work for you?
And if the answer is that you don’t
like to be proven wrong and don’t
want employees decide the future of
your products, it’s not going to work.
– David Vismans
Chief Product Officer, Booking.com
“
”
13
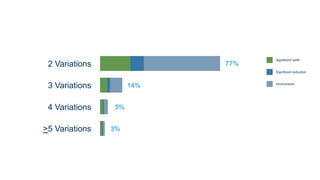
14
2 Variations
3 Variations
4 Variations
>5 Variations
77%
14%
5%
3%
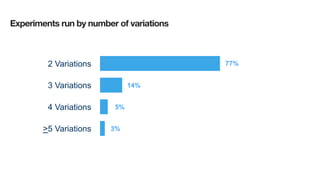
Experiments run by number of variations
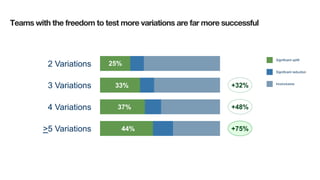
2 Variations
3 Variations
4 Variations
>5 Variations
Significant uplift
Significant reduction
Inconclusive
77%
14%
5%
3%
+75%
+48%
+32%
25%
33%
37%
44% +75%
2 Variations
3 Variations
4 Variations
>5 Variations
Significant uplift
Significant reduction
Inconclusive
Teams with the freedom to test more variations are far more successful
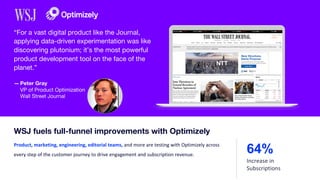
— Peter Gray
VP of Product Optimization
Wall Street Journal
“For a vast digital product like the Journal,
applying data-driven experimentation was like
discovering plutonium; it’s the most powerful
product development tool on the face of the
planet.”
Product, marketing, engineering, editorial teams, and more are testing with Optimizely across
every step of the customer journey to drive engagement and subscription revenue.
WSJ fuels full-funnel improvements with Optimizely
64%
Increase in
Subscriptions
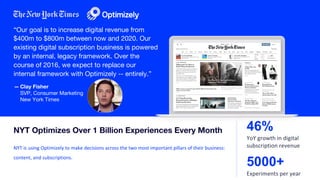
“Our goal is to increase digital revenue from
$400m to $800m between now and 2020. Our
existing digital subscription business is powered
by an internal, legacy framework. Over the
course of 2016, we expect to replace our
internal framework with Optimizely -- entirely.”
NYT is using Optimizely to make decisions across the two most important pillars of their business:
content, and subscriptions.
NYT Optimizes Over 1 Billion Experiences Every Month
5000+
Experiments per year
46%
YoY growth in digital
subscription revenue
— Clay Fisher
SVP, Consumer Marketing
New York Times
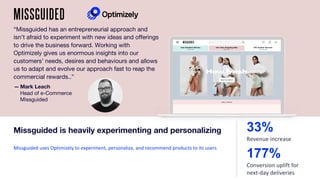
“Missguided has an entrepreneurial approach and
isn’t afraid to experiment with new ideas and offerings
to drive the business forward. Working with
Optimizely gives us enormous insights into our
customers’ needs, desires and behaviours and allows
us to adapt and evolve our approach fast to reap the
commercial rewards..”
Missguided uses Optimizely to experiment, personalize, and recommend products to its users
Missguided is heavily experimenting and personalizing
177%
Conversion uplift for
next-day deliveries
33%
Revenue increase
— Mark Leach
Head of e-Commerce
Missguided
— Erin O’Leary
VP of Marketing
Rocksbox
“Without the ability to experiment, we may have
not tested some of the ideas that resulted in our
most significant wins because we either did not
think it would make a difference, or we thought it
was too risky.”
Product, engineering and marketing teams are testing with Optimizely across every step of the
customer journey to improve revenue and retention.
Rocksbox optimizes their customer journey
99%
Conversion rate uplift
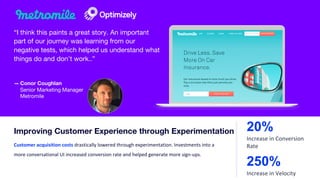
— Conor Coughlan
Senior Marketing Manager
Metromile
“I think this paints a great story. An important
part of our journey was learning from our
negative tests, which helped us understand what
things do and don't work..”
Customer acquisition costs drastically lowered through experimentation. Investments into a
more conversational UI increased conversion rate and helped generate more sign-ups.
Improving Customer Experience through Experimentation 20%
Increase in Conversion
Rate
250%
Increase in Velocity
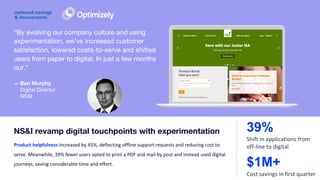
— Ben Murphy
Digital Director
NS&I
“By evolving our company culture and using
experimentation, we’ve increased customer
satisfaction, lowered costs-to-serve and shifted
users from paper to digital. In just a few months
our.”
Product helpfulness increased by 45%, deflecting offline support requests and reducing cost to
serve. Meanwhile, 39% fewer users opted to print a PDF and mail by post and instead used digital
journeys, saving considerable time and effort.
NS&I revamp digital touchpoints with experimentation 39%
Shift in applications from
off-line to digital
$1M+
Cost savings in first quarter