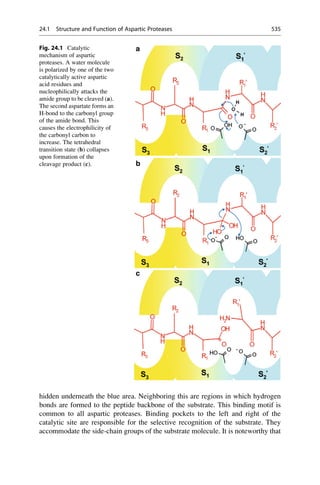
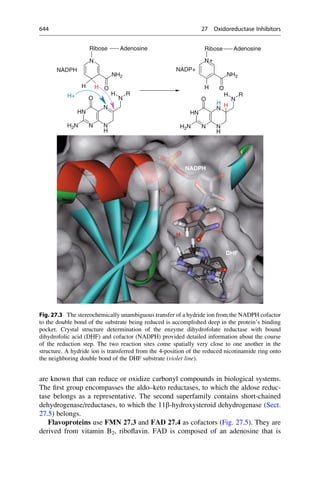
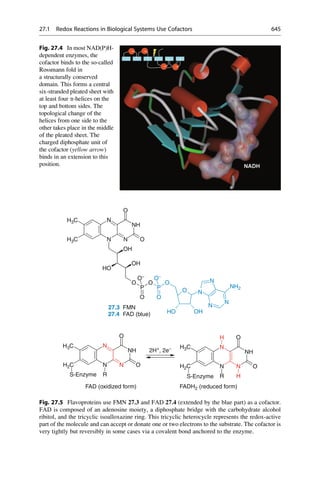
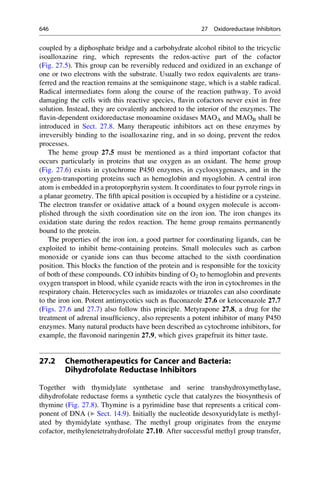
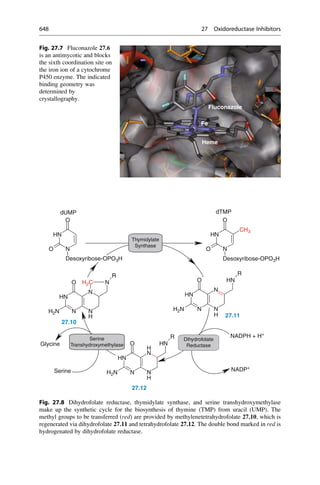
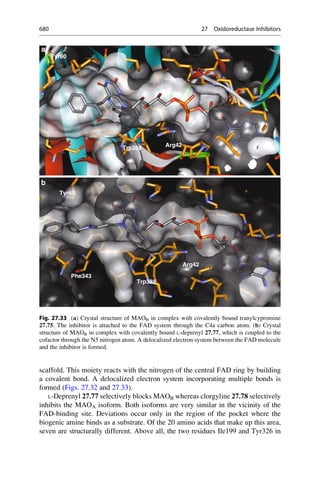
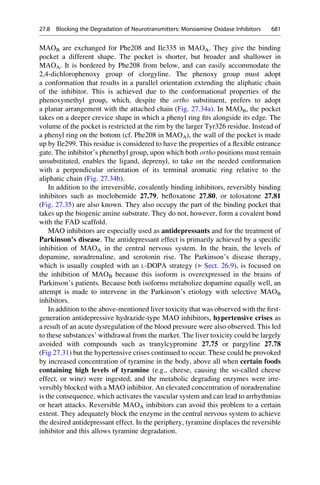
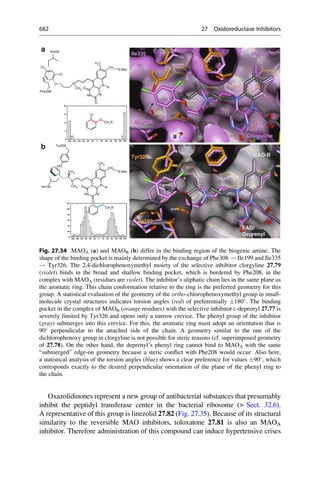
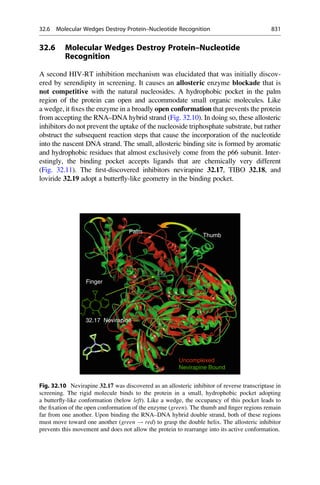
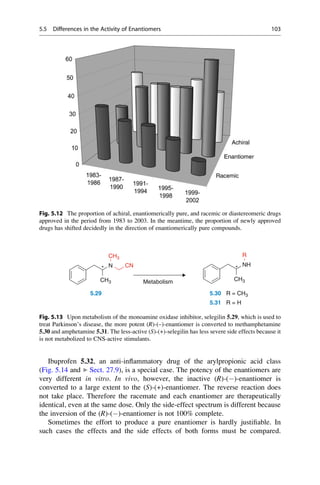
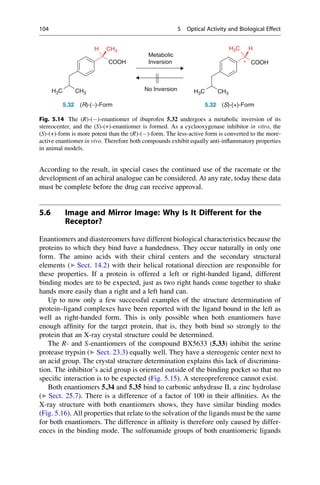
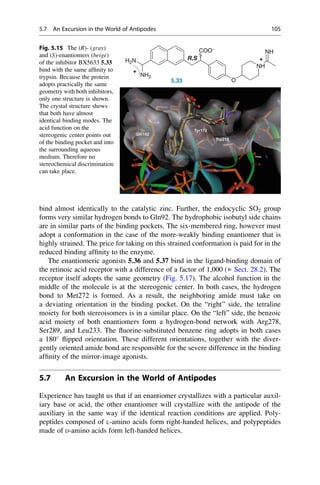
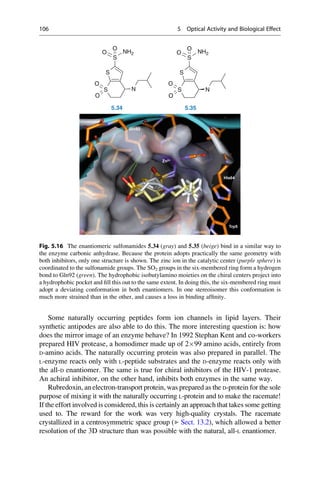
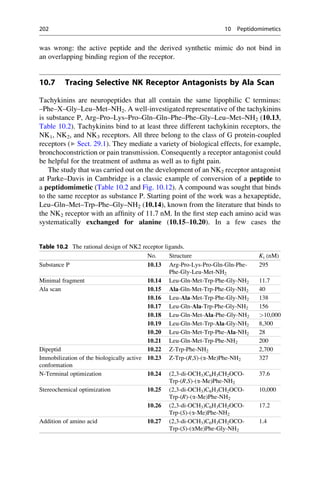
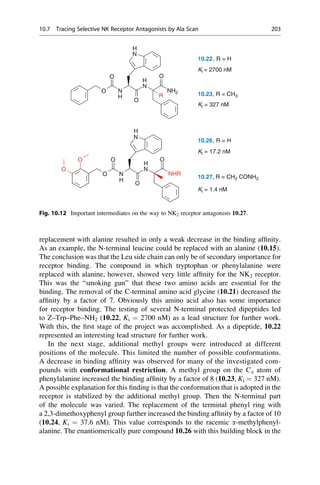
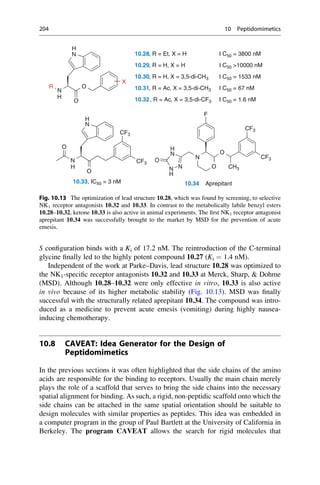
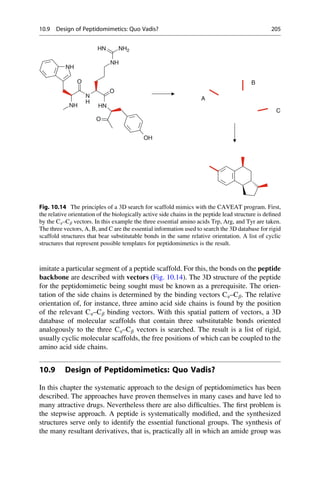
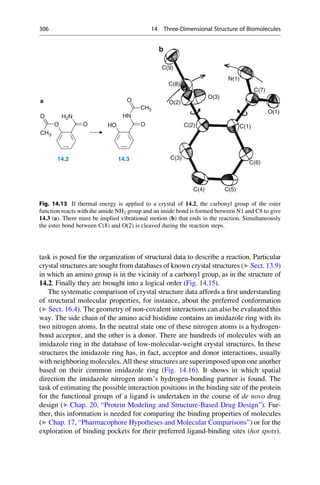
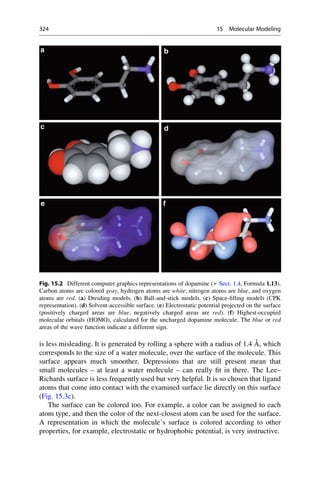
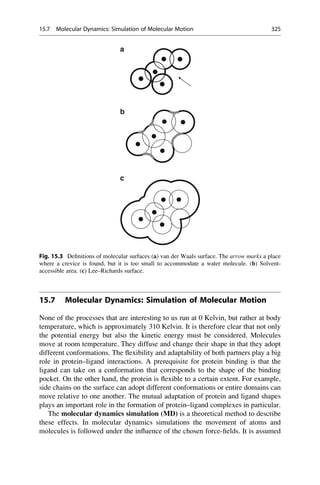
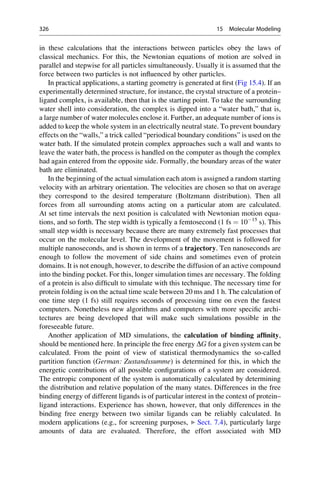
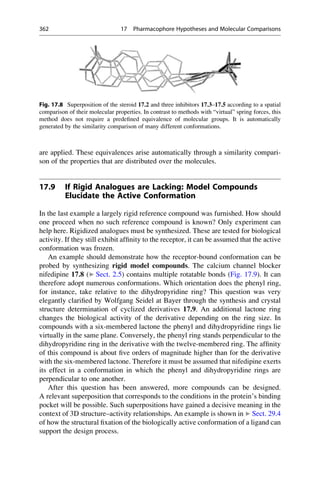
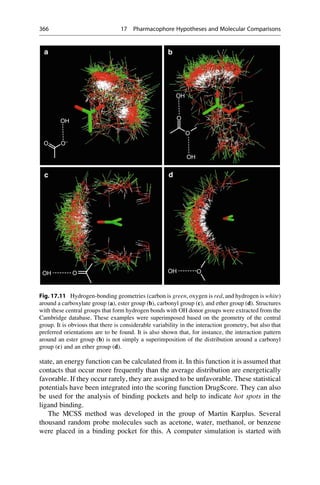
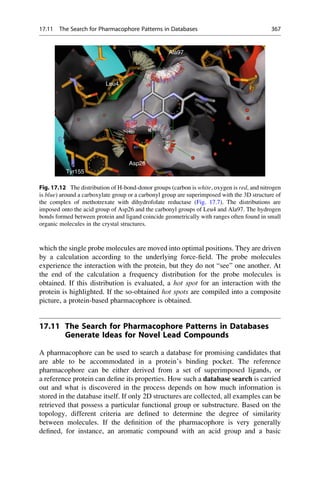
This document provides an introduction to the field of drug design. It discusses how drug design encompasses both creative discovery and targeted approaches based on existing knowledge. While drug design is not fully predictable, modern technologies like combinatorial chemistry, gene technology, and computational methods have provided powerful new tools. Understanding molecular mechanisms of drug action and determining protein structures have also advanced drug design. However, solely computational approaches also carry risks, so a balanced integration of methods remains important for successful drug development.
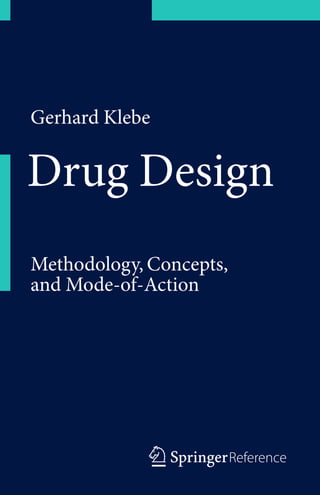


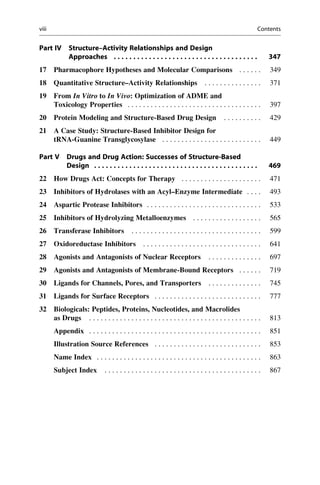
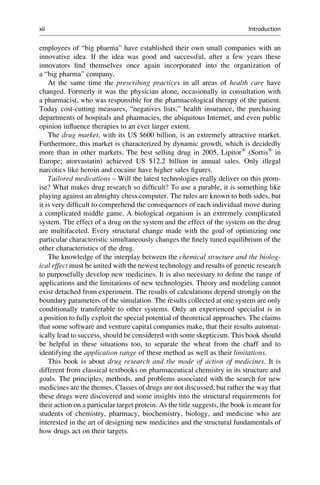


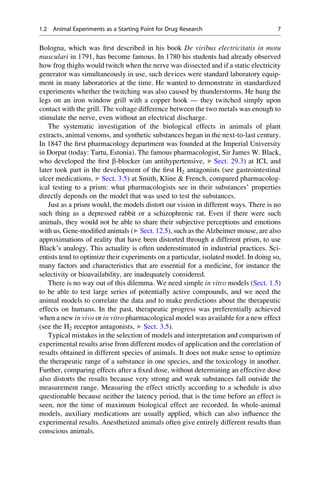
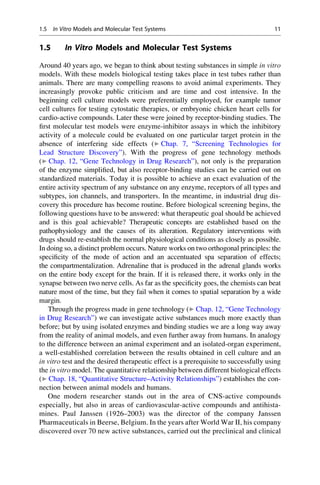
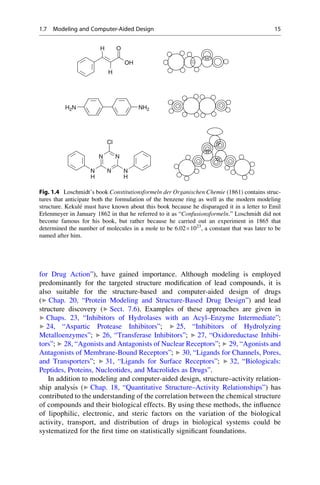
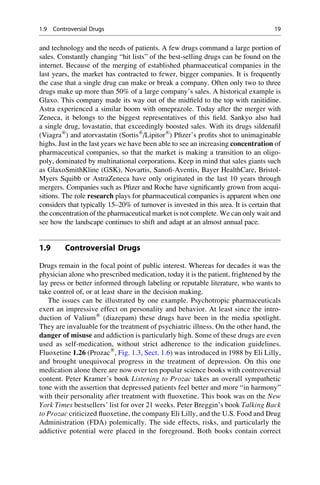
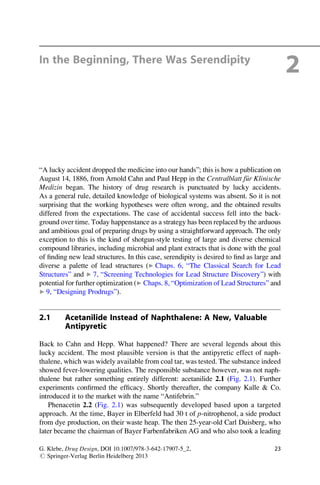
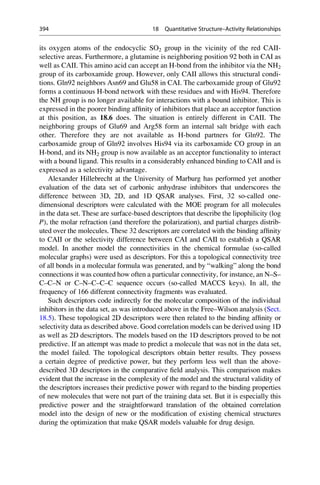
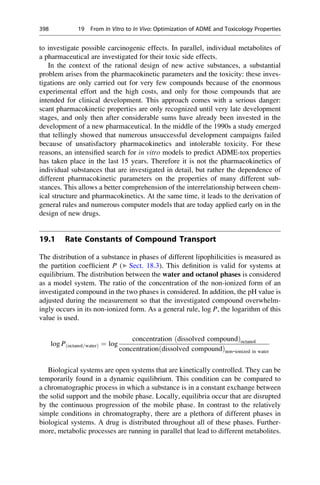
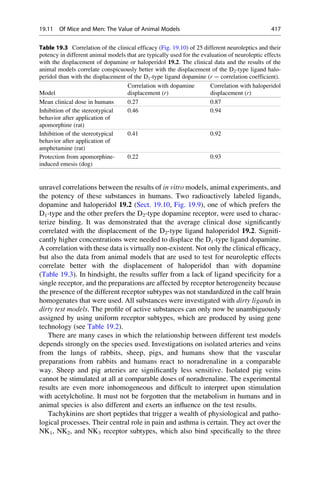
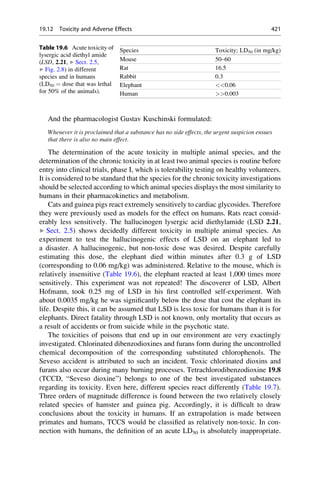
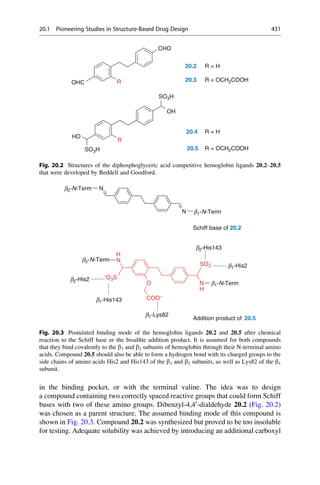
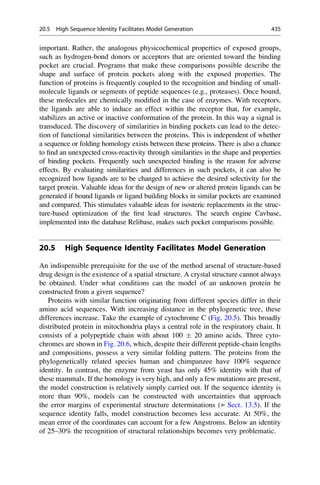
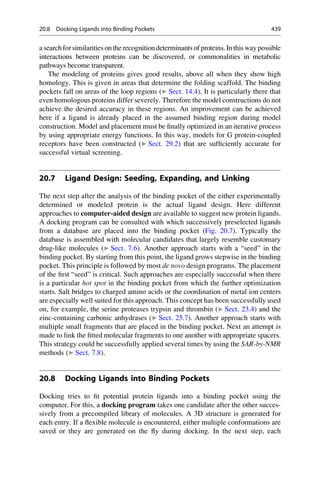
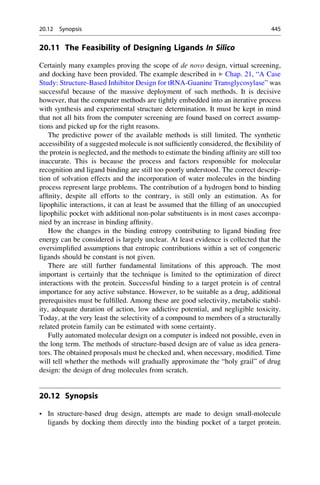
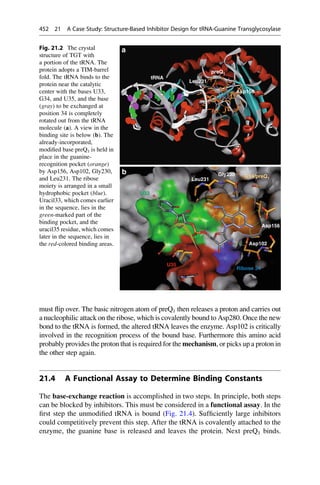
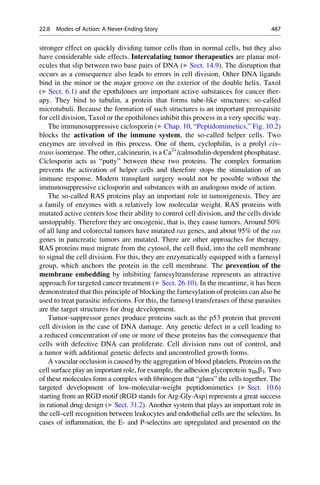
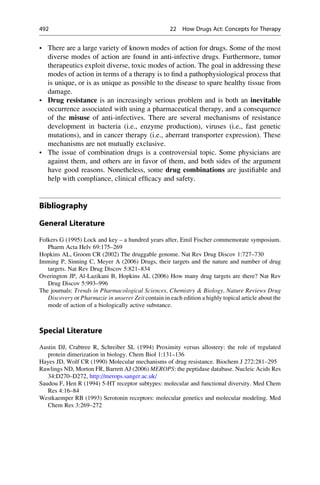
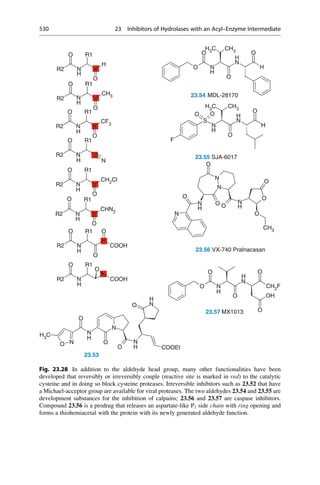
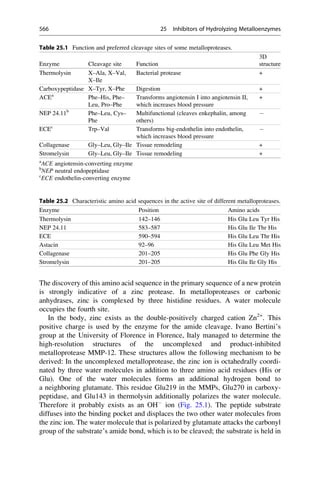
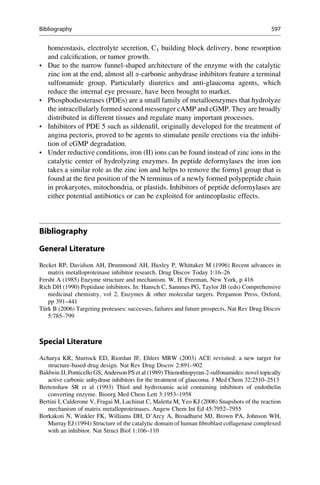
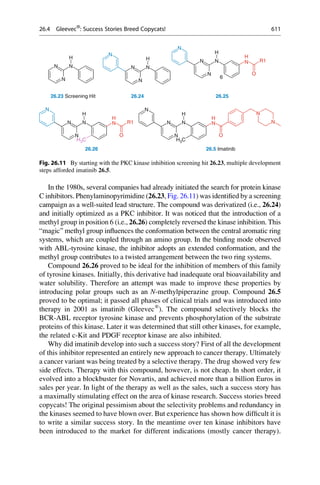
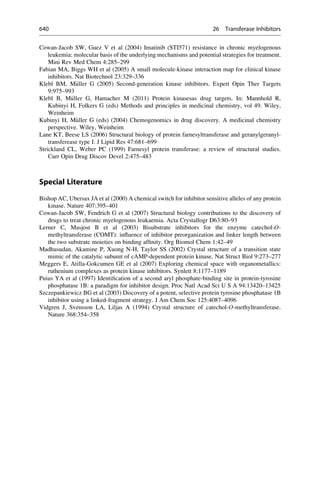
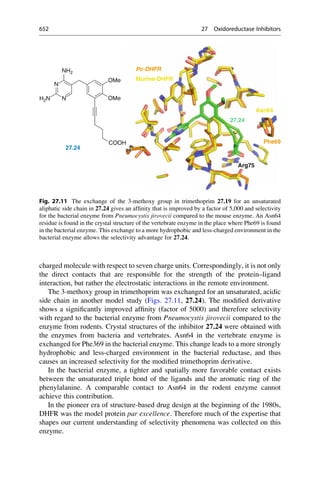
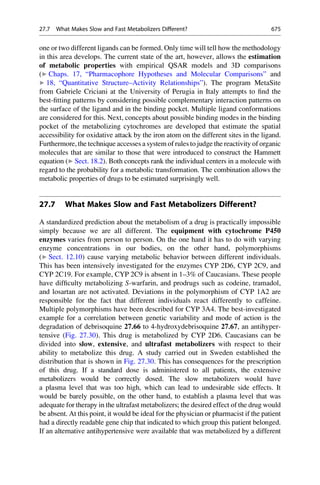
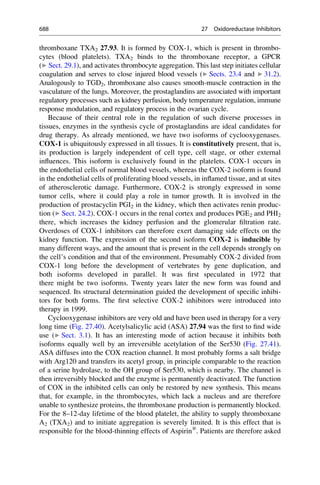
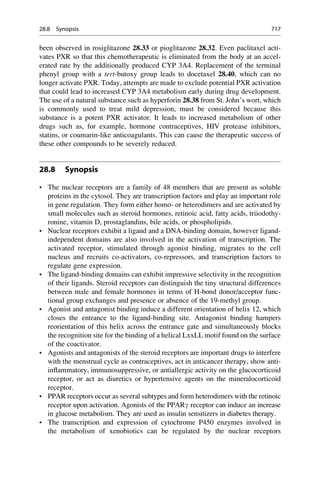
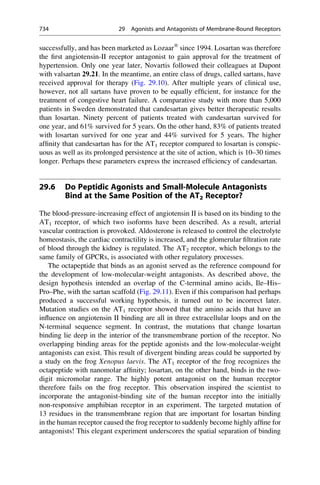
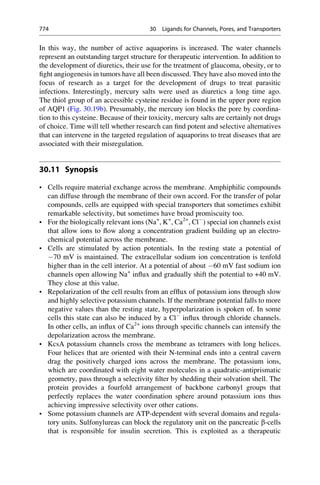
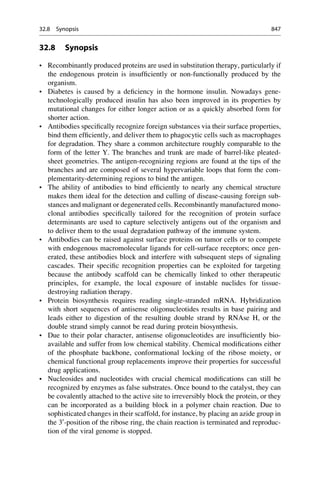
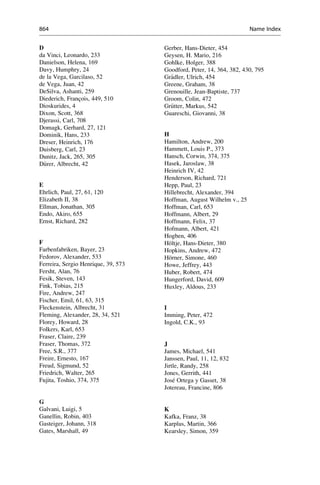
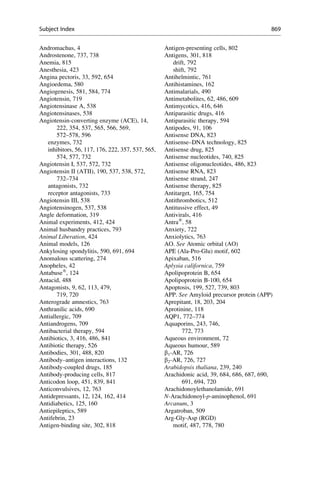
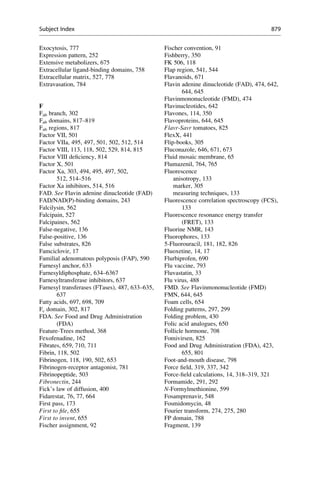
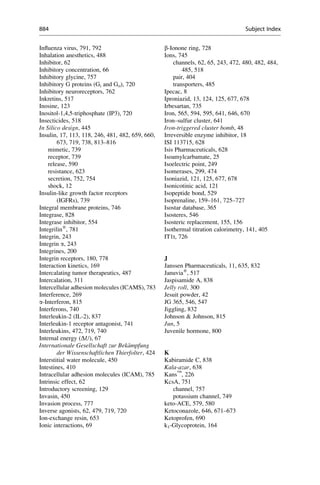
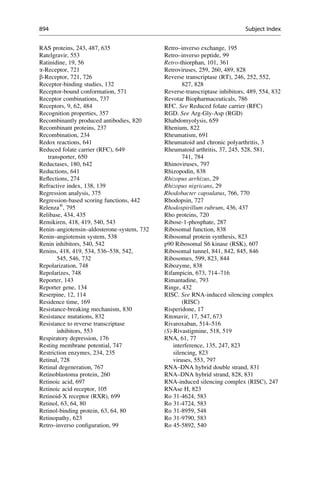
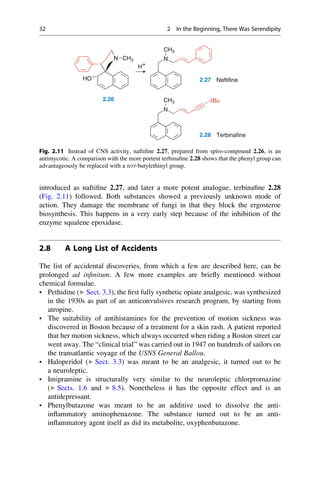
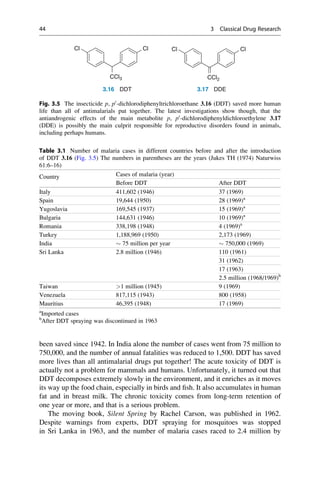
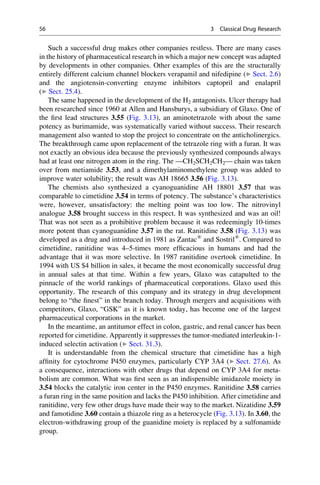
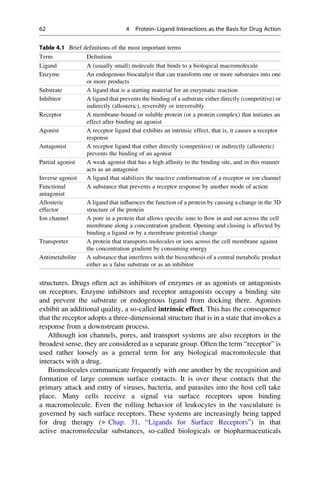
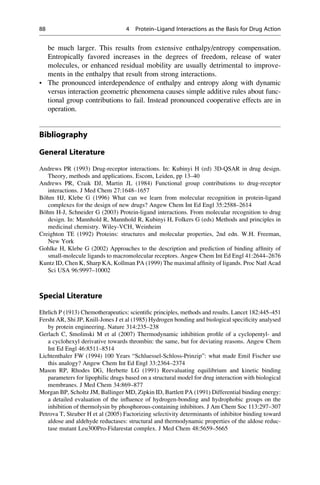
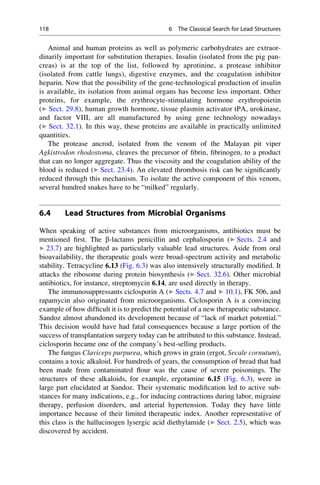
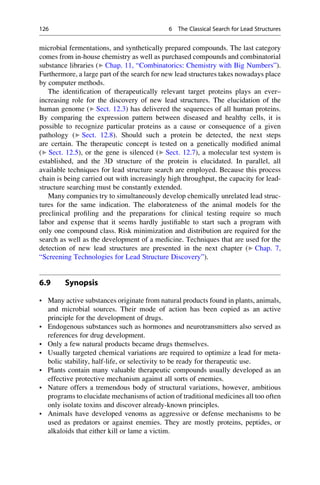
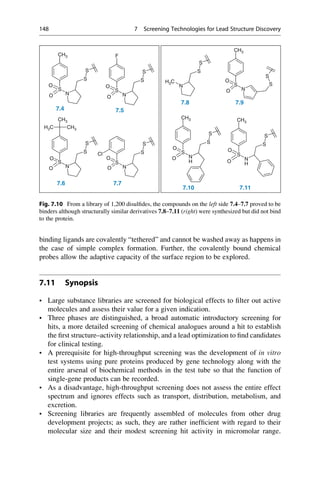
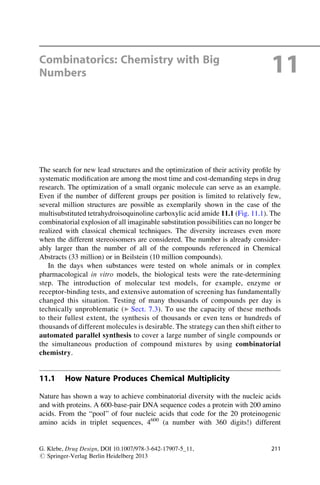
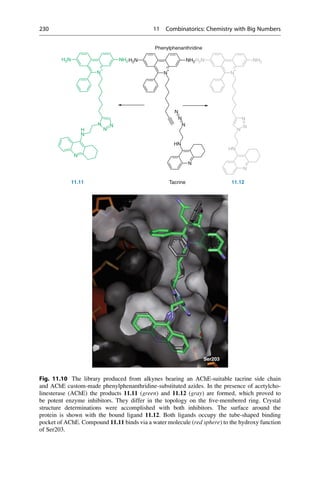
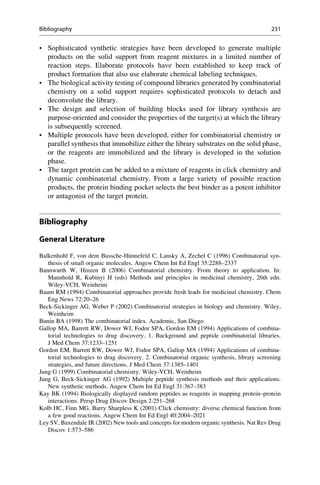
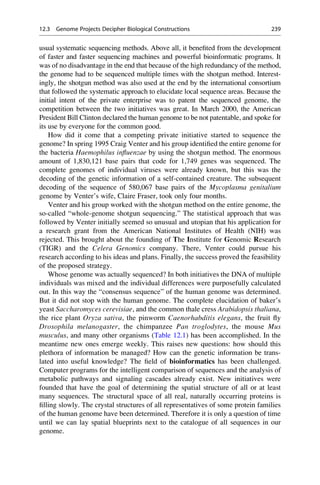
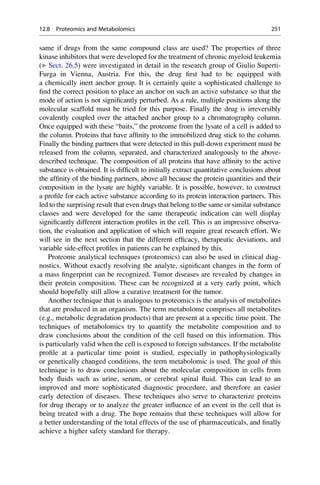
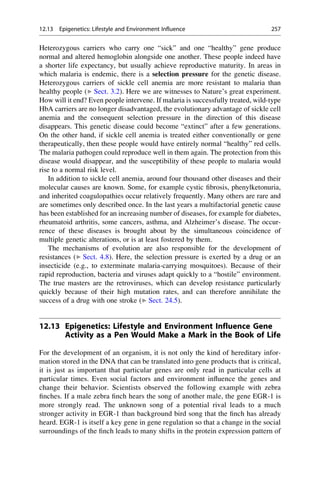
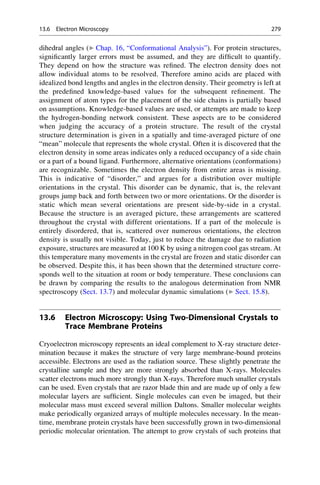
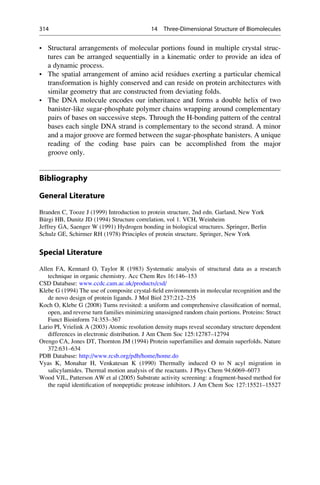
![with only the molecular formula, it was anticipated that the oxidation of an allyl-
substituted toluidine would deliver the desired product. Now that the structural
formula is known, we understand that this could not possibly have worked! Upon
oxidation of aniline that was contaminated with o- and p-toluidine Perkins isolated
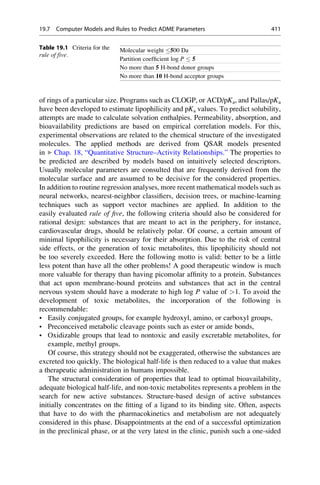
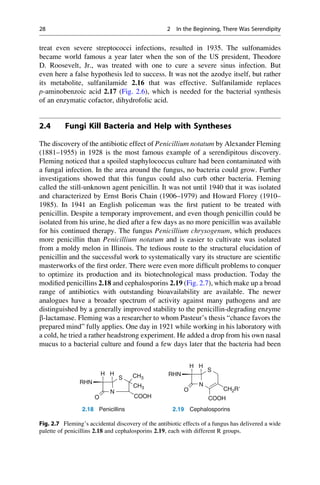
a dark precipitate. It contained a dye, mauveine 2.12 (Fig. 2.4) that colored silks
a brilliant mauve. Other dyes were prepared in rapid succession. The development
and later proliferation of the dye industry in England and Germany in the second
half of the nineteenth century can be traced back to this accidental discovery.
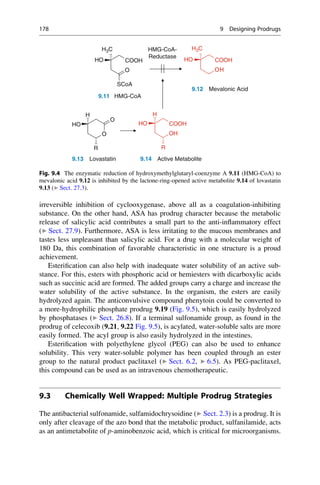
Toward the end of the next-to-last century increasing competition and a difficult
economic situation in the dye market inspired the reactionary expansion into
industrial pharmaceutical research. In 1896 a pharmaceutical research laboratory
was founded in the 33-year-old Bayer Farbenfabrik. At that time innumerable
synthetic dyes were known, therefore it is not surprising that these substances
were tested for pharmacological effects.
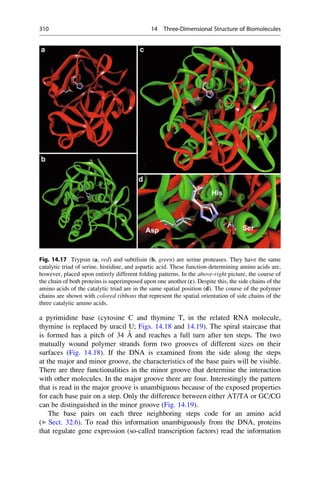
Of all people, wine adulterators played an important role in the discovery of the
first synthetic laxative. To stop people from selling Trester wine (so-called
Nachwein) as a natural wine (Naturwein), in 1900 the dye phenolphthalein was
added as an easily detectable indicator. The Hungarian pharmacologist Zoltán
von Vámossy (1868–1953) investigated the effects of this compound. Back then,
the conventions of the pharmacologists were still rather primitive. The intravenous
application of 0.01–0.03 g to rabbits caused death “with loud shrieking, convul-
sions, and paralysis”. Vámossy then decided to feed 1–2 g to a rabbit and 5 g to a
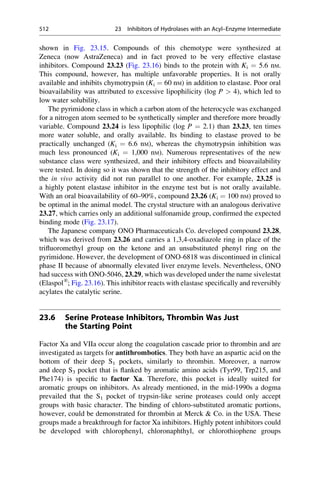
4 kg lap dog. Because these oral doses were all well tolerated, Vámossy took 1.5 g
of phenolphthalein himself, and a friend took 1.0 g. The effects were explosive:
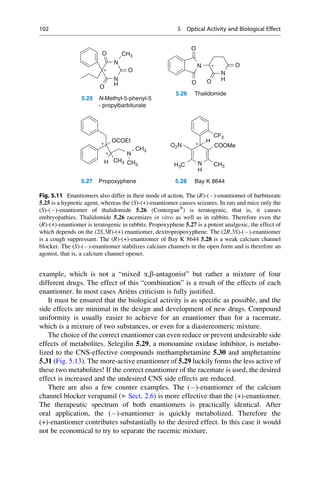
rumbling in the bowels, diarrhea, and for two additional days loose stools. It was
later established that 150–200 mg would have been a therapeutic dose.
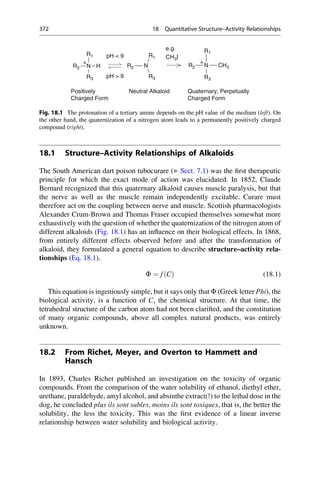
N
N
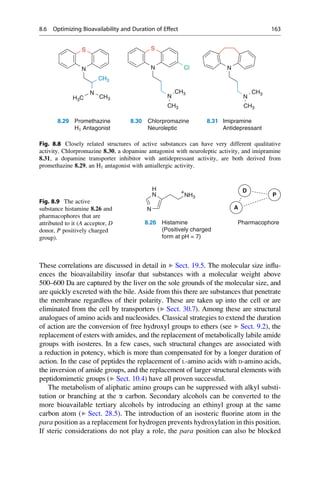
H3C
H2N NH
CH3
CH3
NH2
R = H oder o-, p-Methyl
C20H24N2O2 + H2O
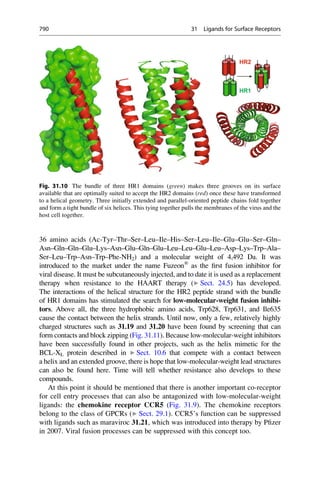
3 [O]
[O]
+
2 C10H13N
2.12 Mauveine
Allyl-
toluidin
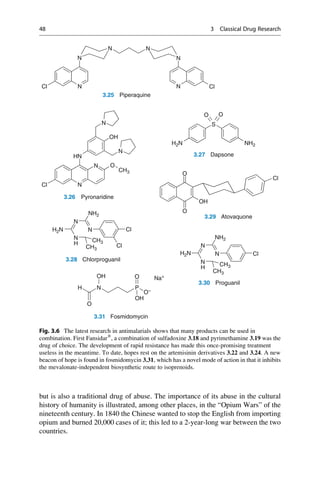
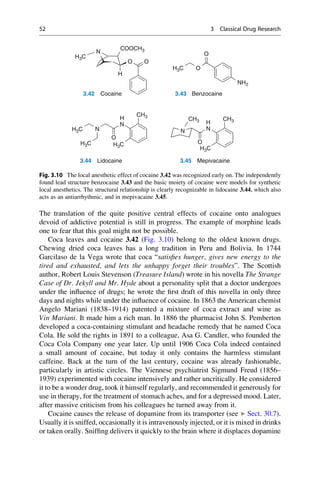
Quinine
R
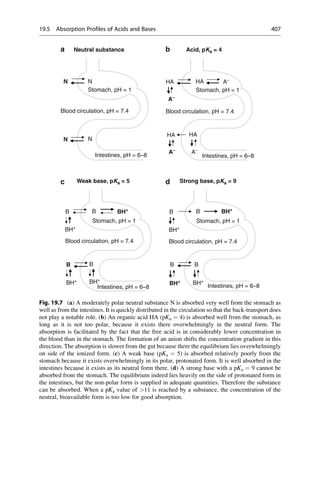
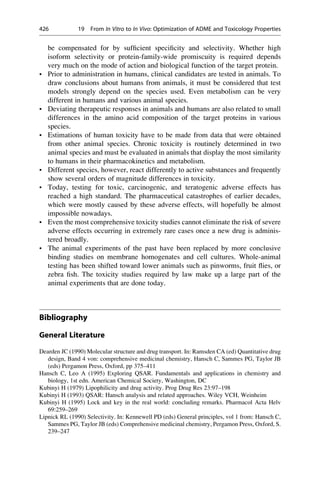
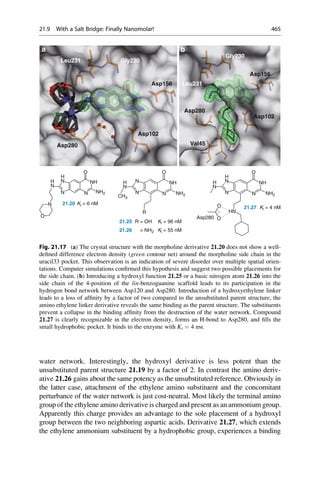
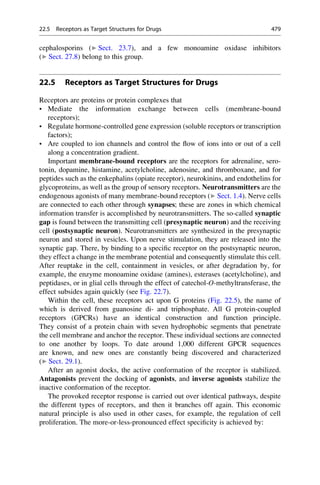
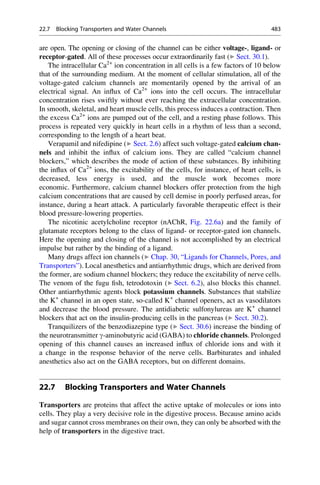
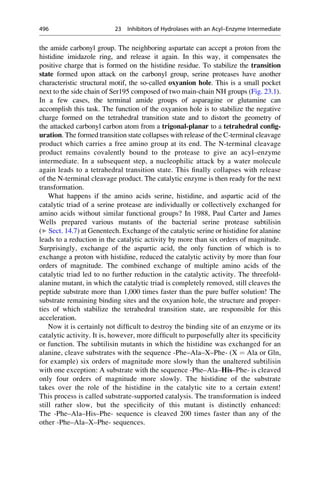
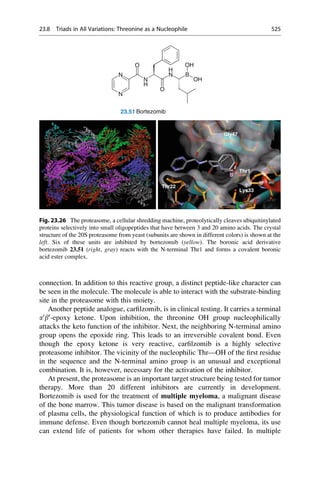
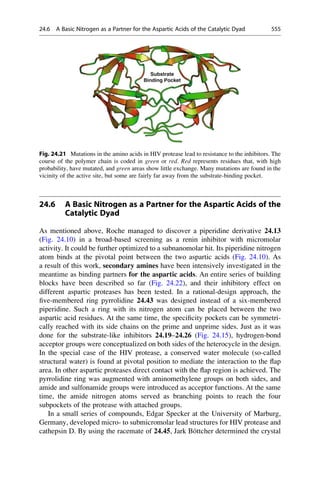
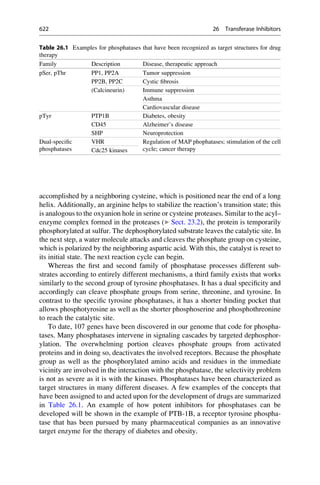
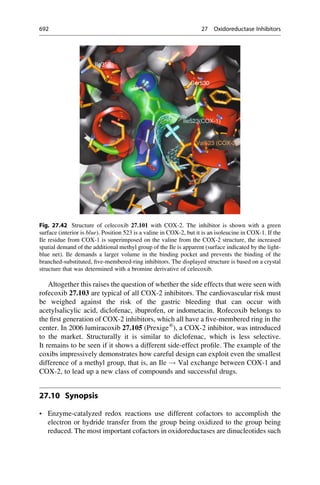
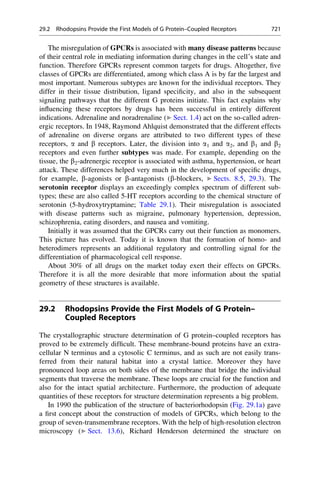
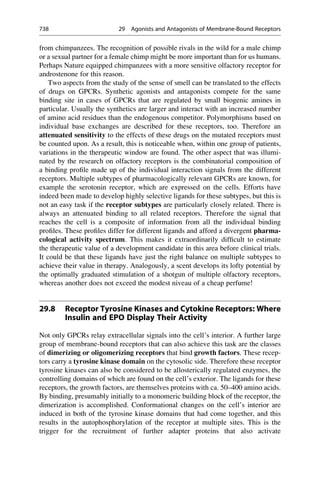
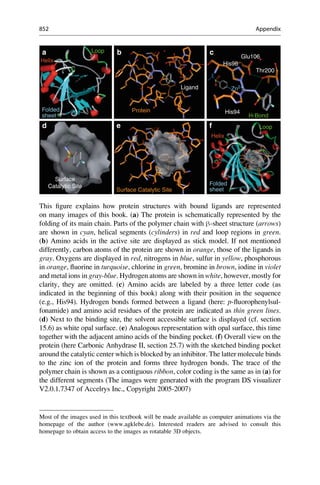
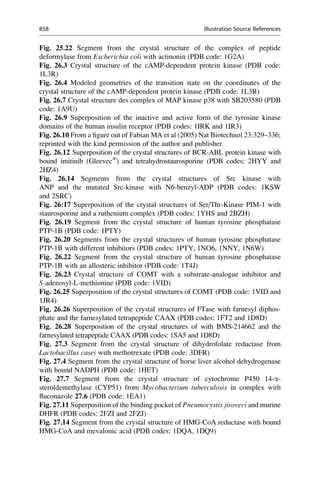
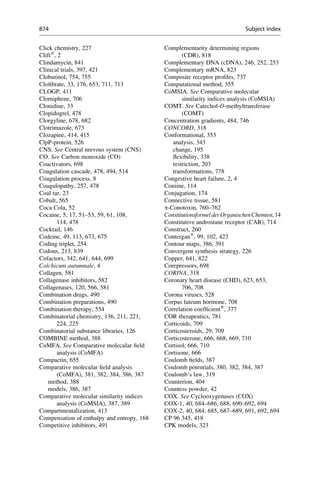
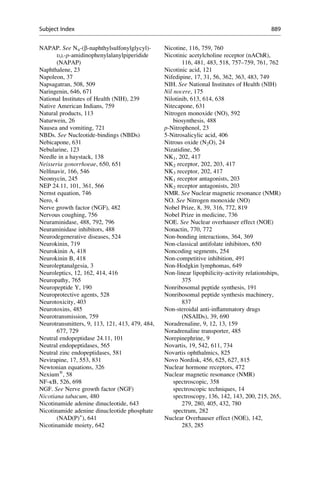
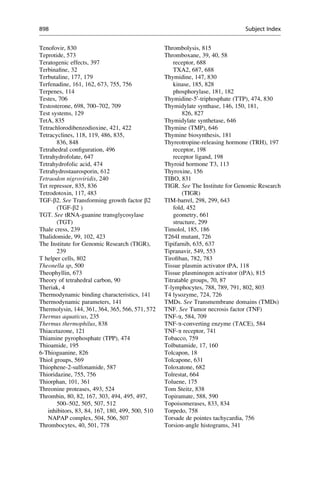
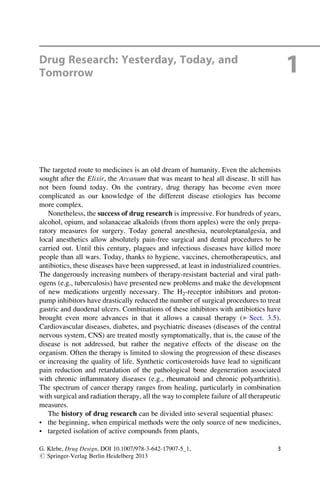
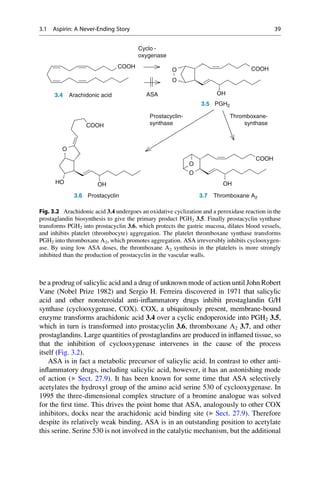
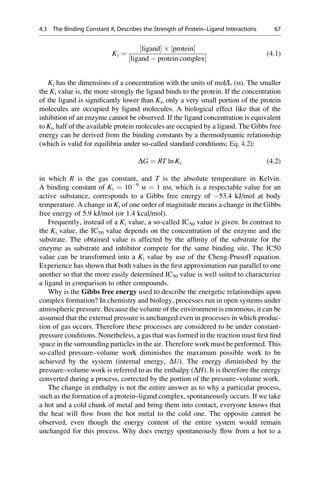
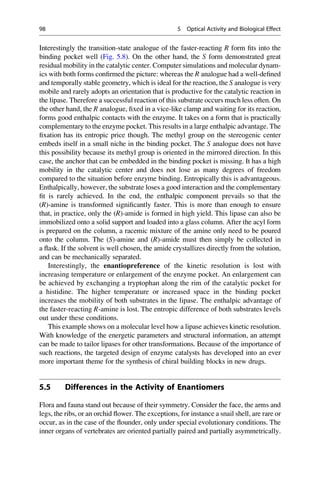
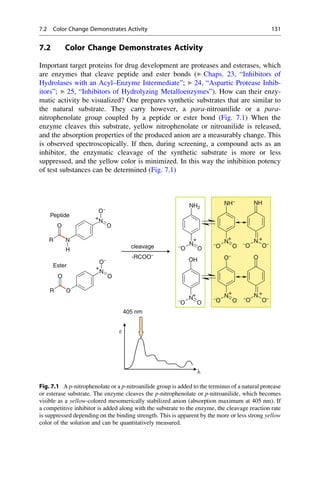
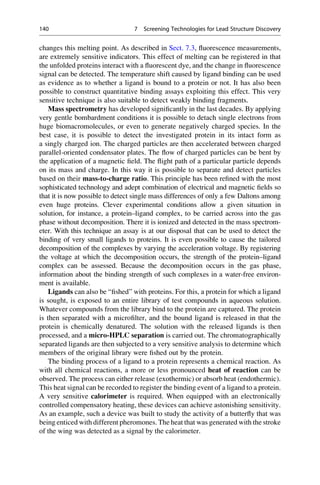
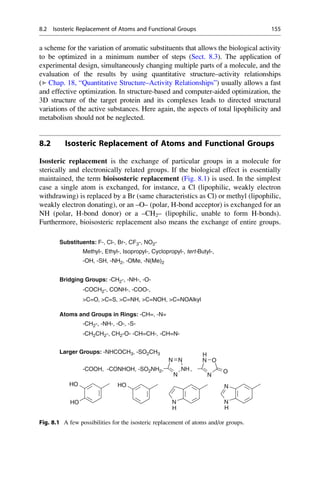
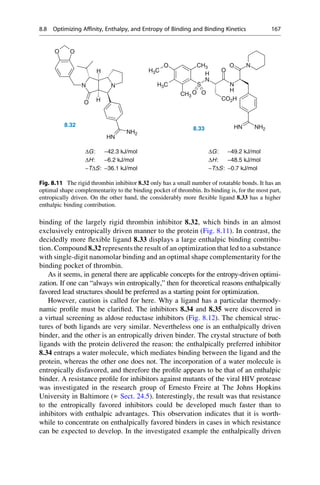
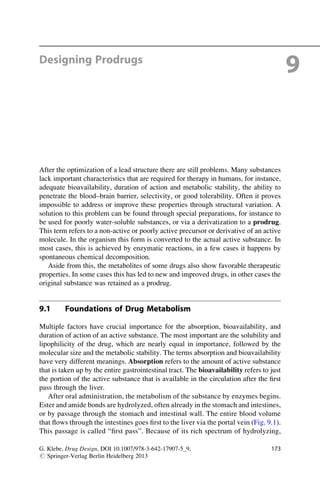
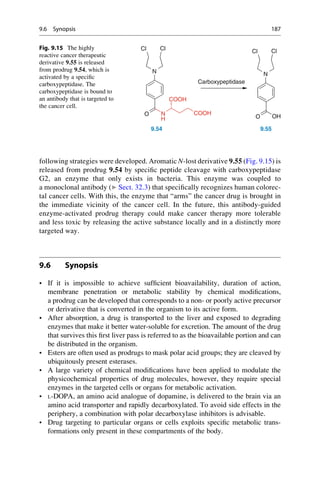
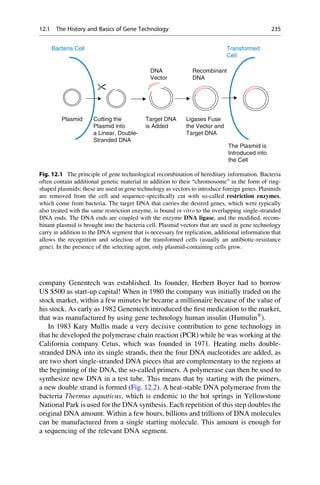
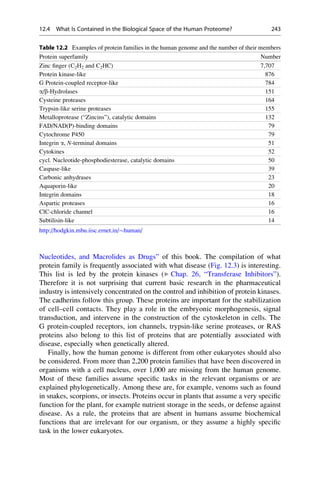
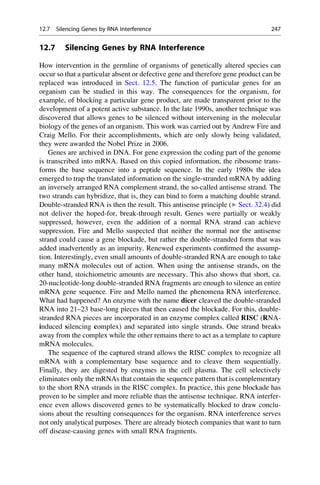
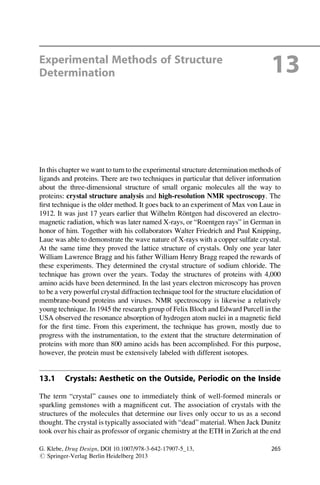
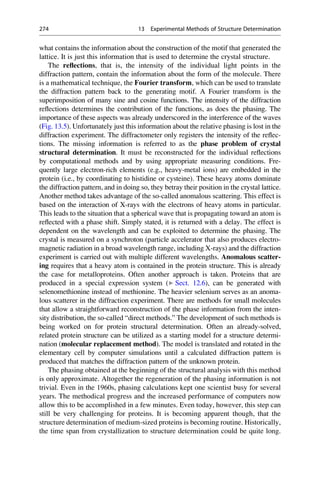
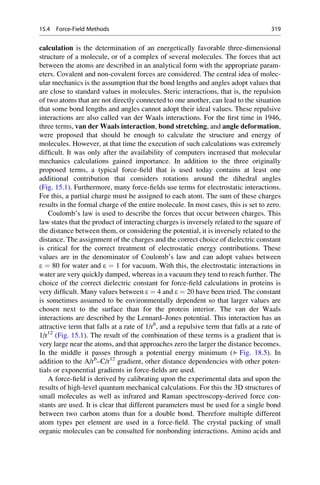
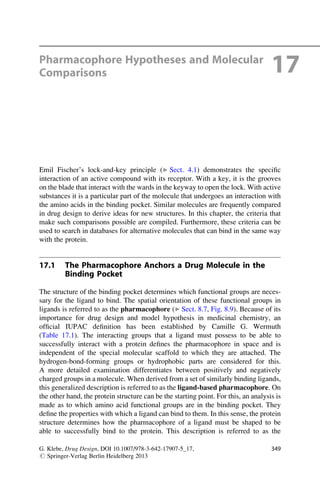
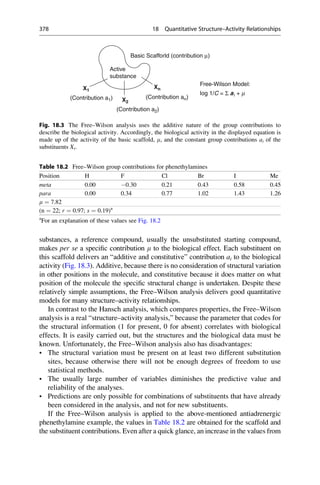
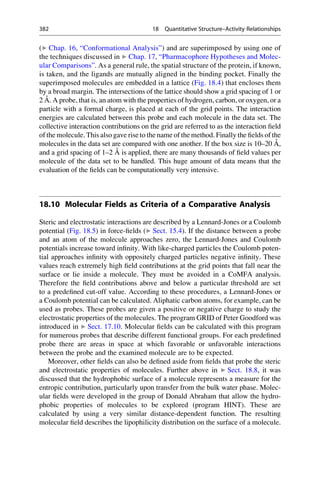
Fig. 2.4 An unsuccessful quinine synthesis founded the dye industry. The structures of many
organic compounds were still entirely unknown in the middle of the nineteenth century. The
attempt to prepare quinine via a simple route (upper reaction) could not have worked. The
oxidation of an impure aniline (below) gave mauveine 2.12 in 1856, which was used to dye silk
a brilliant mauve color. It was the first synthetic dye!
26 2 In the Beginning, There Was Serendipity](https://image.slidesharecdn.com/drugdesignbook-230205115813-ec25395b/85/Drug-design-book-pdf-43-320.jpg)


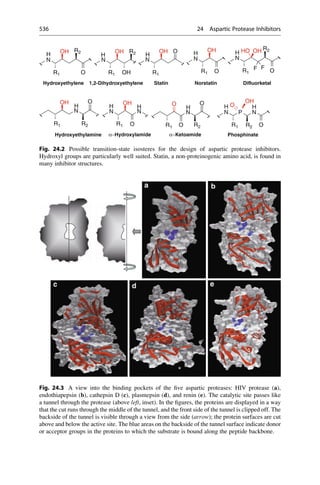
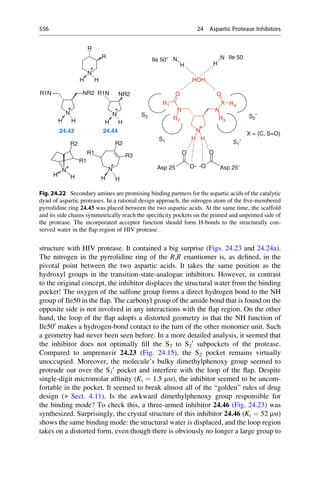
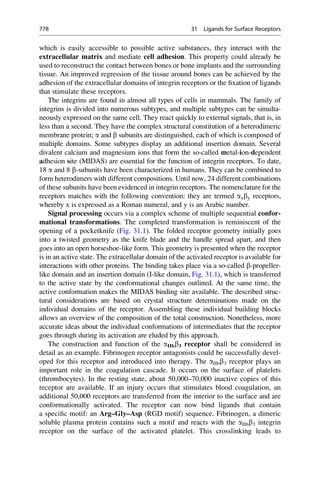
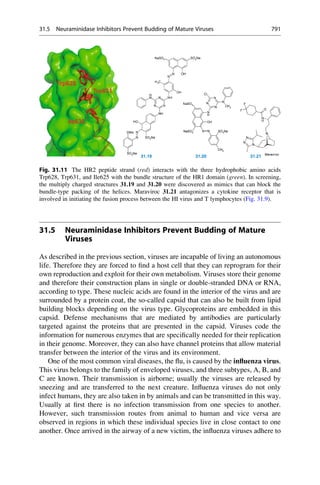
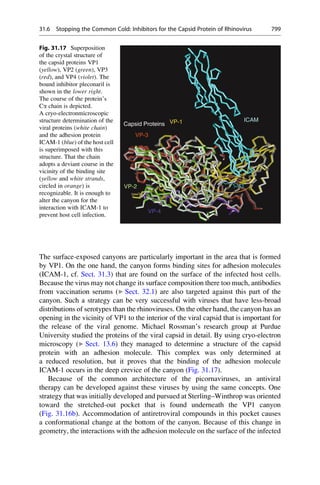
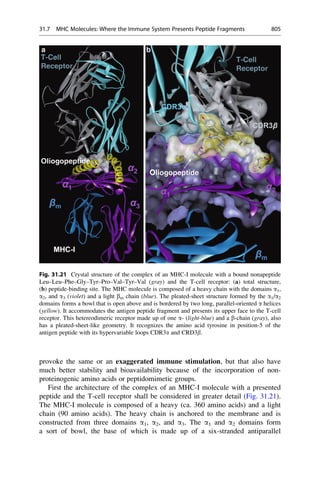
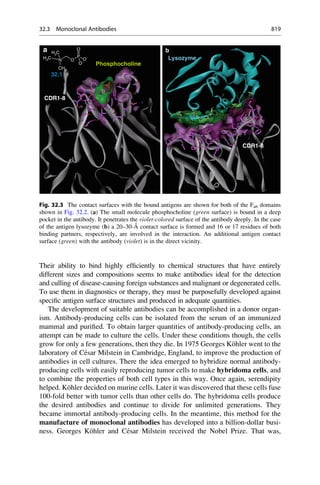
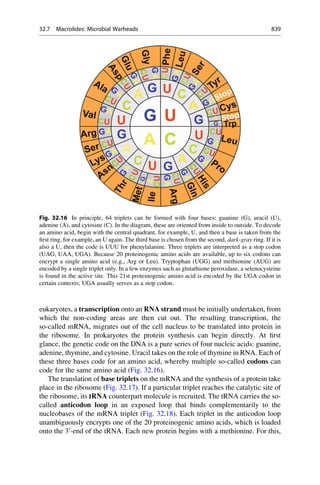
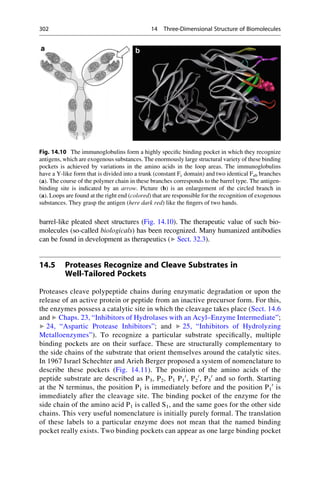
![(▶ Chap. 32, “Biologicals: Peptides, Proteins, Nucleotides and Macrolides as
Drugs”), are more often finding application as therapeutics in our pharmaceutical
arsenal.
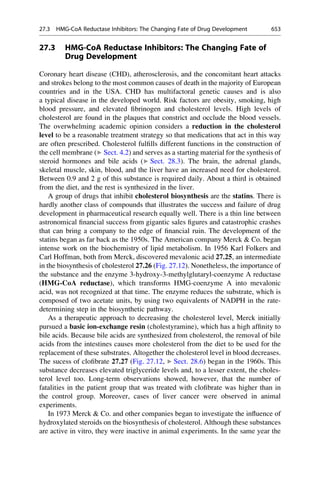
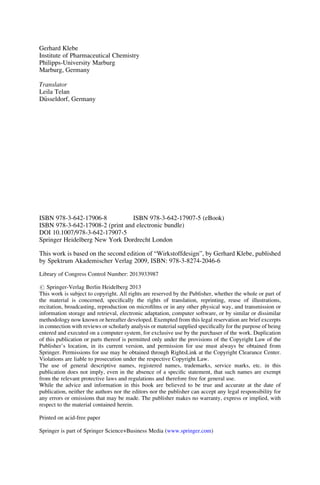
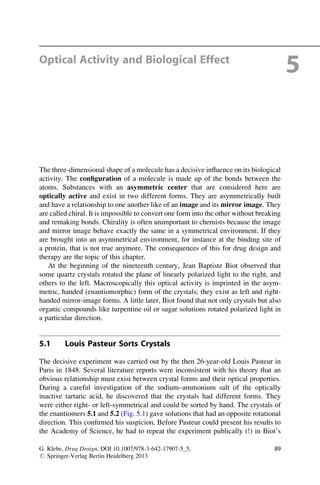
4.1 The Lock-and-Key Principle
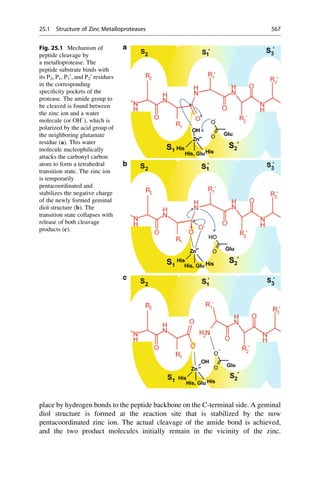
In the early 1880s, Emil Fischer investigated the cleavage of glucosides with
different enzymes that only differed in the stereochemistry of the glycosidic carbon
atom. He noticed that particular glucosides could only be cleaved with one group of
enzymes. Other glucosides, on the other hand, could only be cleaved with another
group of enzymes. He drew the correct conclusions from his observation and in
1894 formulated them in an article in the Berichte der Deutschen Chemischen
Gesellschaft (Reports of the German Chemical Society):
The limited effect of enzymes on the glucosides can also be explained by the assumption that
a chemical process can be initiated only by those [enzymes] that have a similar geometric
construction that approximates that of the molecule [substrates]. To use a picture, I want to
say that enzymes and glucosides must fit together like a lock and key to be able to exert
a chemical effect upon one another. This idea has gained plausibility and value for
stereochemistry research after the phenomena was transferred from the biological to the
chemical field.
In the same year he refined this picture:
Apparently here the geometrical construction exerts such a large influence on the play of
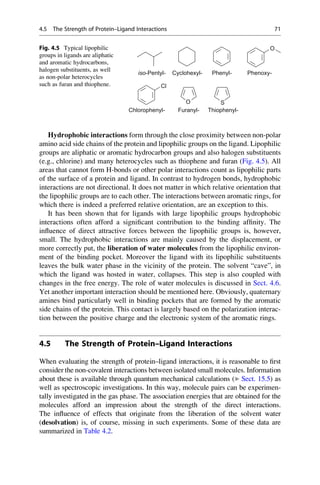
chemical affinities that the comparison of the two molecules undergoing an interaction
seems to me to be comparable to a lock and key. If the fact that some yeasts can ferment
a larger number of hexoses than others is to be explained, the picture can be completed by
differentiating between master and special keys.
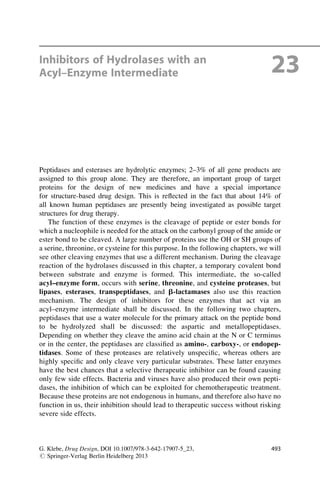
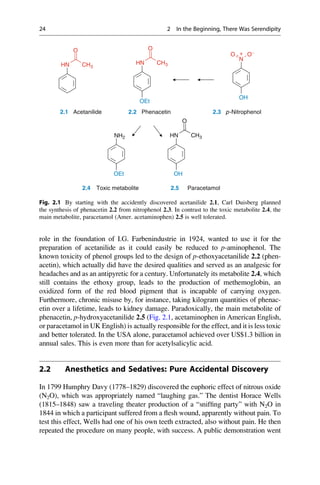
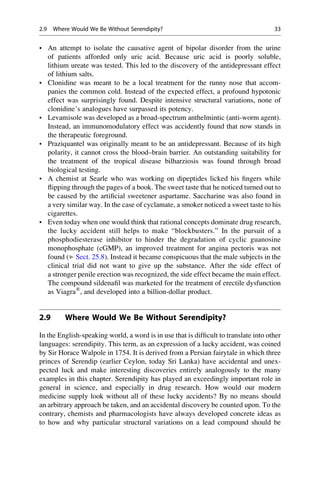
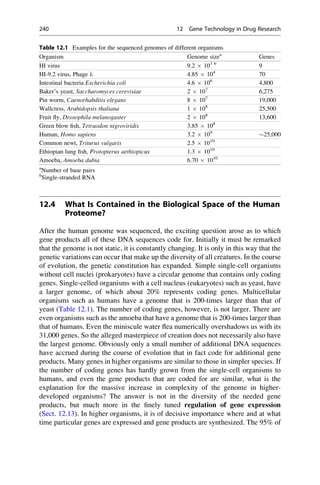
Emil Fischer did not pursue this image any further, and later even complained that it
is often quoted out of context. The configuration of the sugars interested him, that of
the isomeric glucosides did not. He expressed a rather distanced attitude to purely
theoretical considerations. In 1912, he wrote in a letter “I myself take not so much
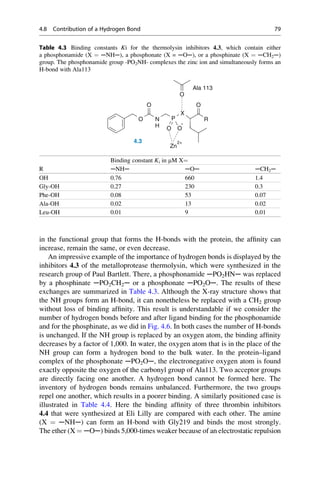
pleasure in theoretical things.” This is remarkably modest for a man who exerted such
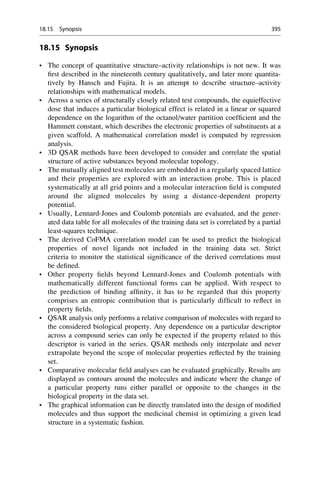
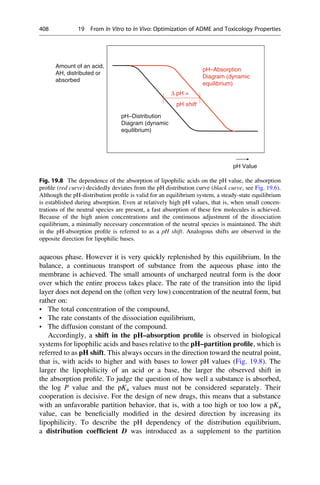
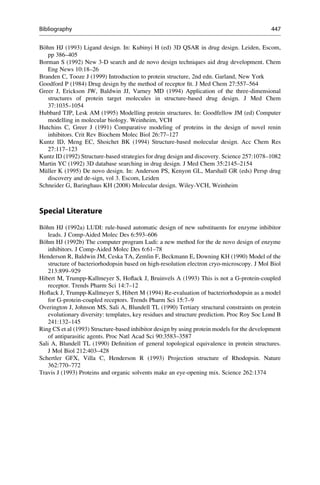
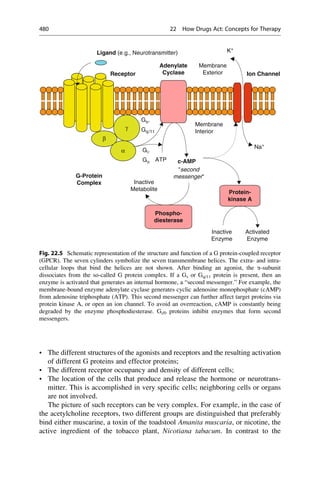
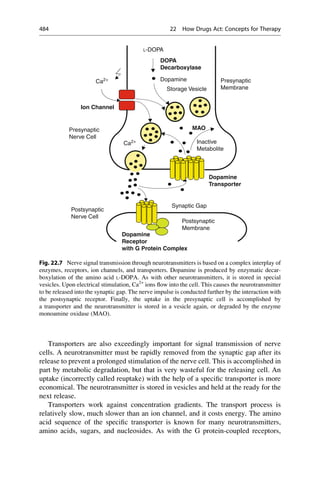
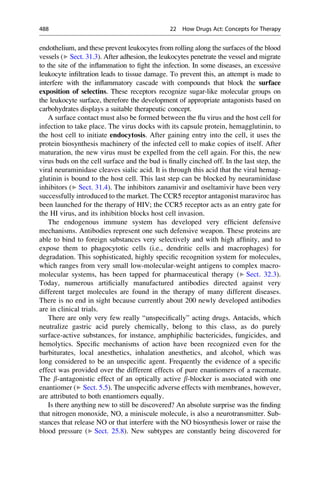
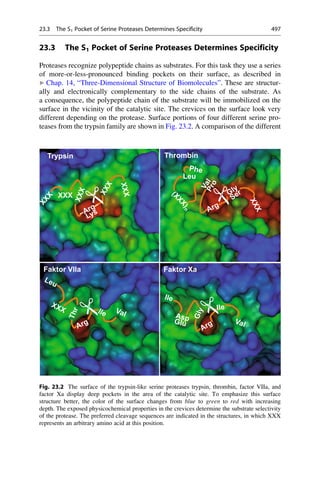
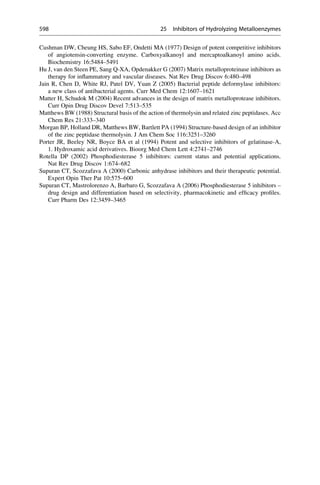
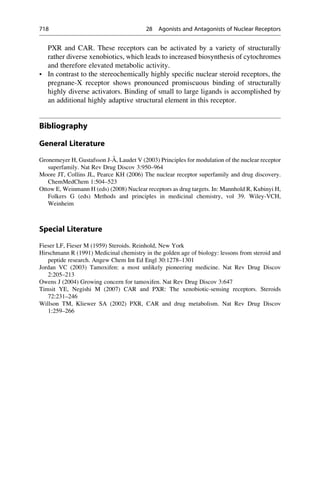
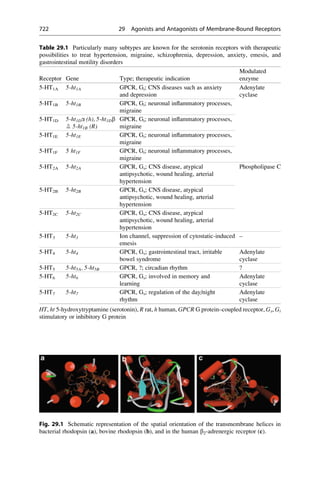
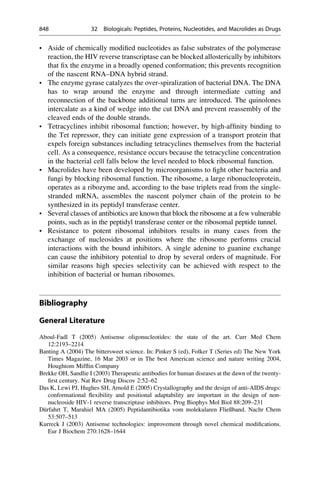
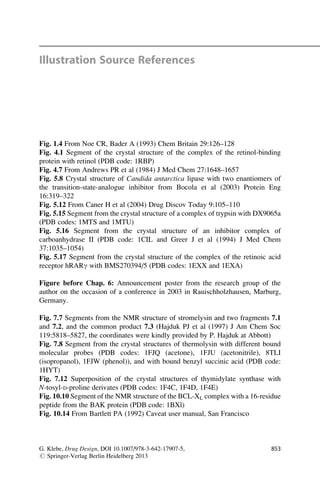
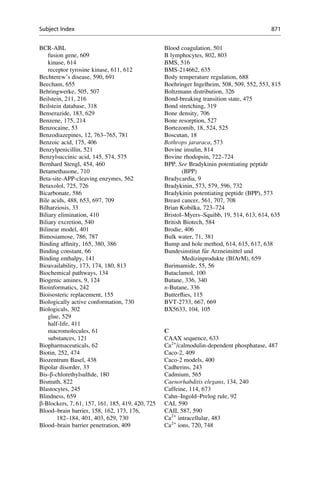
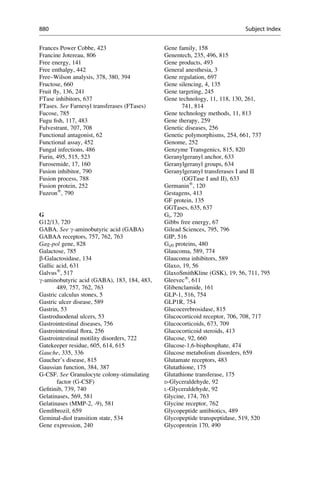
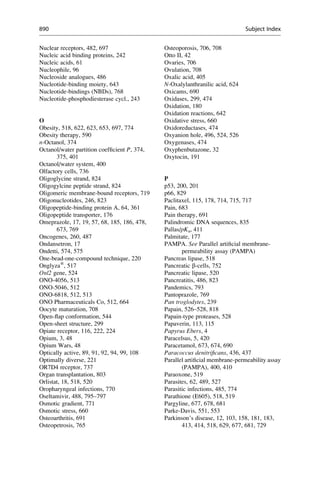
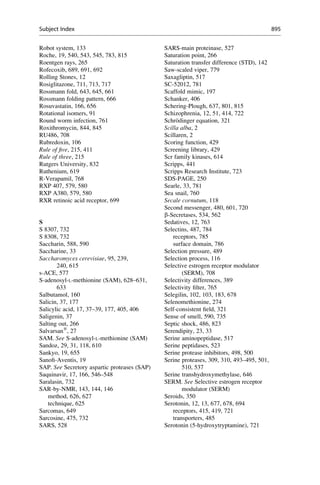
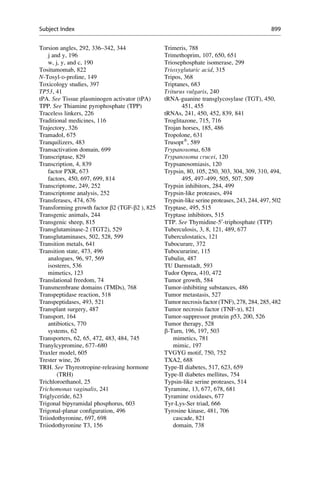
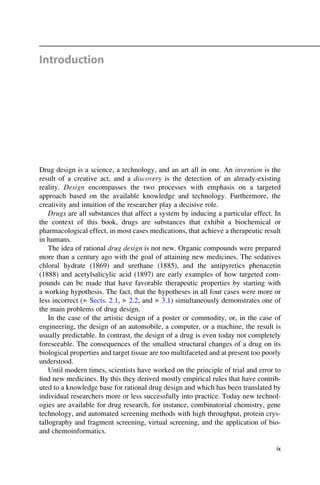
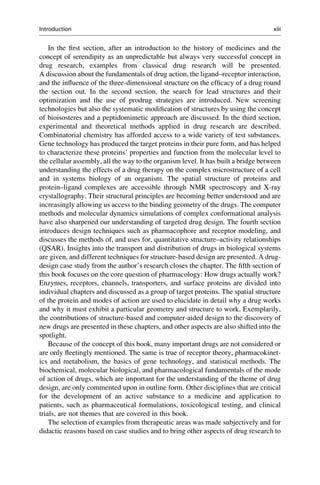
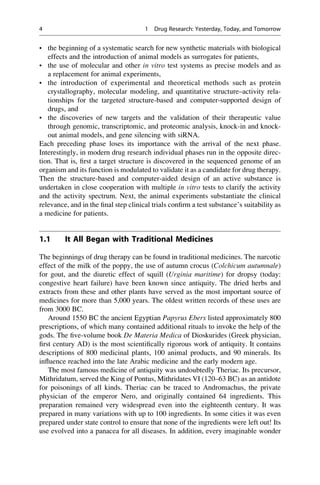
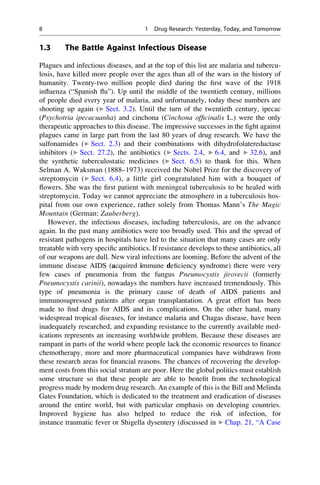
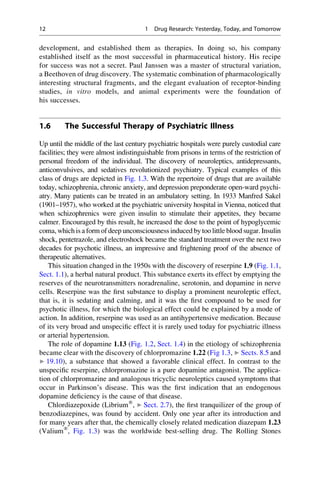
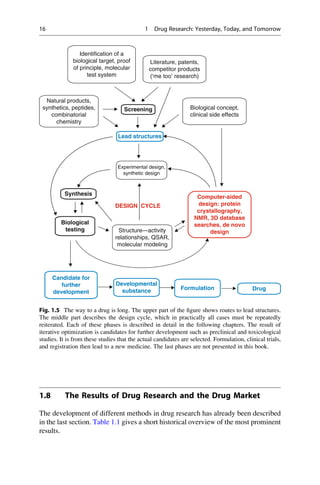
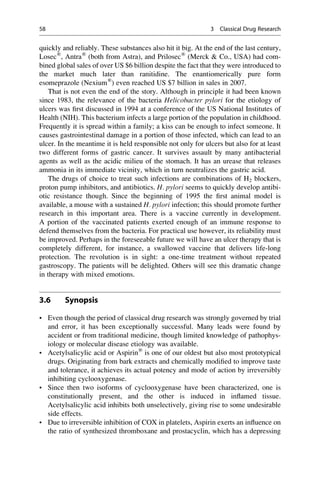
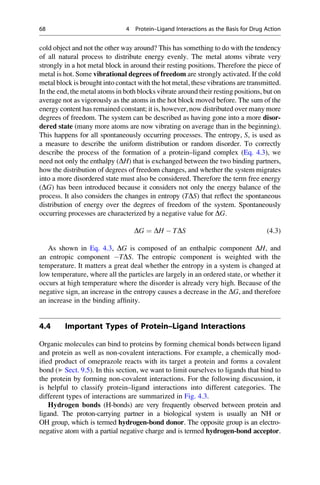
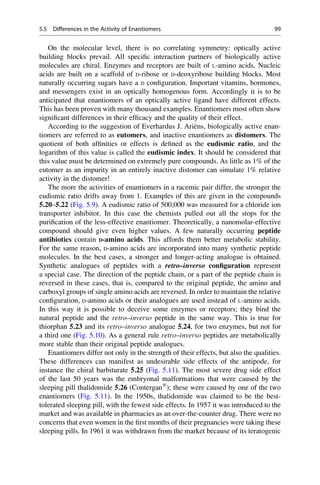
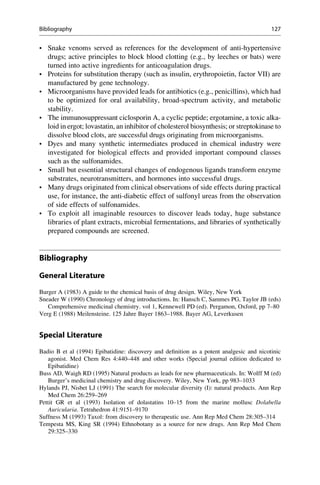
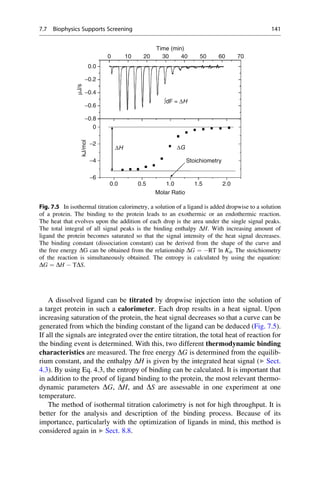
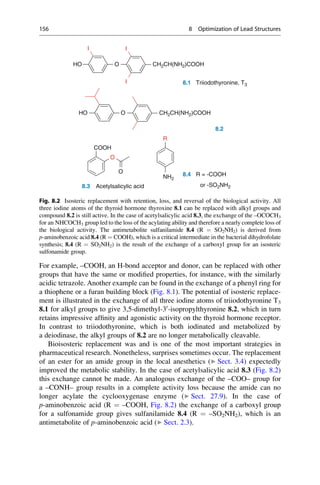
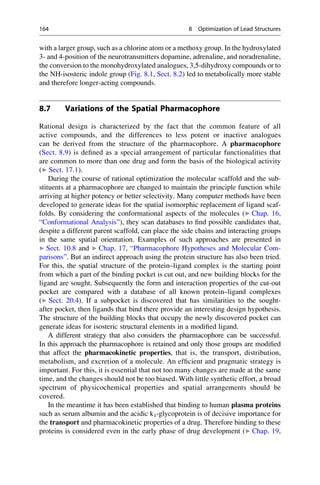
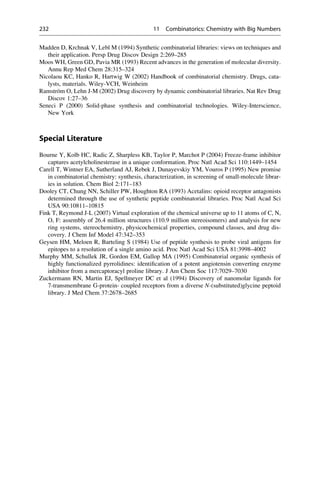
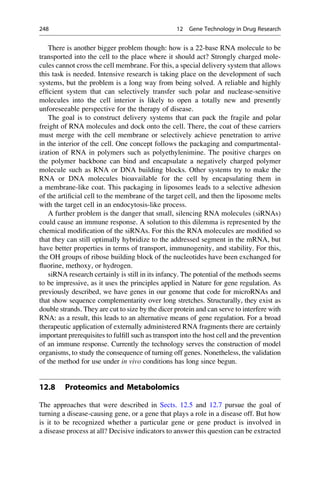
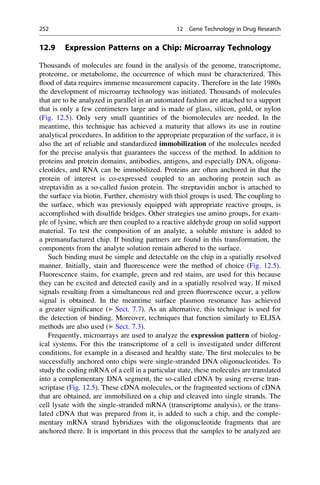
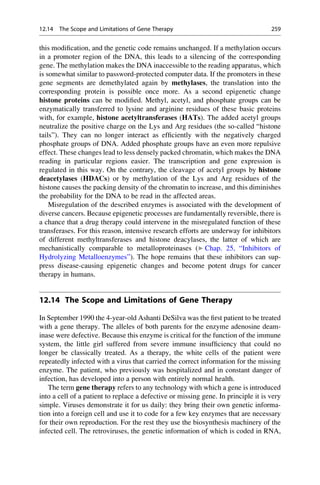
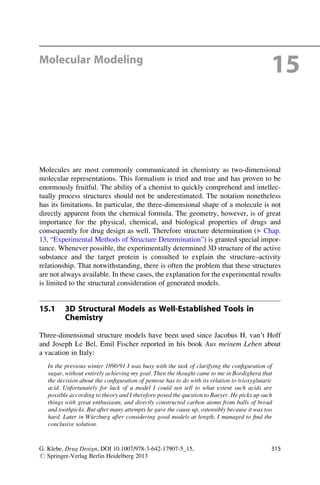
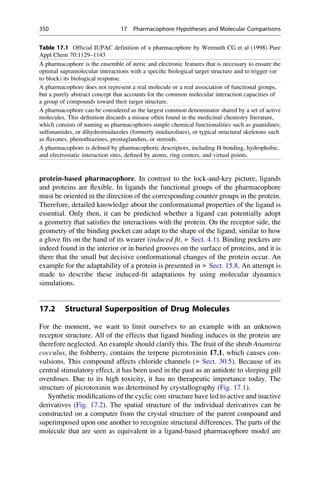
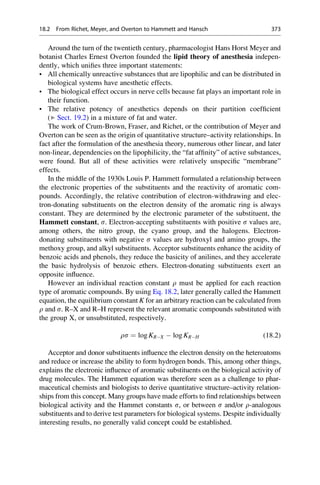
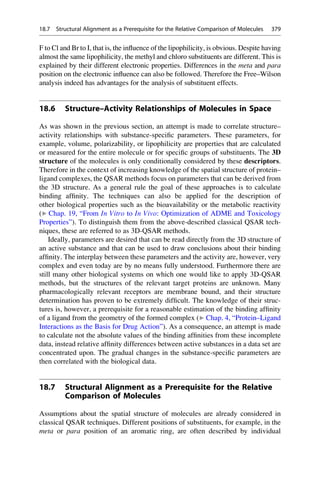
a great influence with his image of a lock and key! Emil Fischer would have certainly
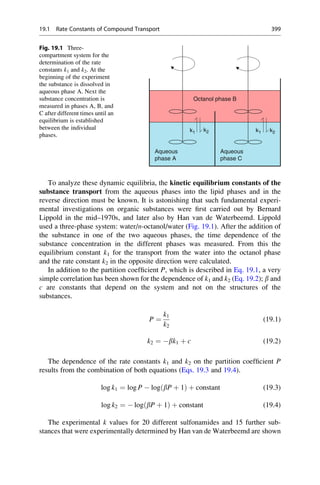
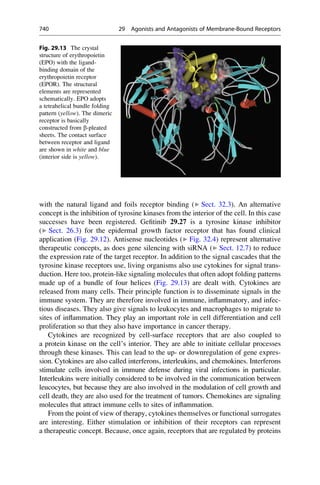
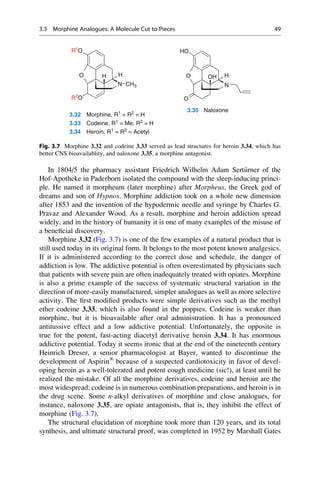
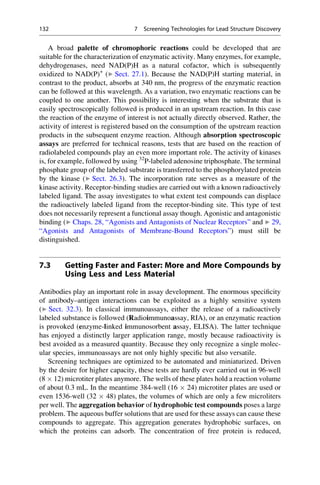
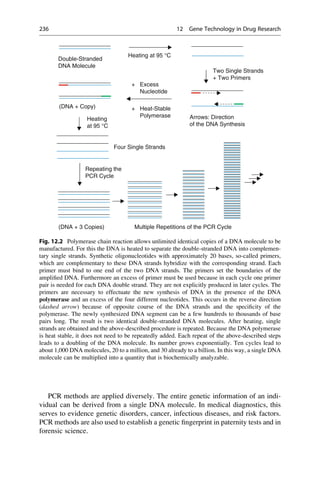
been pleased and proud if he had seen the results of the X-ray structural analysis of
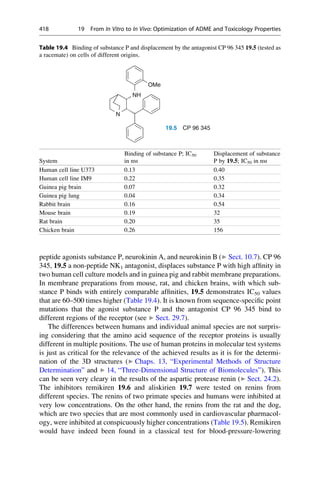
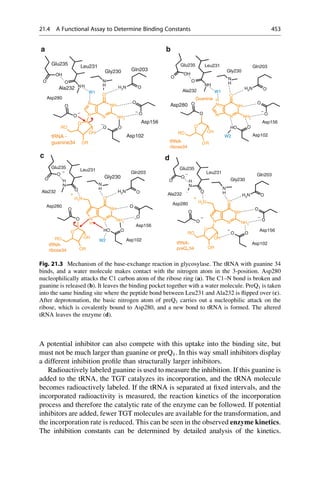
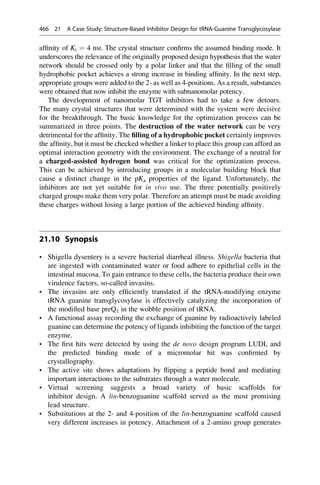
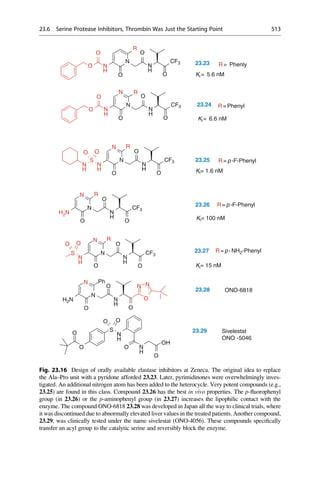
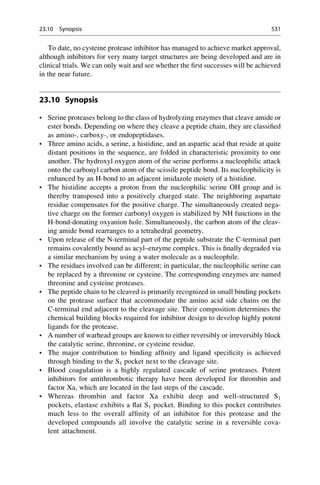
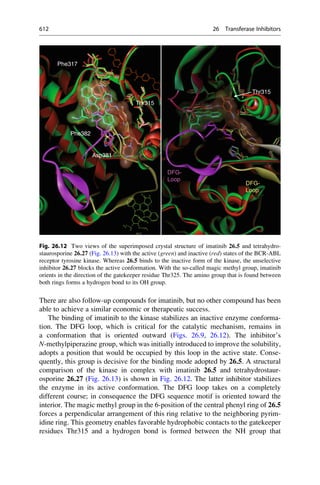
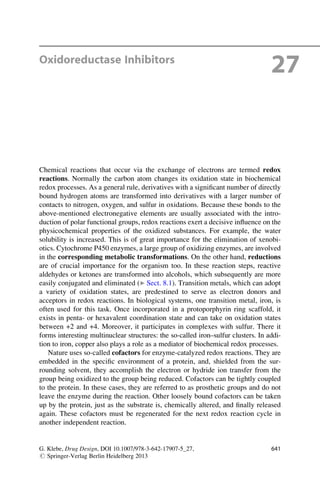
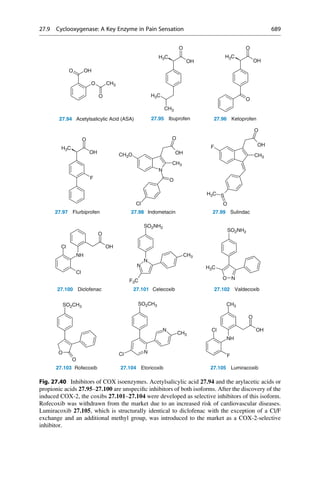
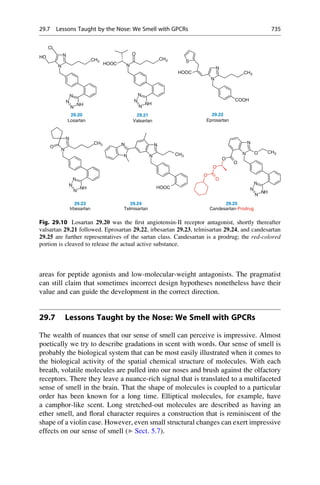
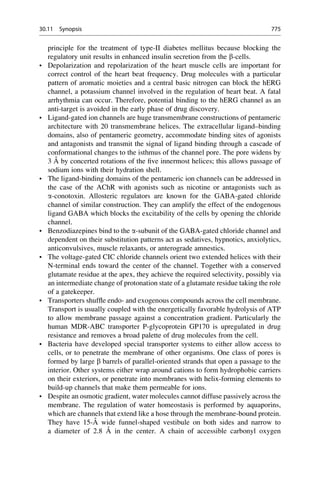
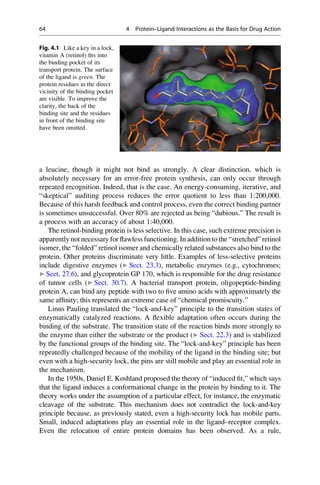
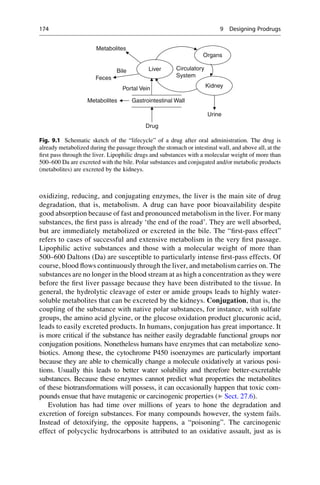
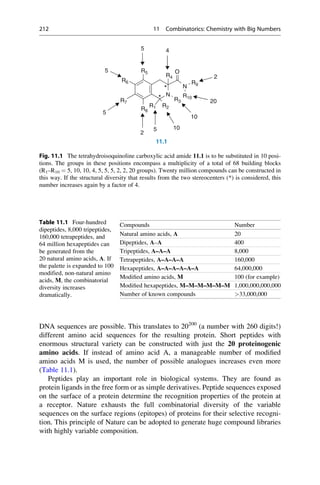
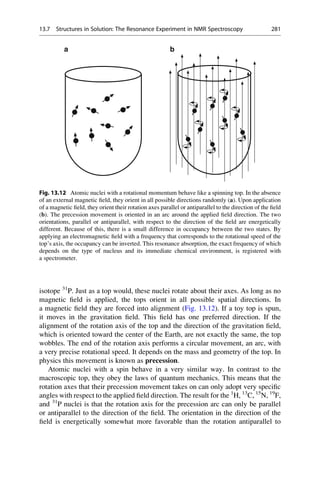
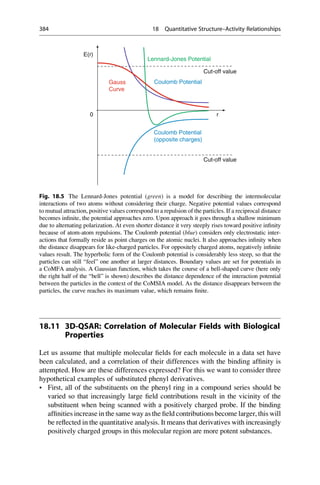
protein–ligand complexes, for instance, of retinol (vitamin A) bound to the retinol-
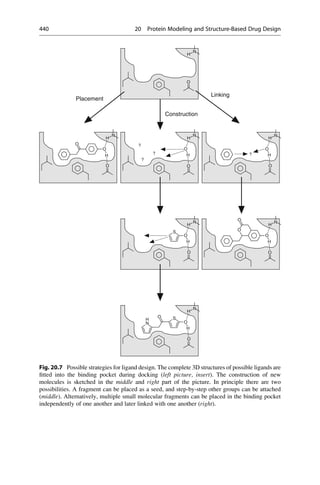
binding protein, which is the transport protein for this molecule (Fig. 4.1).
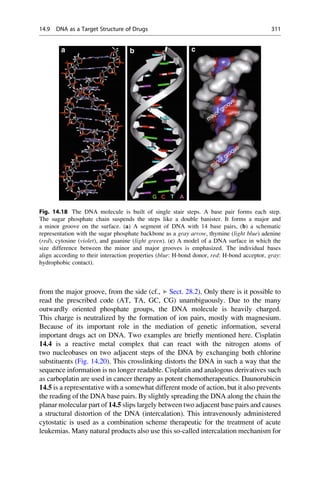
Many binding sites can exceedingly specifically discriminate between analogues
that are chemically closely related. Even the smallest mishap must not occur in
protein biosynthesis. Friedrich Cramer more closely investigated the recognition
mechanism for the incorporation of the amino acids valine and leucine. These
amino acids differ in their side-chains only in that a methyl group is exchanged
for an ethyl group. The smaller valine residue should easily fit into the “lock” for
4.1 The Lock-and-Key Principle 63](https://image.slidesharecdn.com/drugdesignbook-230205115813-ec25395b/85/Drug-design-book-pdf-80-320.jpg)

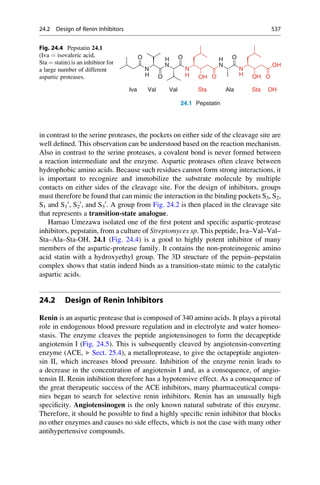
![presence at the Collège de France. He was lucky. It was only because his solutions
were allowed to slowly evaporate at room temperature that his experiment was
successful. Above the critical temperature of 28
C, a stoichiometric 1:1 mixture of
both enantiomeric forms, a racemate, would have homogeneously crystallized
(Sect. 5.4).
A few years later Pasteur managed another important observation: mold con-
tamination of a racemic tartaric acid solution caused optical activity to develop.
One enantiomer of tartaric acid is metabolized significantly faster than the other.
With this, he discovered two important methods to separate racemates into enan-
tiomers. Whereas mechanical sorting is limited to a very few examples, enzymatic
kinetic resolution of enantiomers has found broad applications (Sect. 5.4).
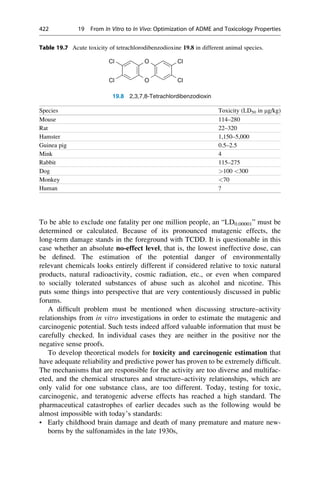
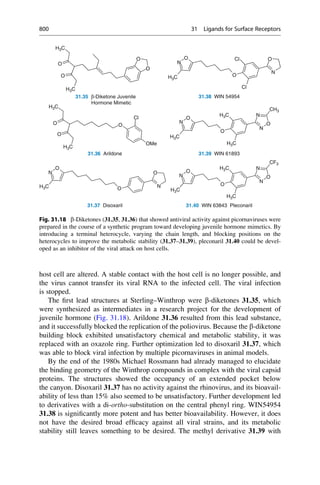
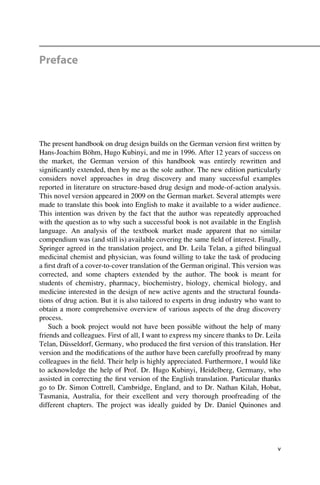
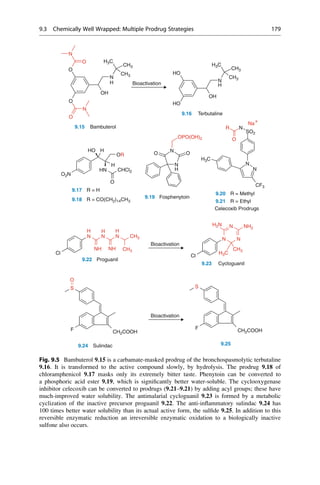
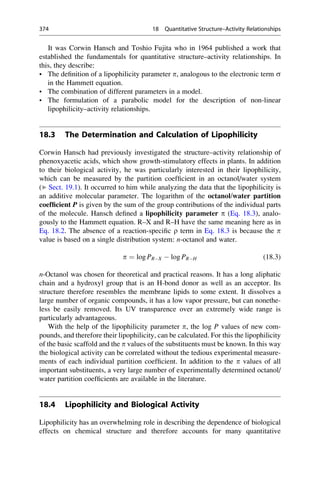
5.2 Structural Basis of Optical Activity
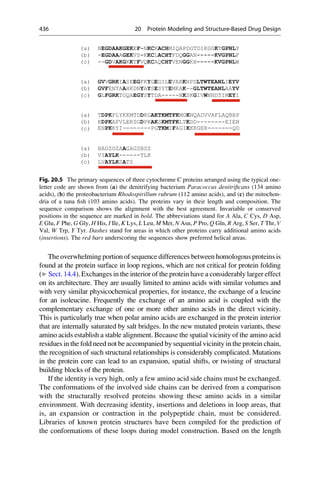
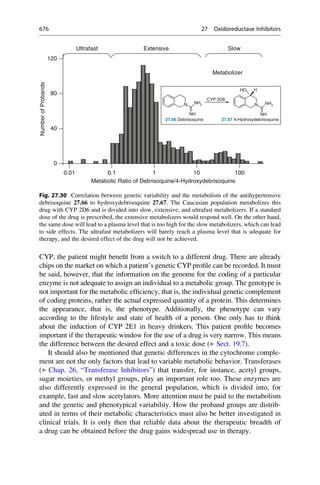
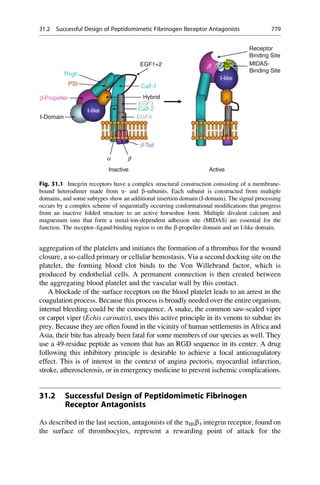
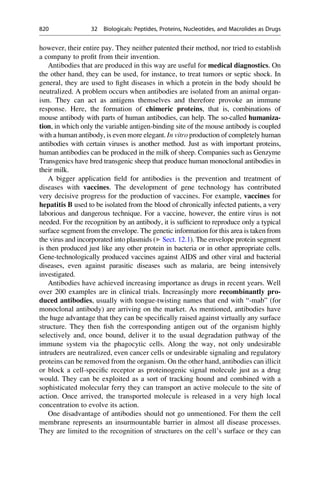
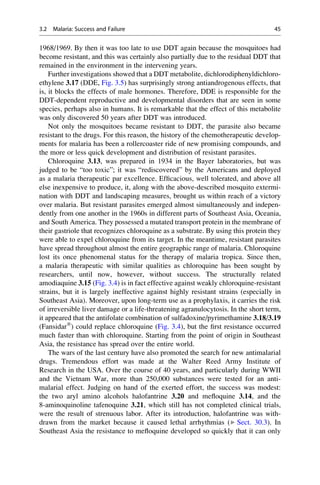
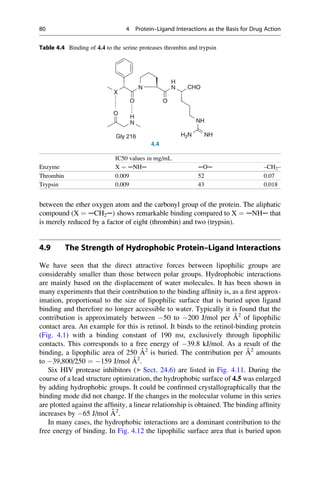
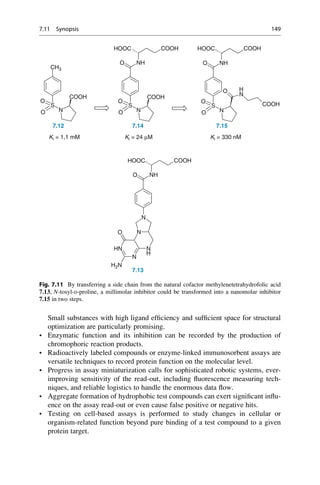
An explanation for optical isomerism was possible with the help of the theory of
tetrahedral carbon, which was independently developed in 1874 by Jacobus
COOH
HO H
COOH
H OH
COOH
H OH
COOH
H OH
COOH
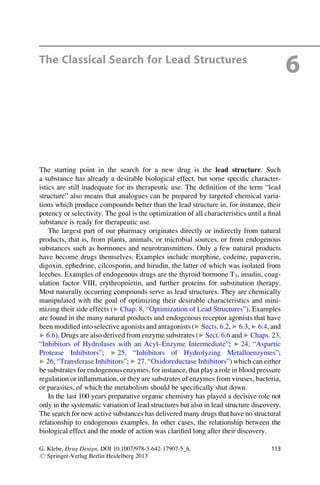
HO H
COOH
H OH
Inversion
Symmetry
5.1 5.2 5.3
D-(-)-Tartaric acid L-(+)-Tartaric acid meso-Tartaric acid
Mirror
plane
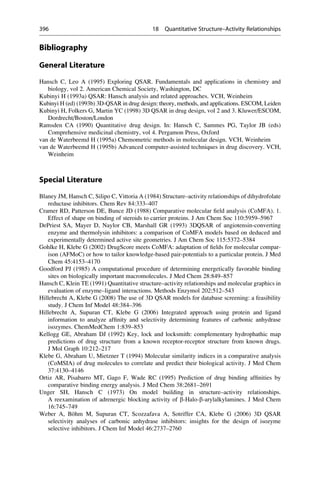
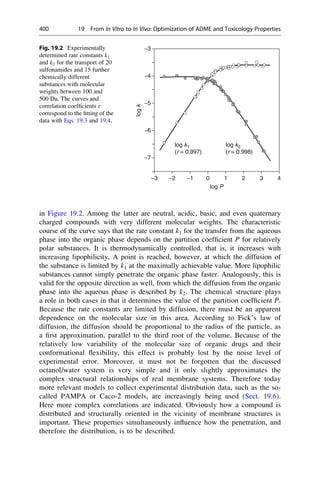
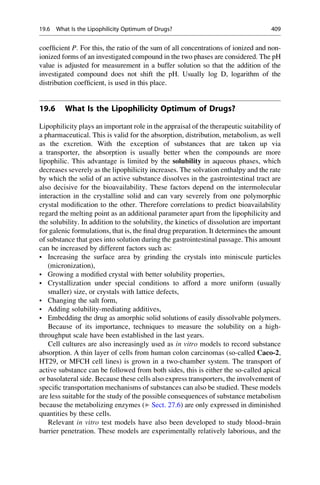
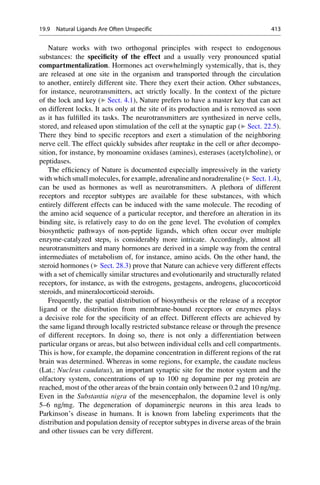
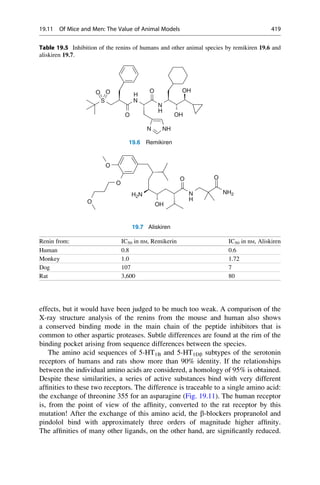
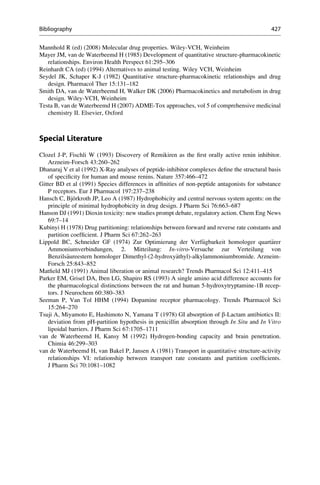
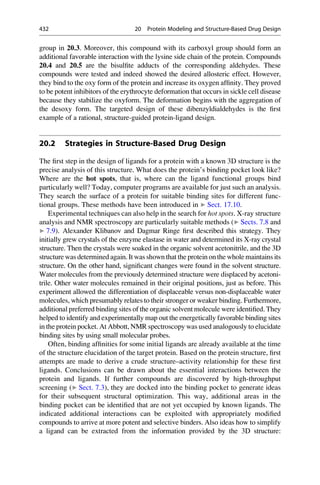
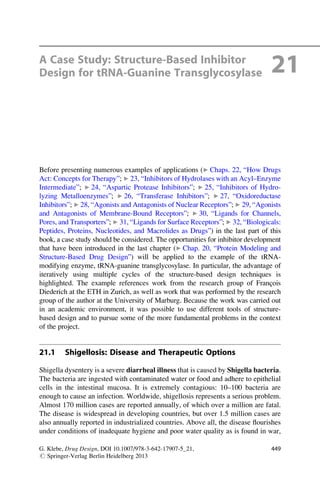
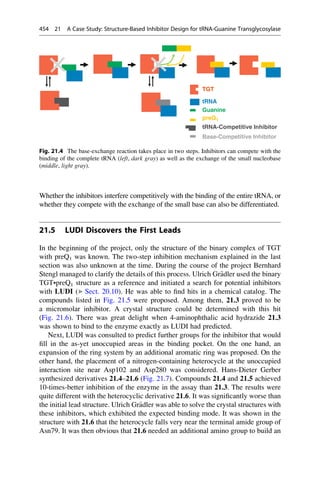
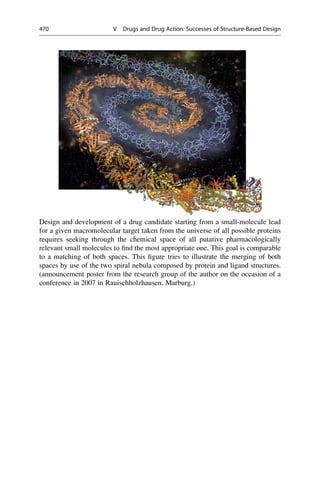
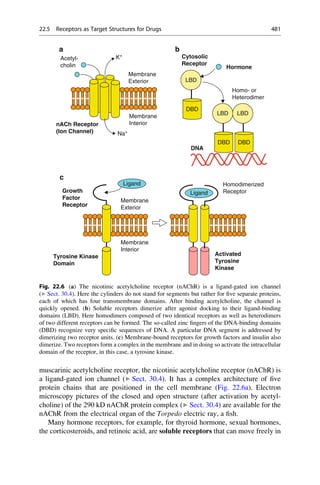
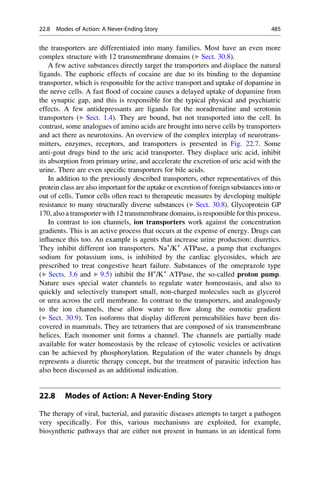
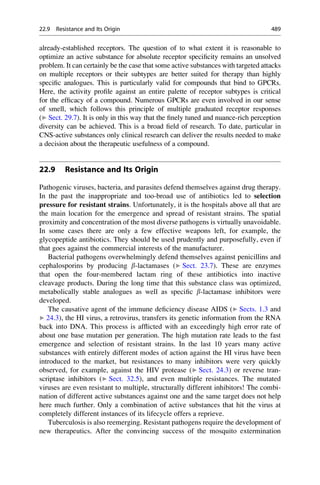
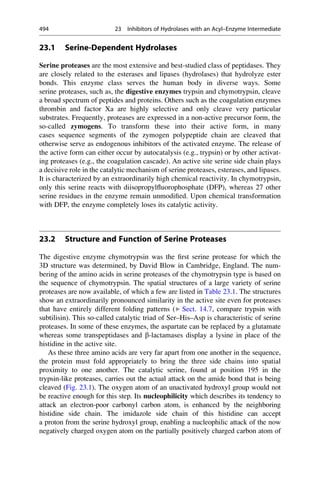
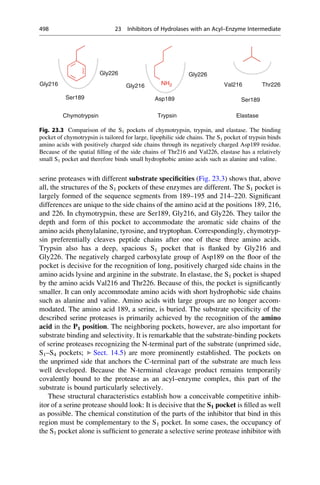
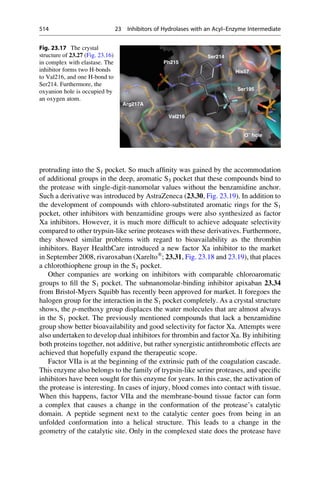
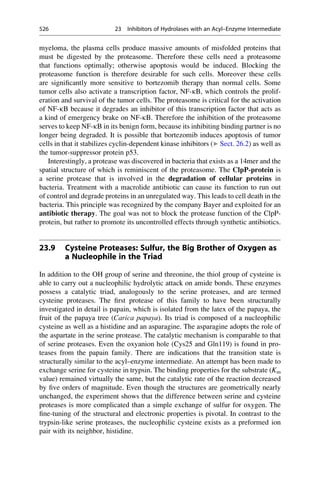
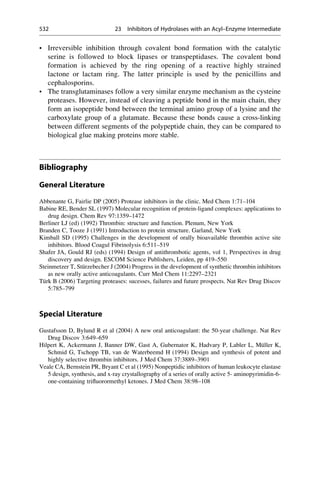
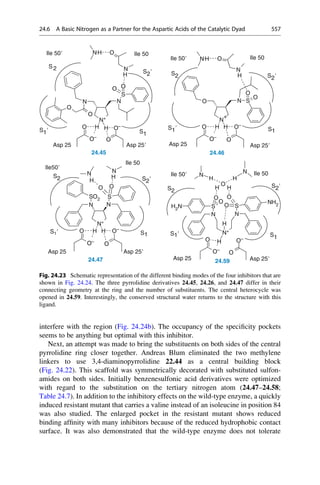
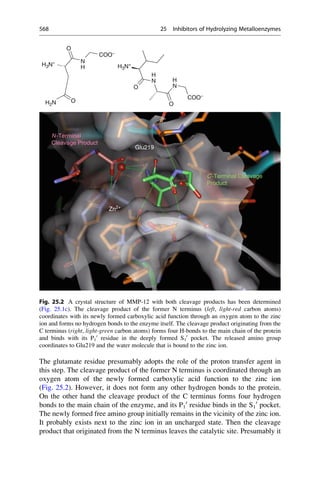
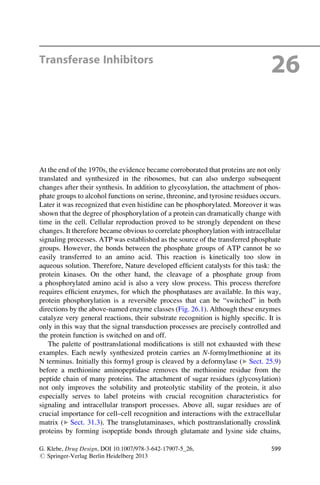
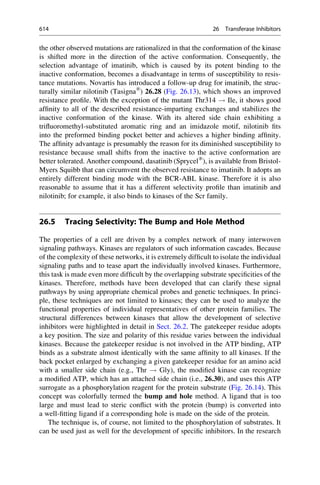
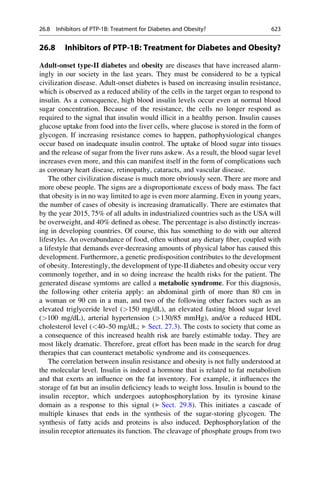
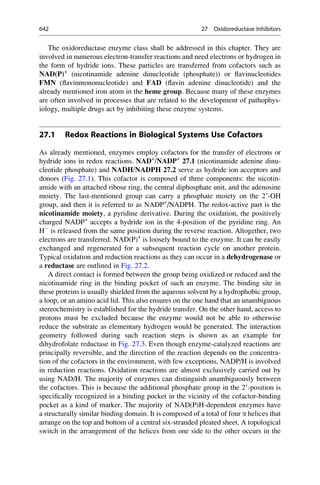
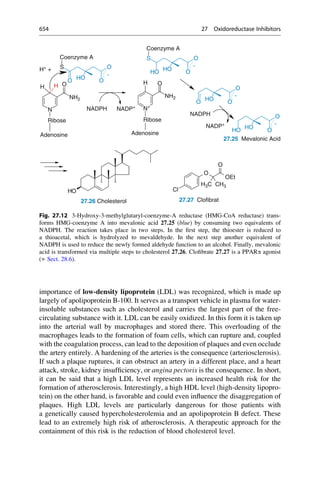
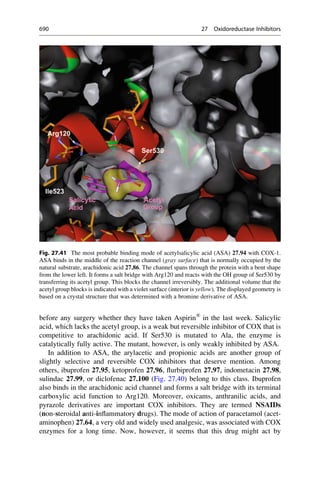
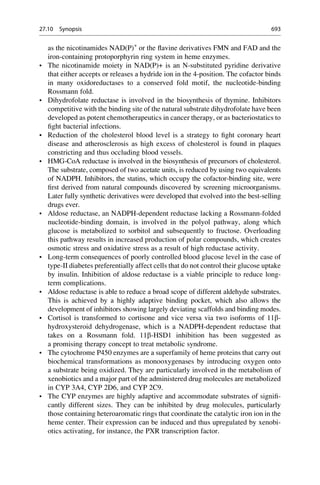
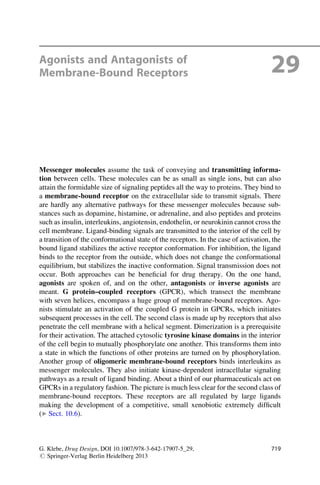
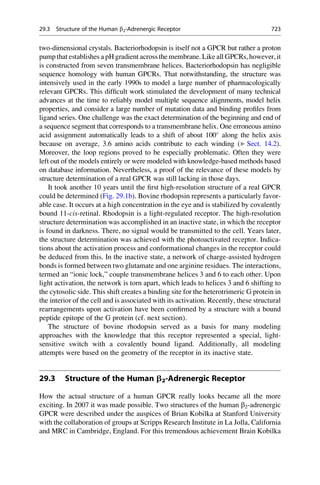
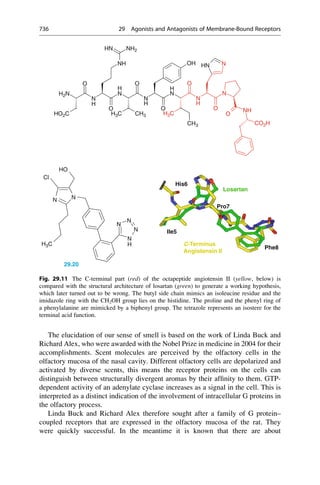
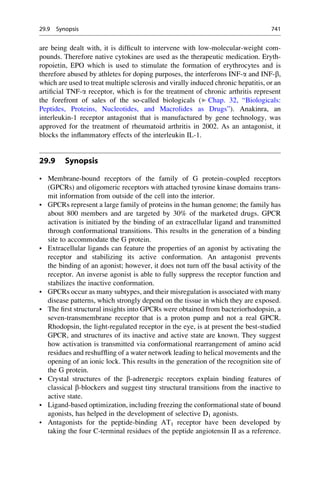
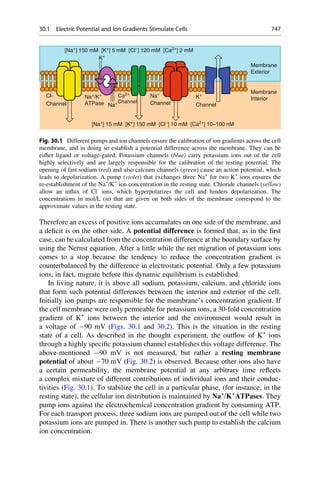
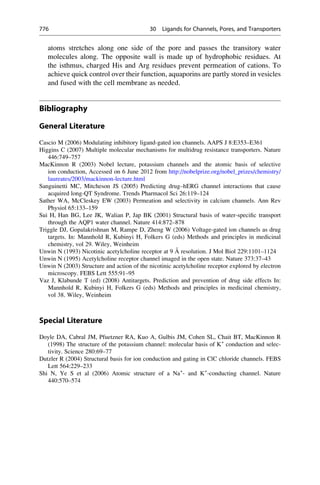
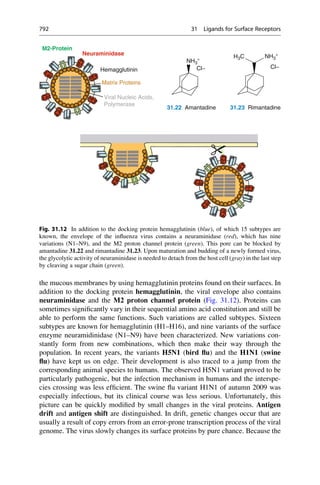
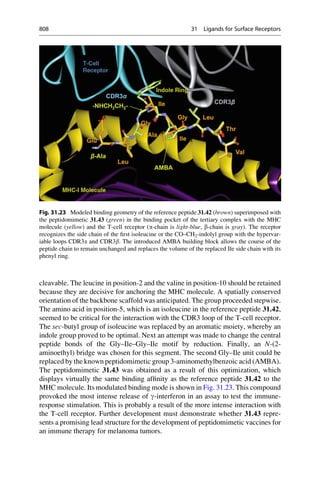
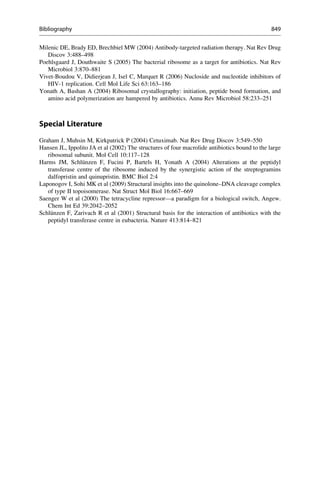
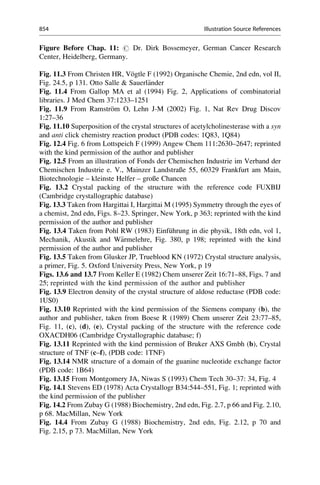
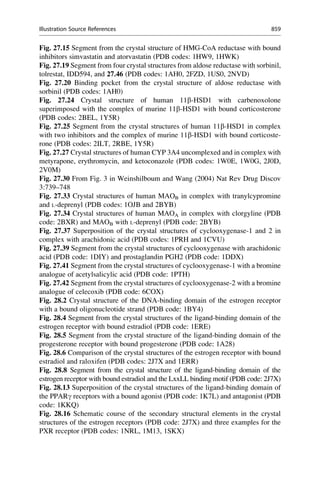
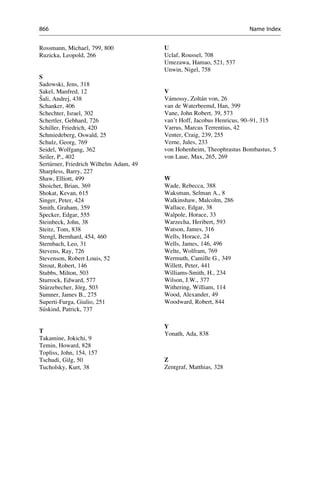
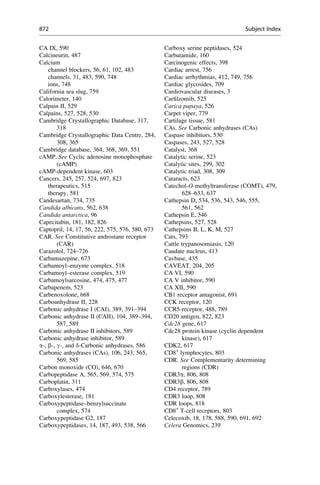
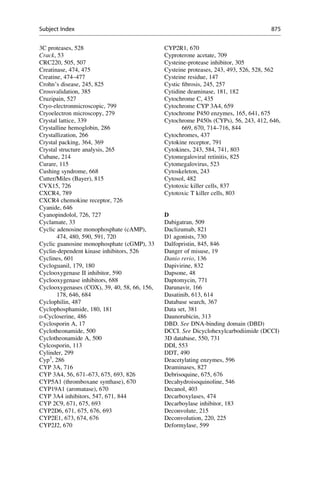
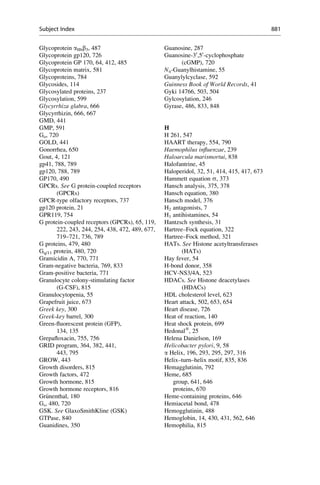
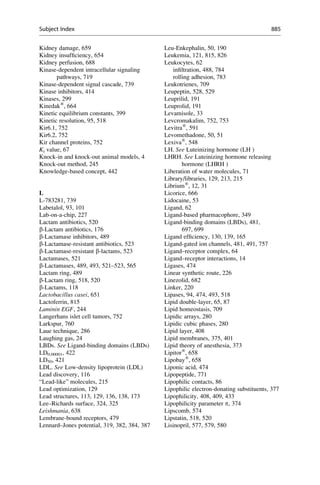
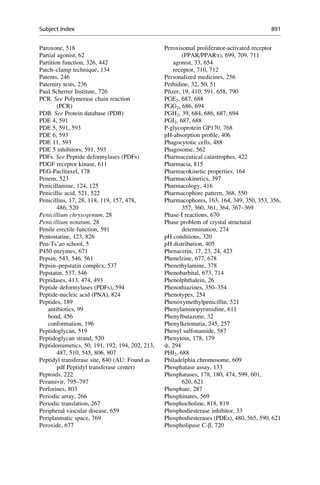
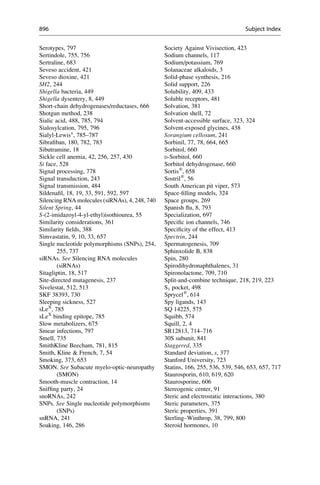
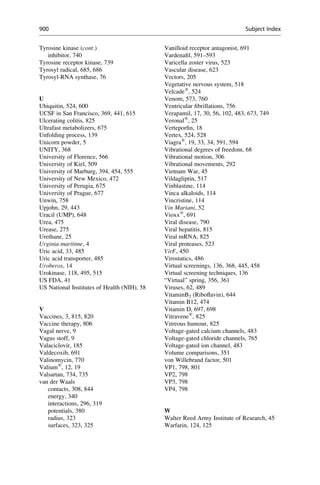
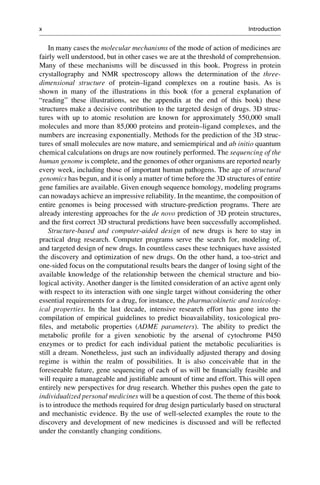
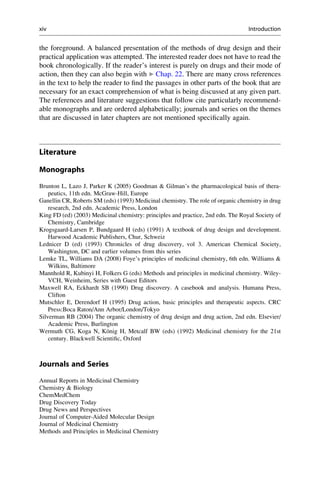
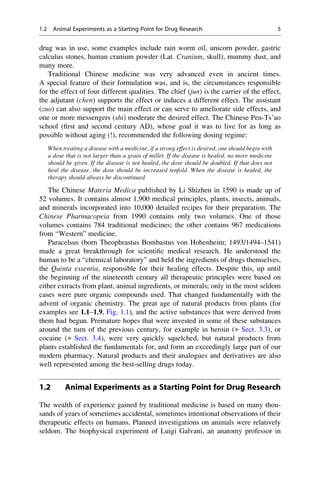
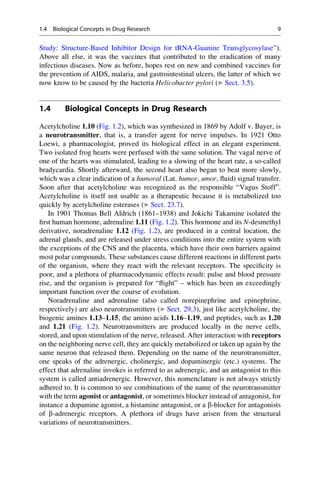
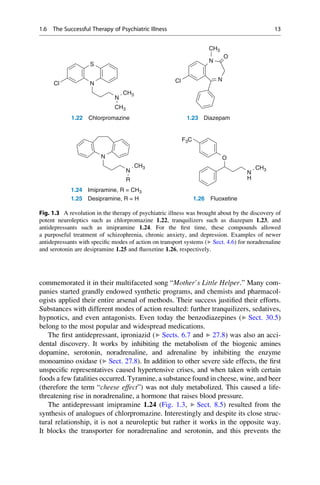
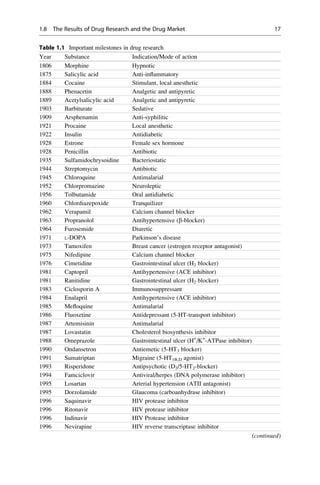
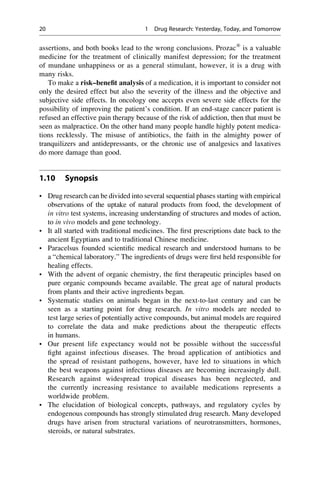
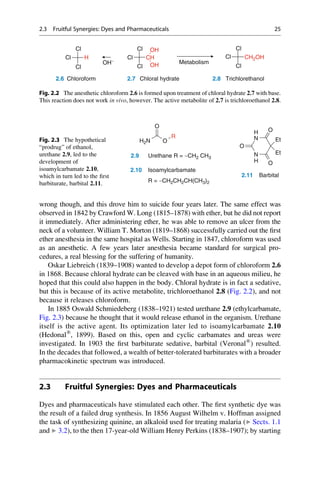
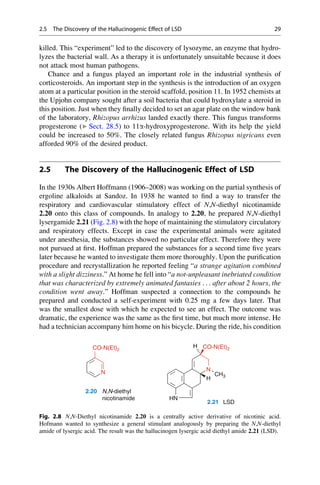
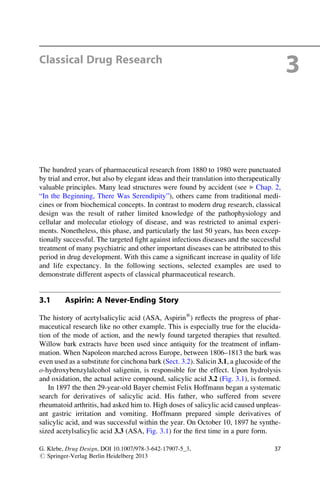
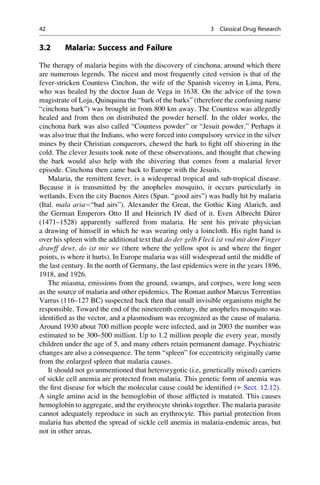
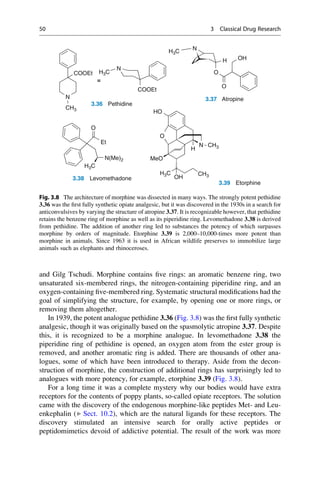
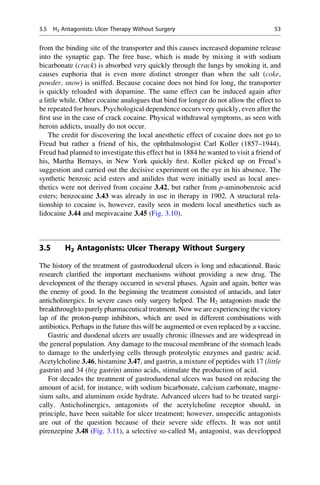
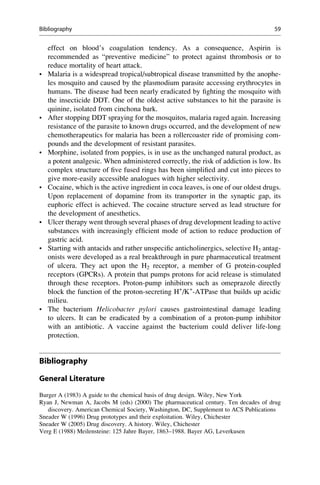
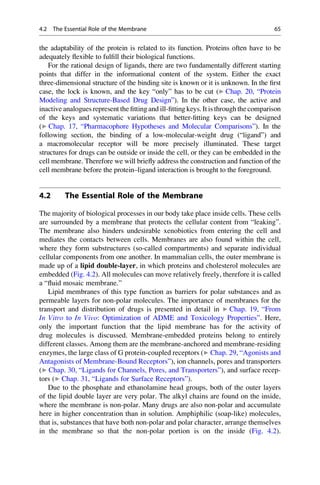
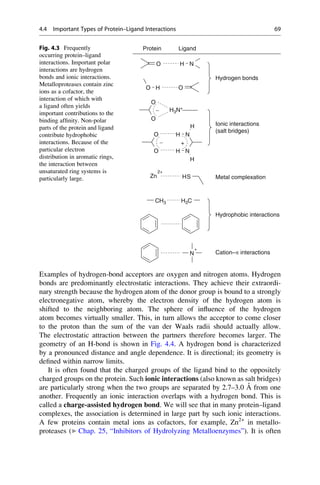
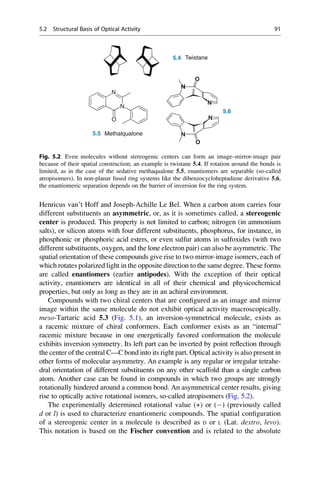
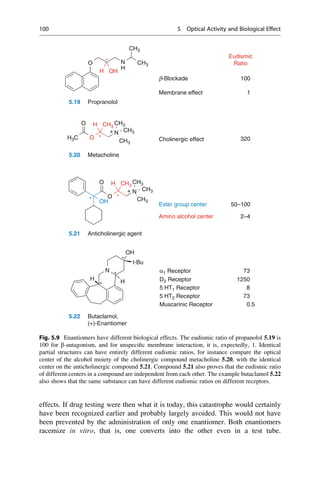
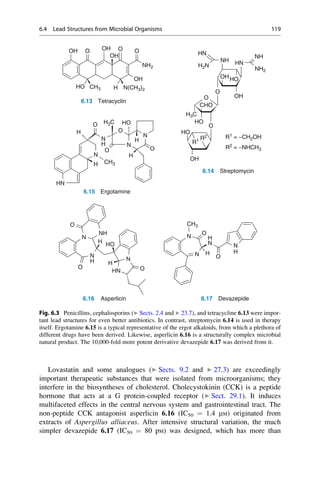
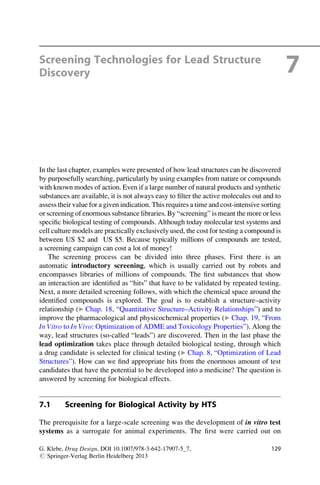
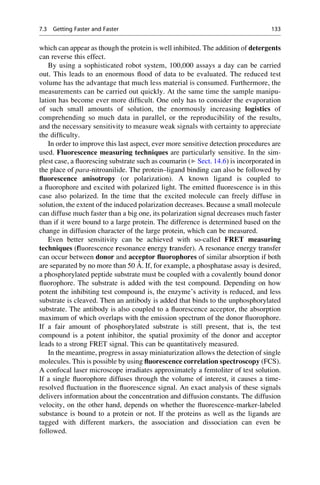
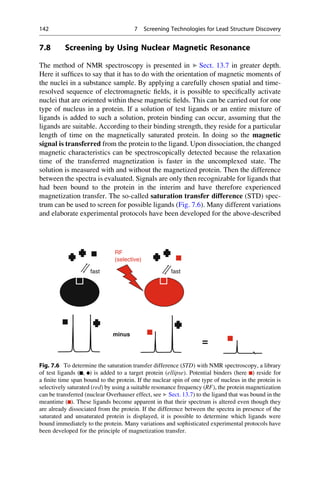
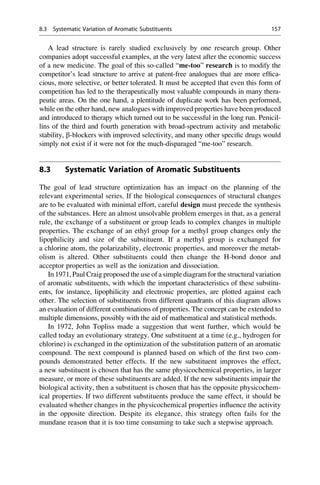
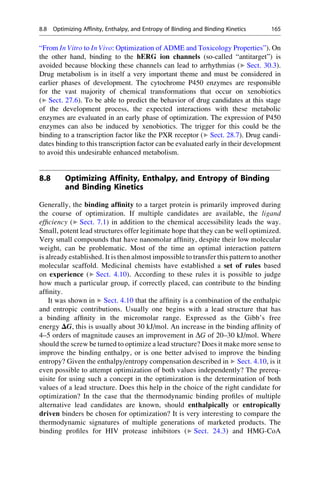
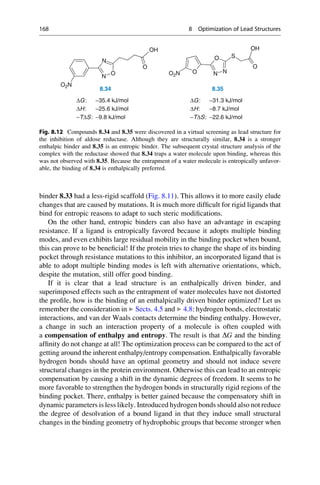
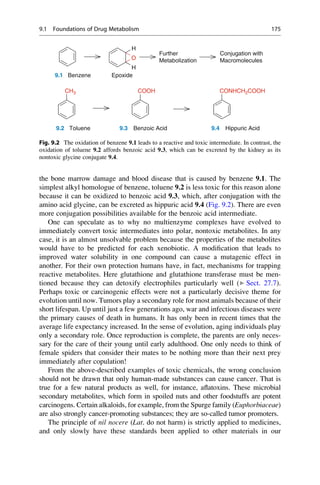
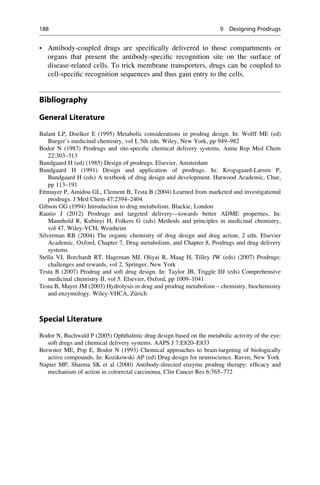
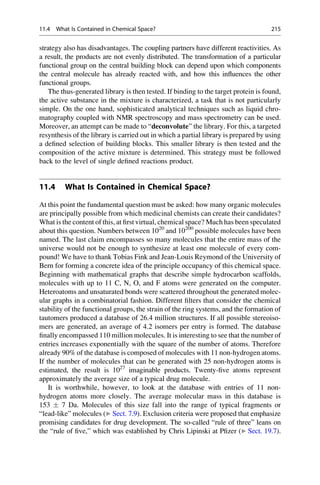
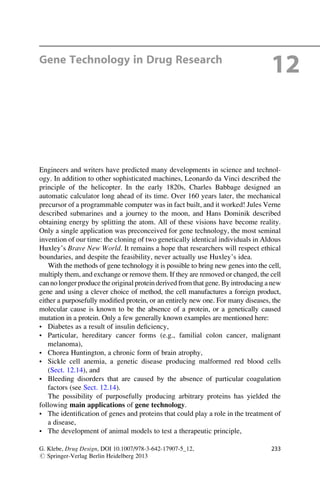
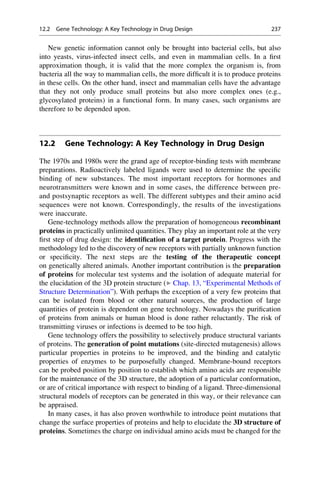
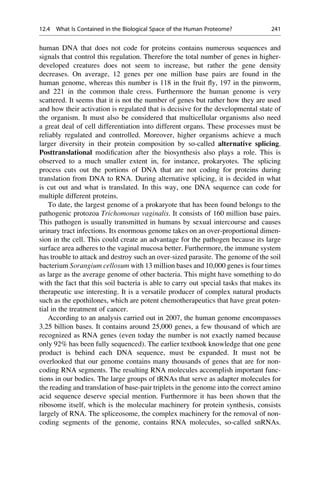
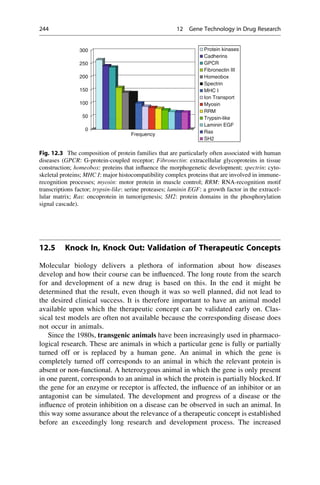
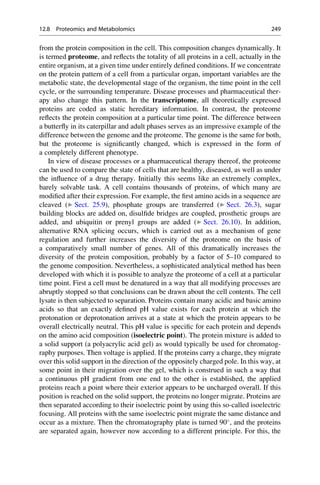
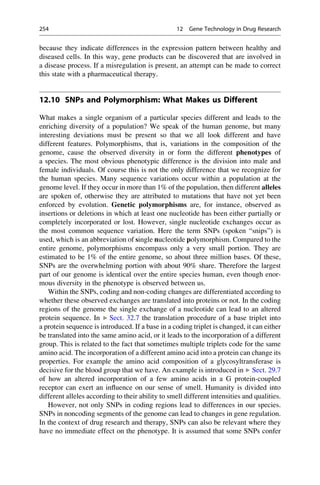
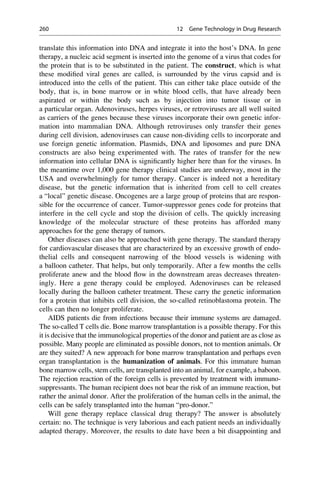
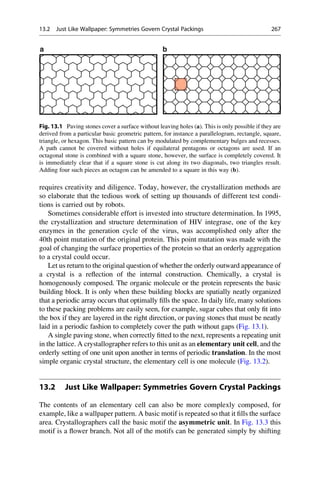
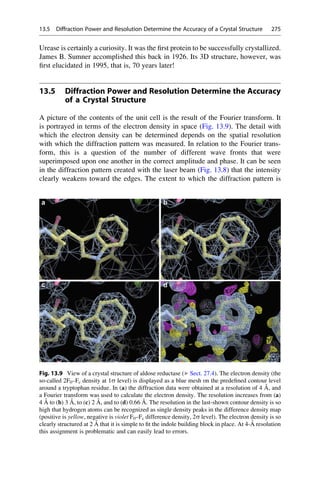
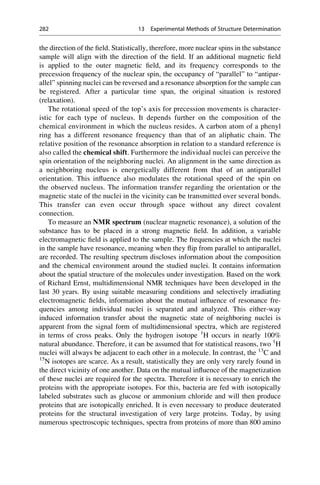
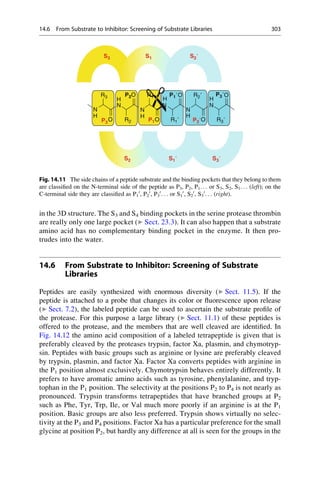
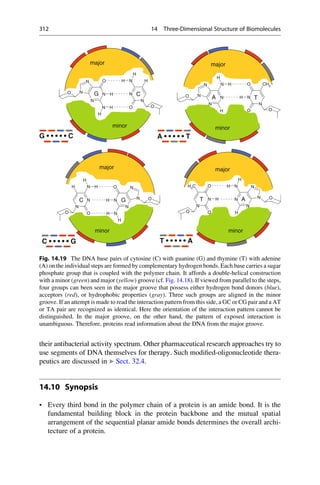
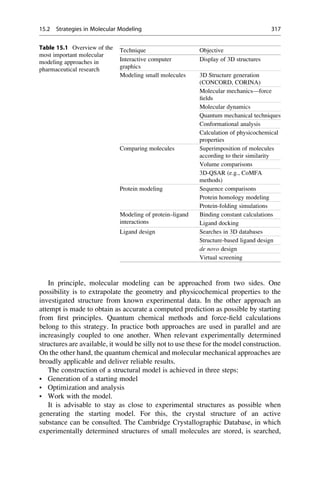
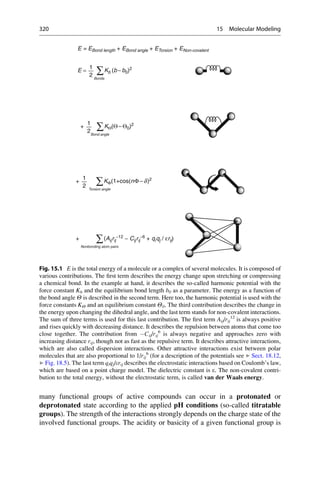
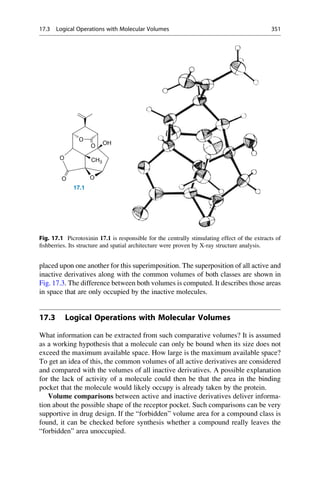
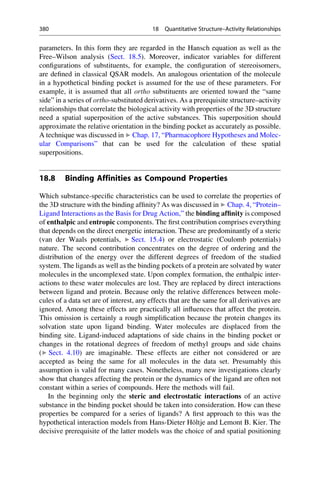
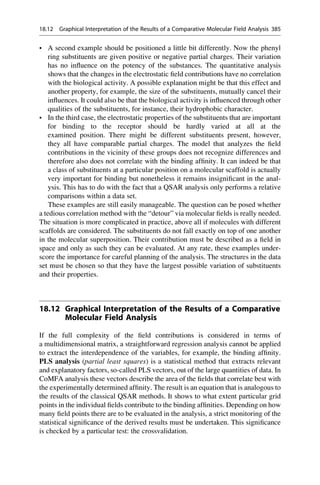
Fig. 5.1 Optical isomerism in tartaric acid. The enantiomers ()-tartaric acid 5.1 (mp.
168–170
C, [a]D
20
¼ 12
) and (+)-tartaric acid 5.2 (mp. 168–170
C, [a]D
20
¼ +12
) cannot be
superimposed upon each other either in the plane of the paper or in 3D space. They have only
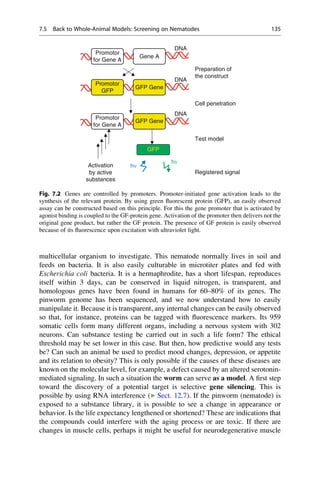
a twofold rotational axis (orange axes) that dissect the central C—C bond. Each mirror image
rotates the plane of polarized light in opposite directions to the other. In contrast, meso-tartaric acid
5.3 (mp. ¼ 140
C) has an inversion center of symmetry (the purple center on the central C—C
bond). Solutions of meso-tartaric acid have no optical activity because the contribution from each
stereogenic center compensates for the other. Racemic tartaric acid (mp. ¼ 206
C, no rotation) is
a 1:1 mixture of both enantiomers of tartaric acid 5.1 and 5.2. Such mixtures are optically inactive
and are called racemates (Lat. racemus, the grape—tartaric acid is found in grapes and wine).
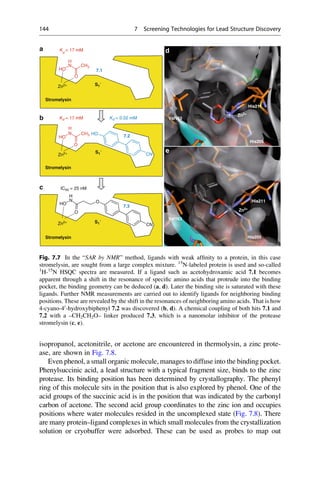
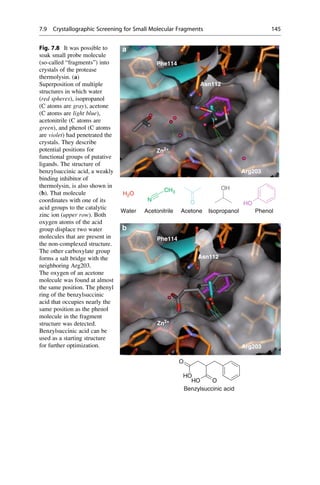
90 5 Optical Activity and Biological Effect](https://image.slidesharecdn.com/drugdesignbook-230205115813-ec25395b/85/Drug-design-book-pdf-107-320.jpg)
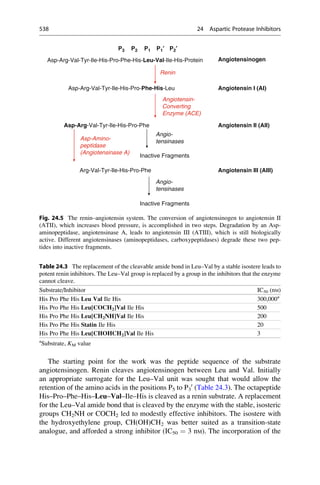
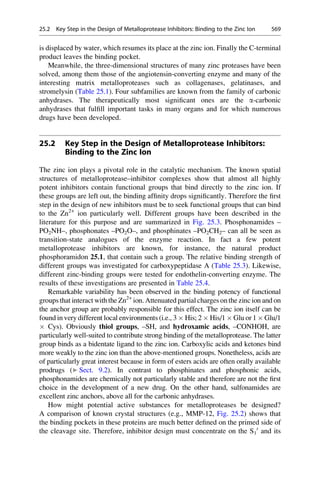
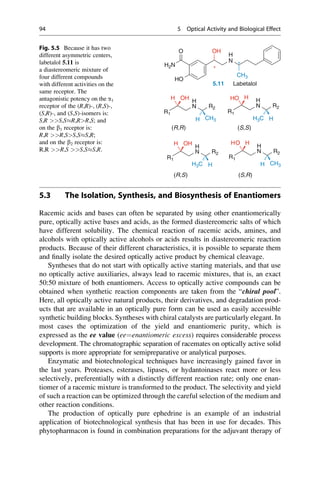
![enantiomers by a factor of 2. For n asymmetric centers, there are 2n
optical isomers.
They occur as 2n1
racemic mixtures because each has two isomers that behave as
mirror images of each other. Diastereomers cannot be superimposed onto each
other by any translation and rotation in space or by generating a mirror image
because the chirality of the stereocenters differs relative to each other. As a result
they have different physicochemical and chemical properties. All pairwise race-
mates of a diastereomeric mixture are present as a 1:1 mixture of enantiomers, but
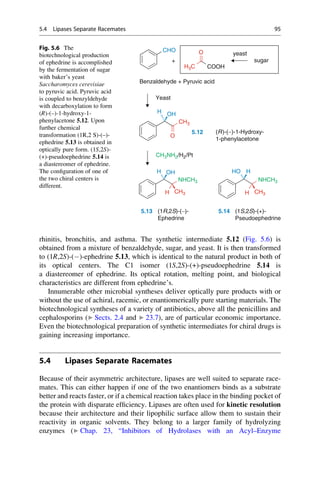
their relative portions in the total composition can vary greatly. Labetalol 5.11
(Fig. 5.5) is just such a diastereomer pair that consists of two racemates, that is, two
enantiomeric pairs. As a mixed antagonist, it affects the a-, b1-, and b2-adrenergic
receptors (cf. ▶ Sect. 29.3). Because of the asymmetric architecture of biological
macromolecules, the individual components of this mixture vary significantly in
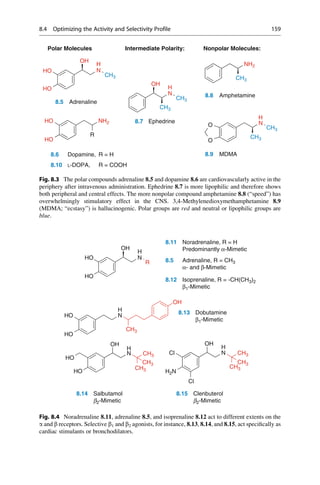
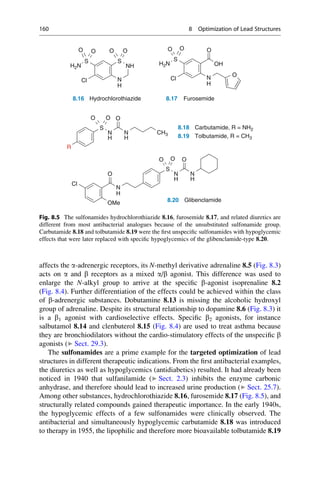
their quantitative and qualitative biological properties (Sect. 5.5, 5.7).
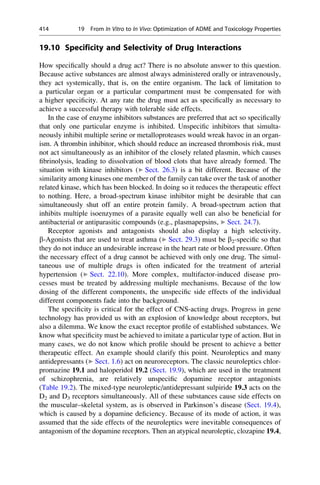
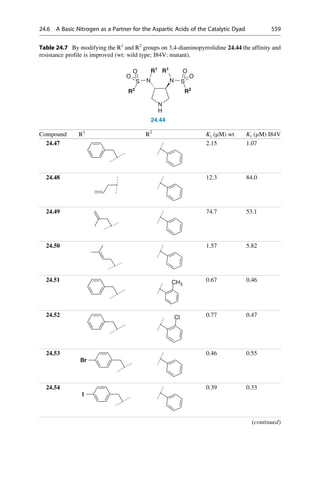
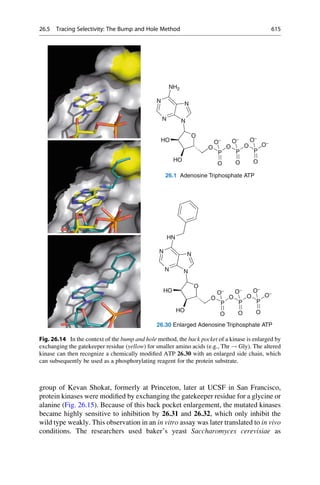
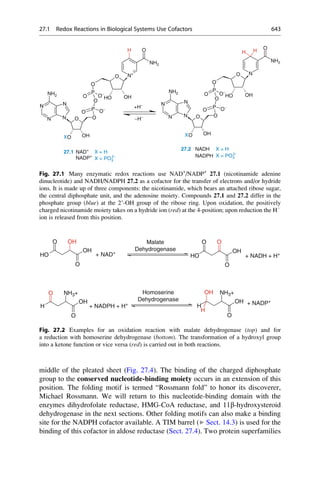
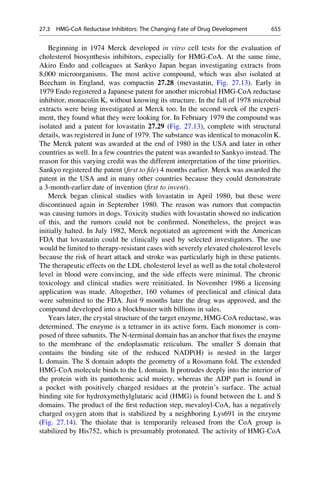
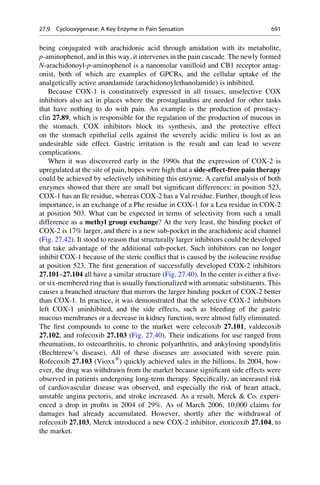
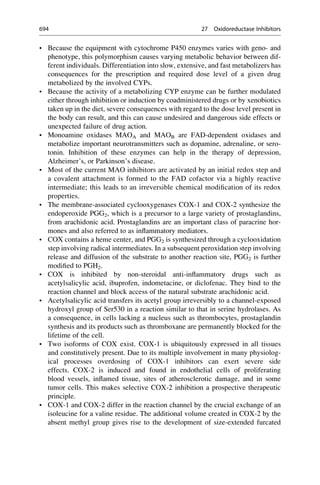
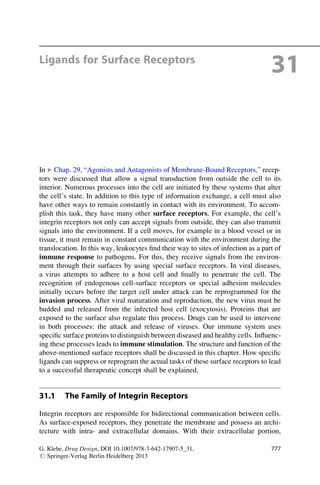
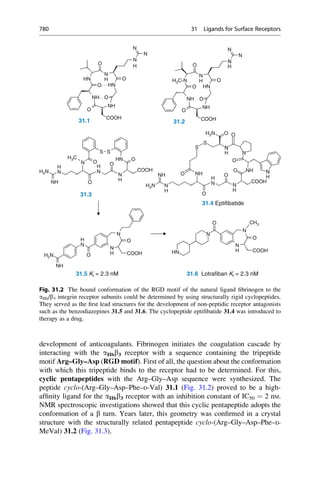
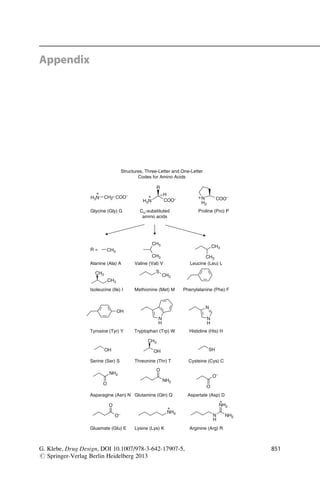
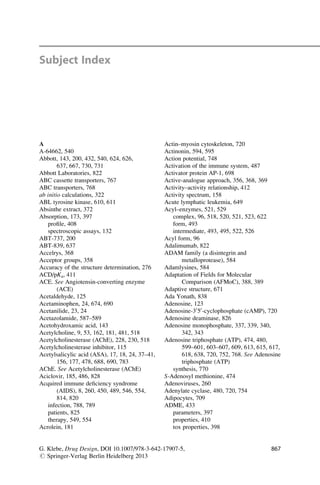
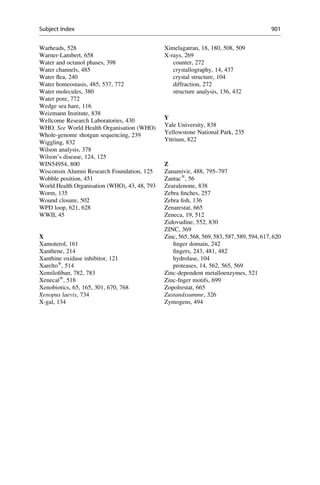
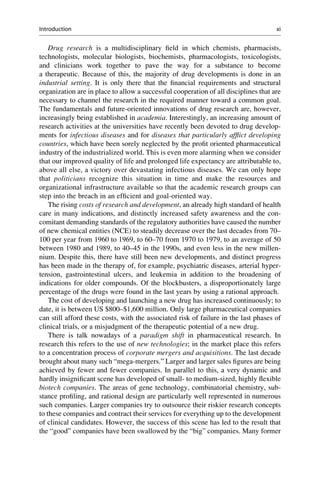
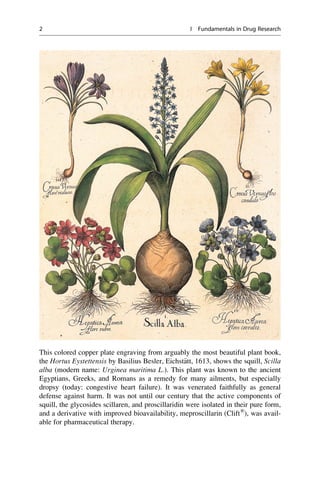
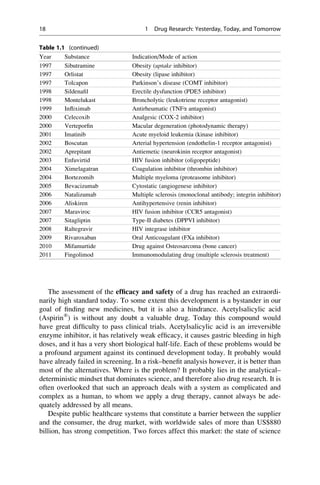
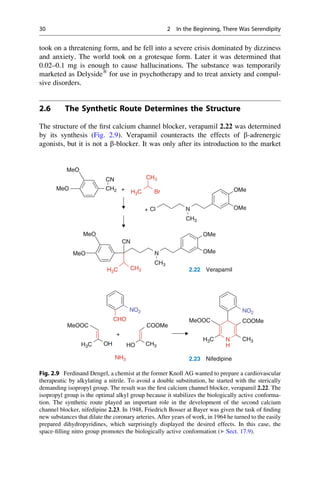
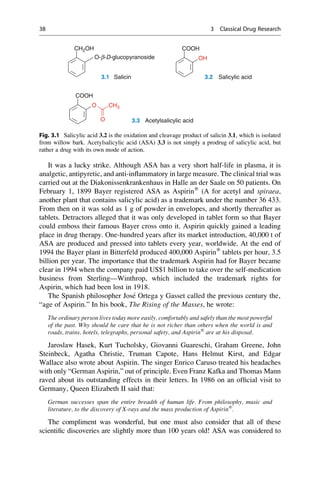
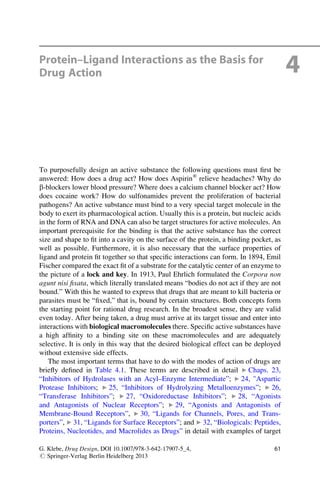
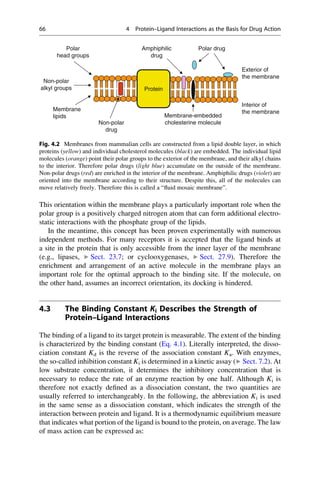
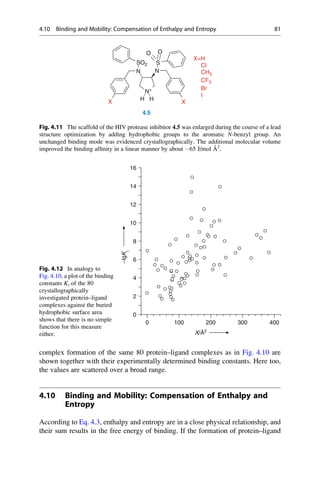
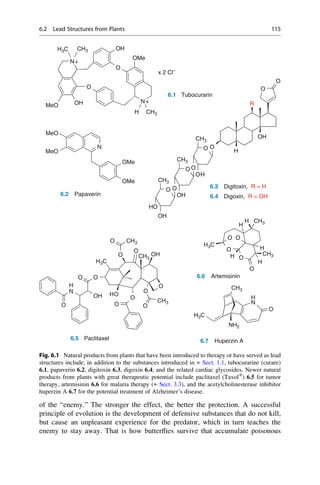
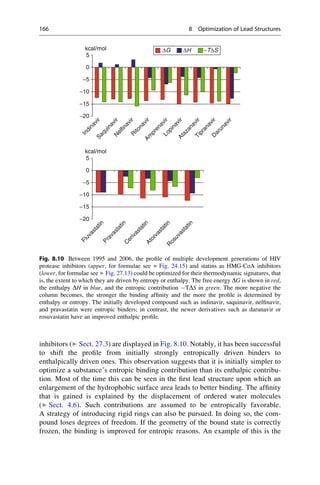
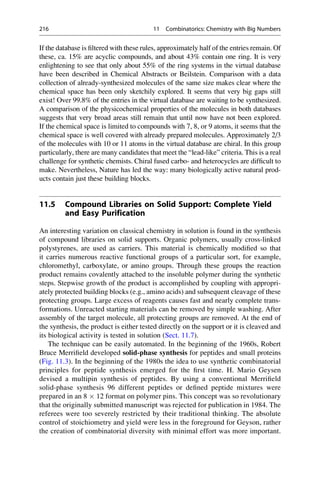
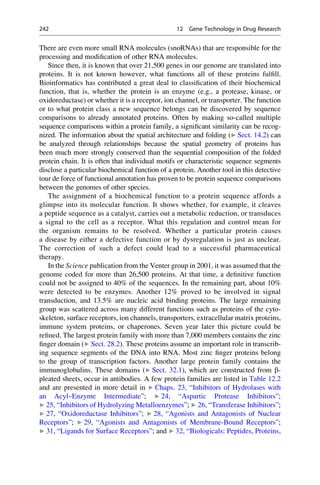
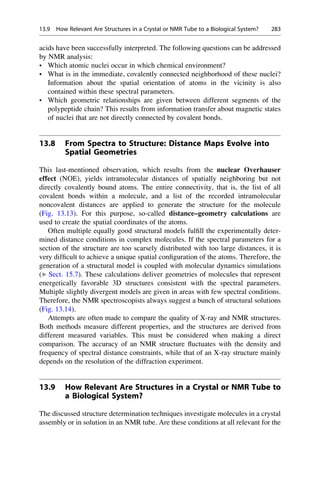
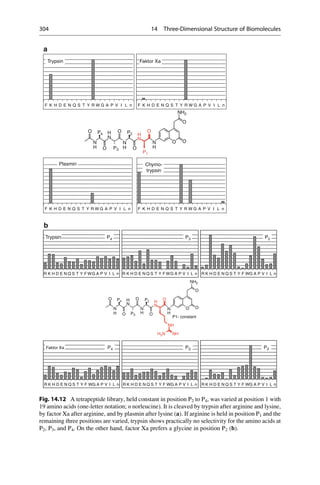
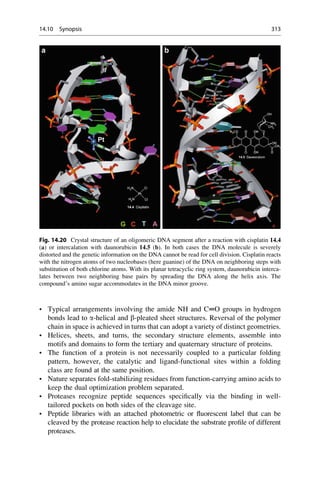
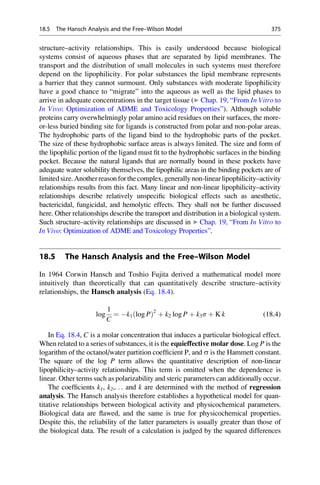
• Large atomic numbers have priority over low ones, (e.g., BrClFONCH)
• Free electron pairs always have the lowest priority
• Larger atomic masses have priority, (e.g., for isotopes DH)
• In case the first sphere is identical, (i.e., C), the next sphere is considered
Cahn–ngold–Prelog Rules
CH3 CH3 CH3
CH3
CH3 CH3
H H H
H
H H
C[C+C+C] C[C+C+H] C[C+H+H] C[H+H+H]
F
CH3 CH3 CH3 CH3 CH3
CH3
CH3
CH3
CH3
CH3
CH3
F OH OH
H
NH2 NH2
H
H
H
• Multiple bonds are considered as multiple single bonds, e.g., aldehyde
CHO = C (O+O+H)CH2OH = (O+H+H)
• If the substituents are chiral, the RS and R,RRS and S,SS,R
• In the case of differently configurated double bonds ZE
(Z = zusammen = together and E = entgegen = apart for the configuration of double bonds)
H H H
CHO
H
HO CH2OH
CHO
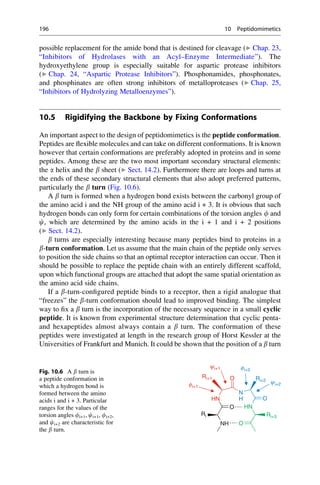
H
HOH2C OH
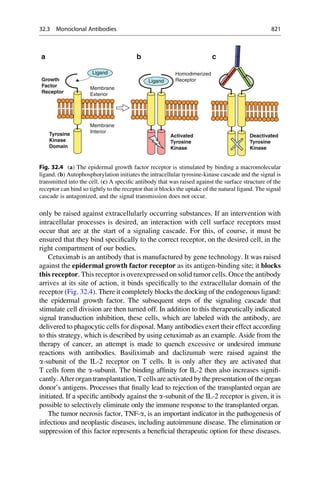
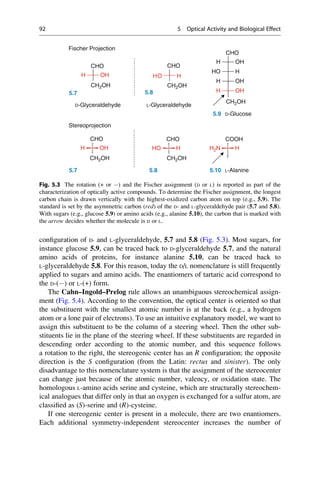
(R)-Glyceraldehyde (S)-Glyceraldehyde
5.7 5.8
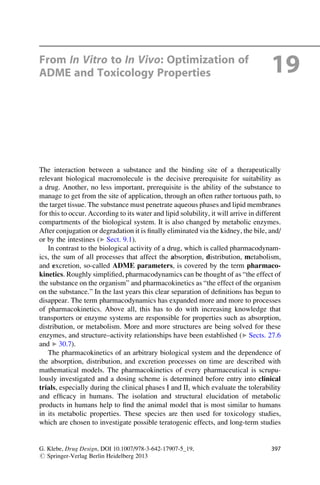
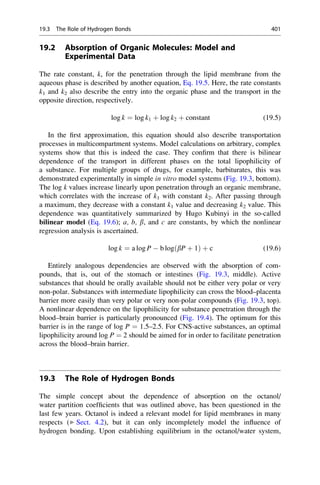
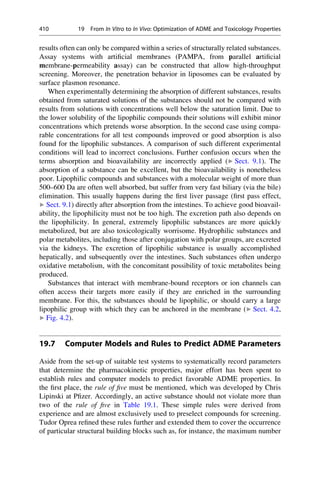
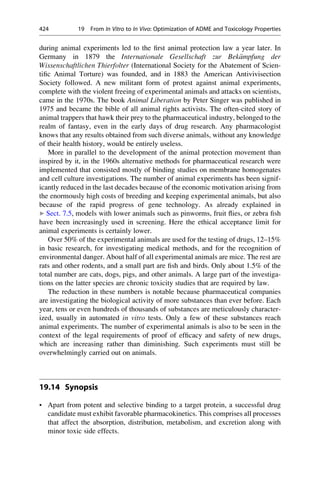
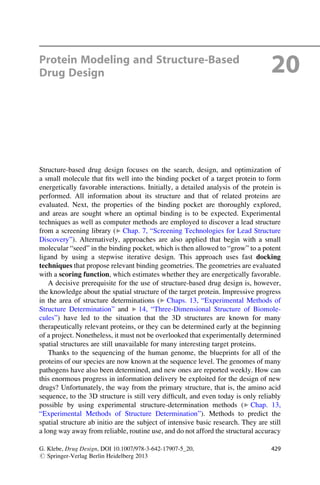
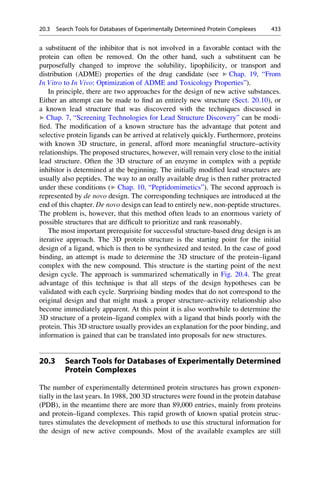
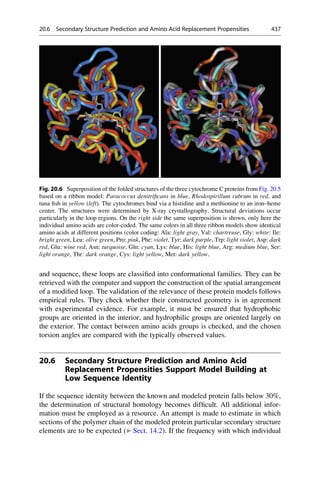
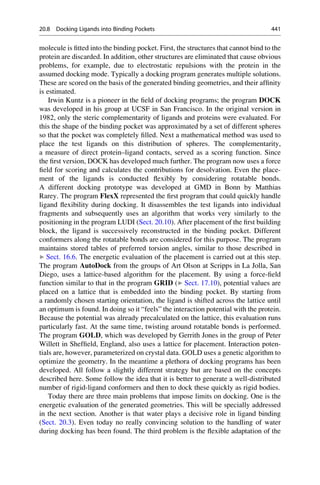
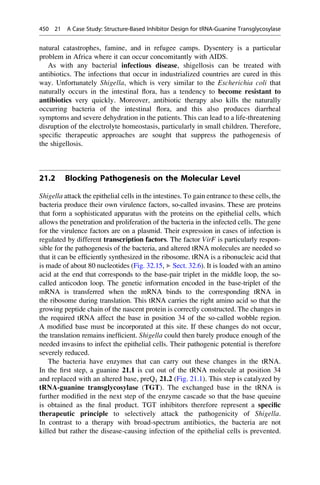
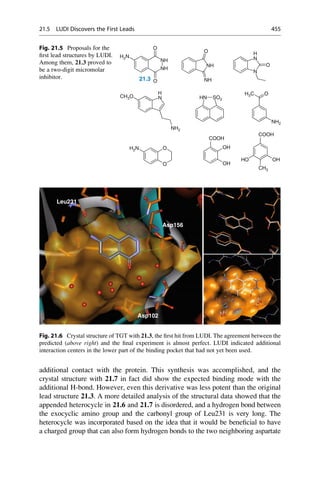
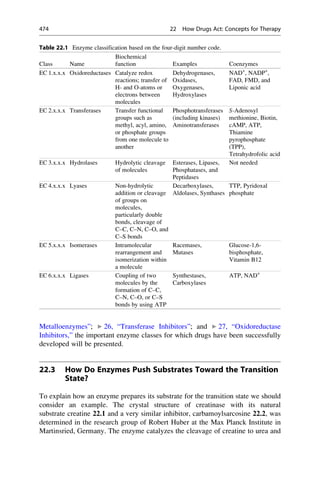
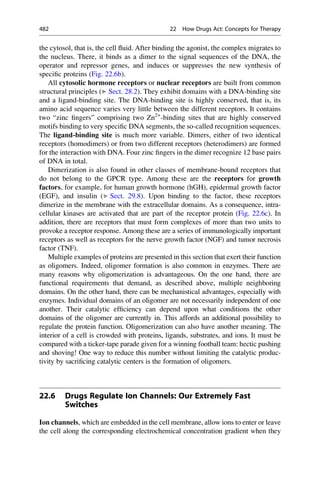
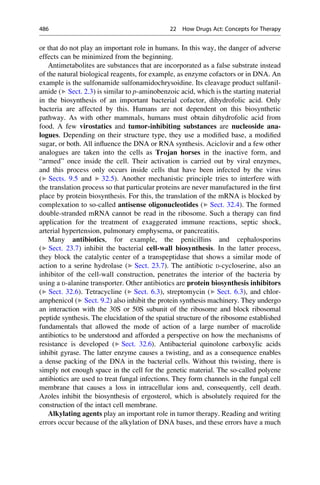
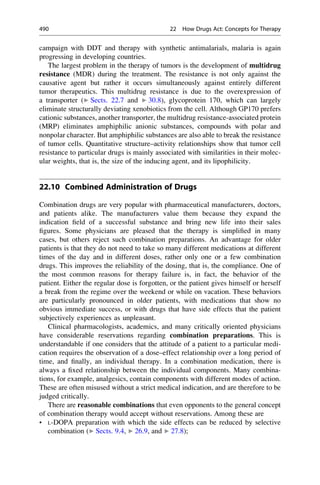
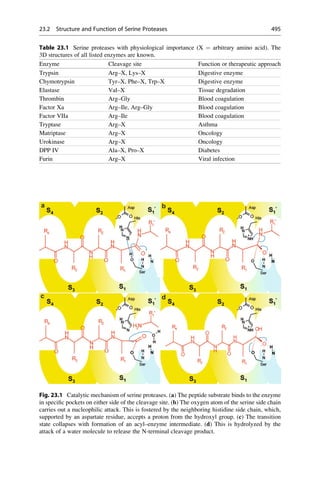
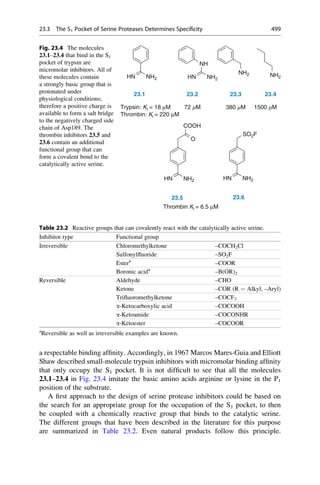
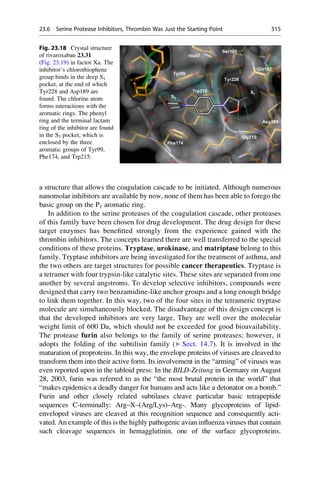
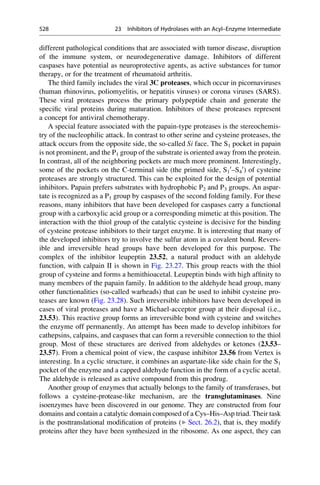
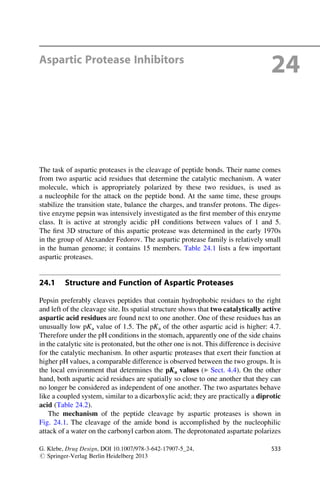
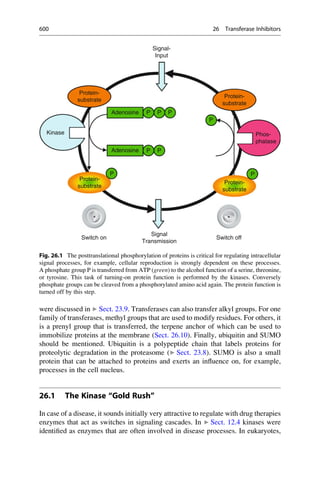
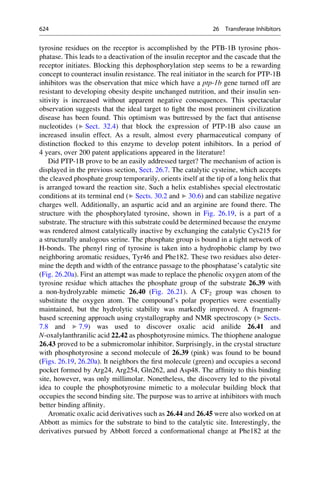
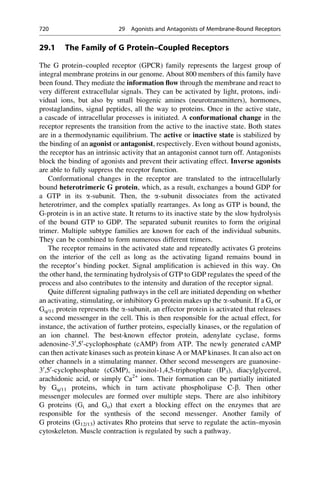
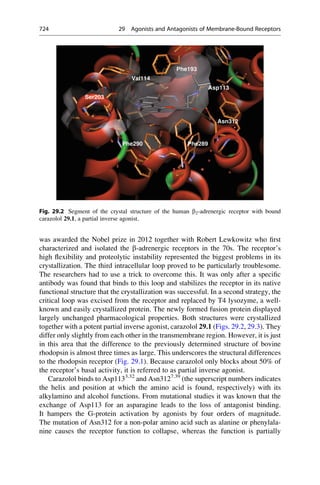
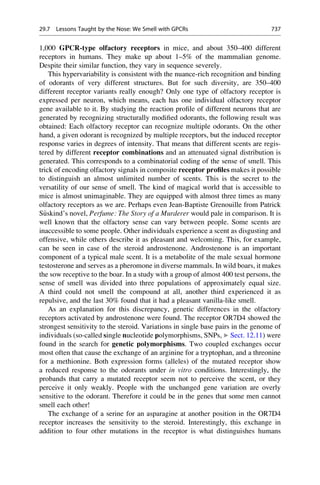
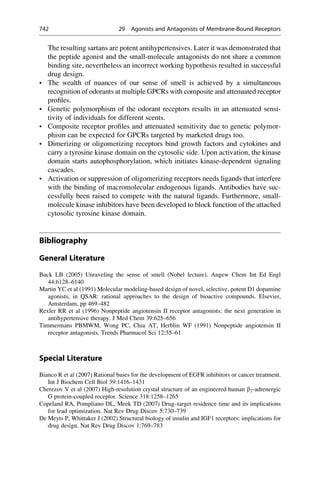
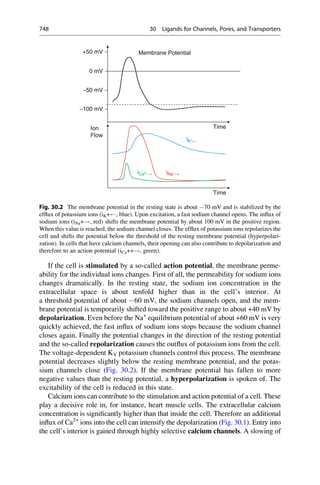
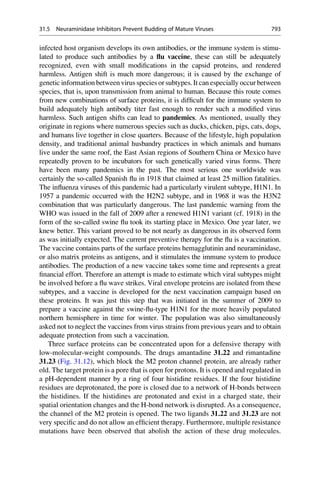
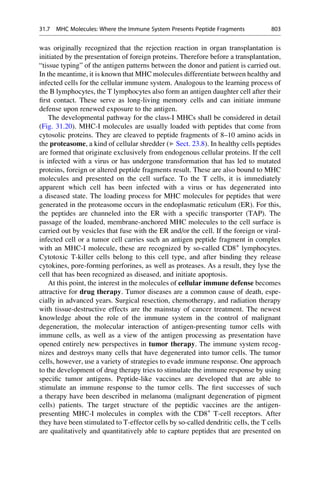
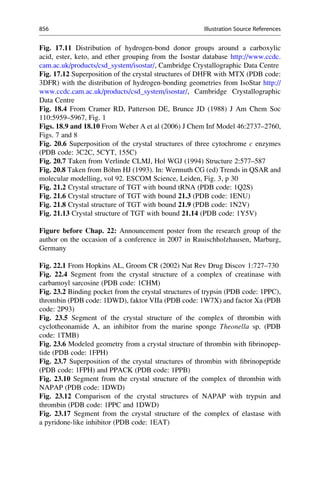
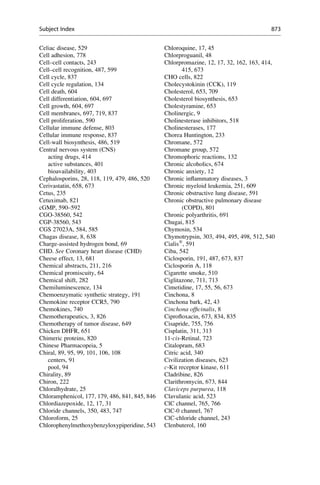
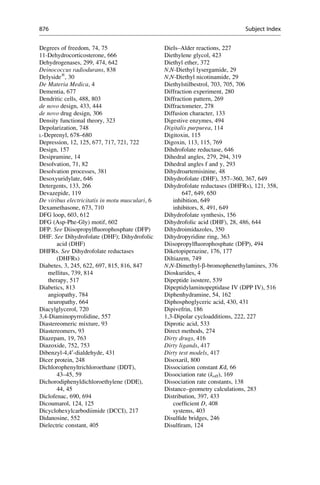
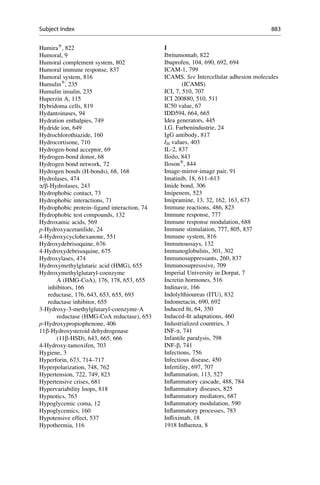
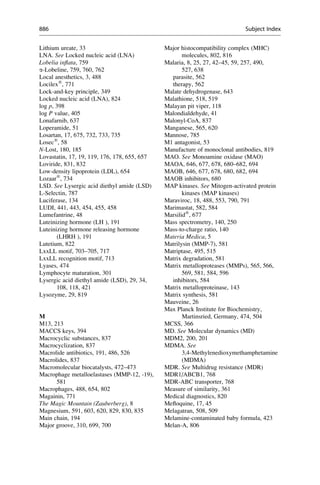
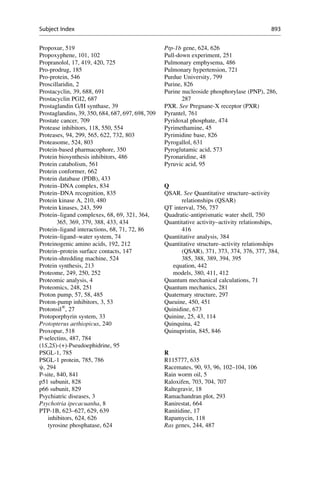
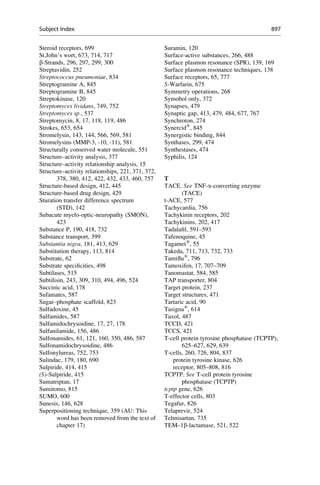
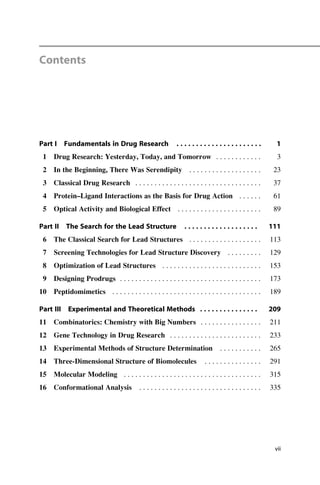
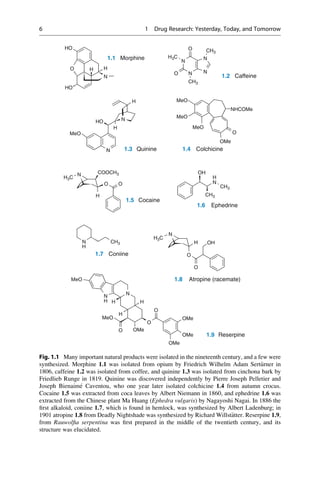
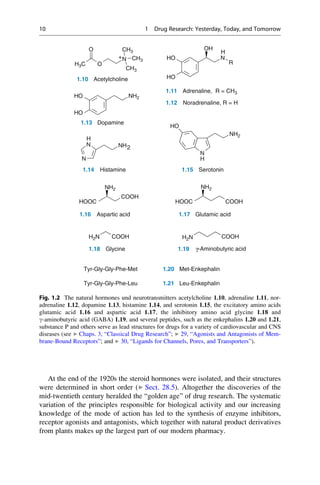
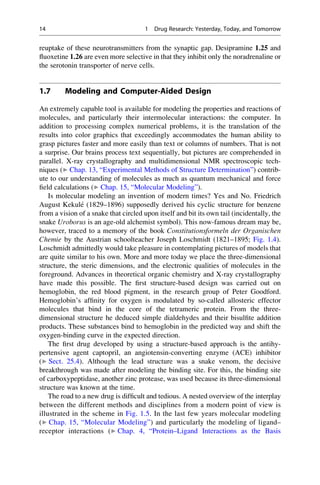
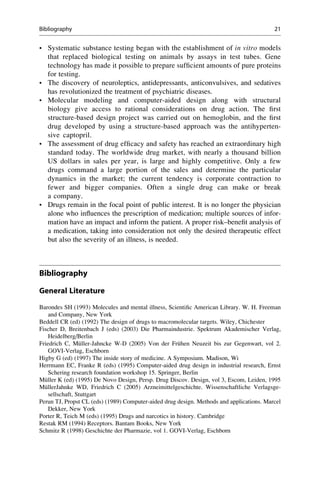
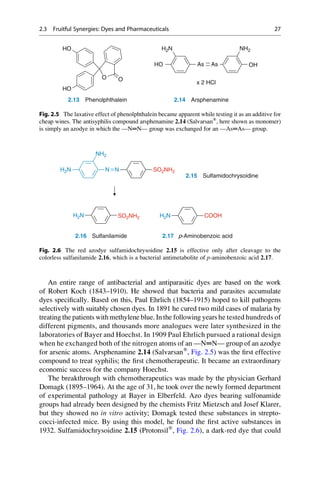
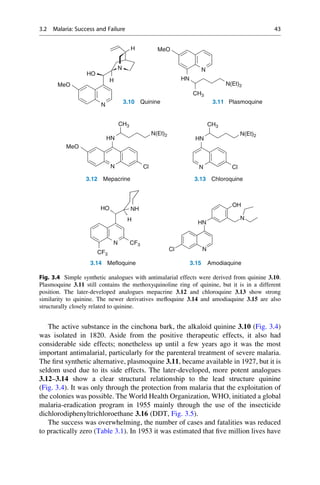
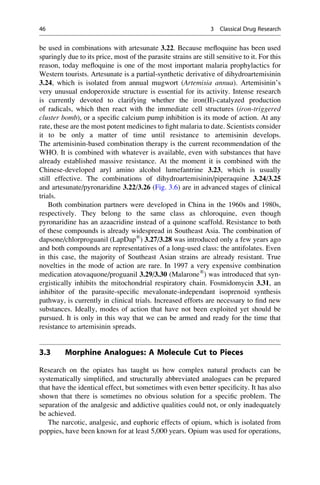
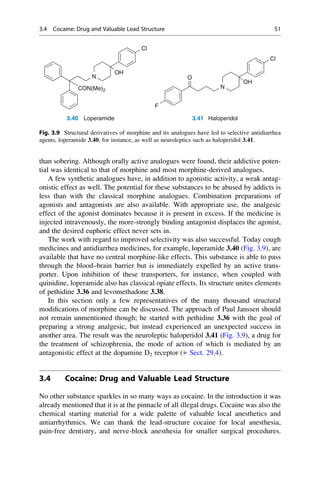
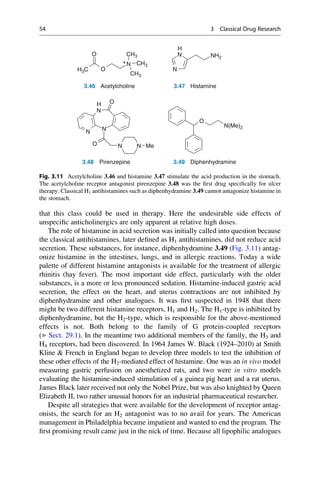
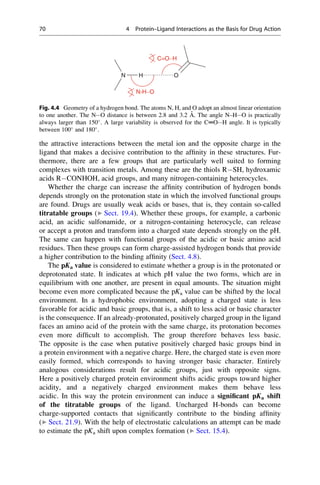
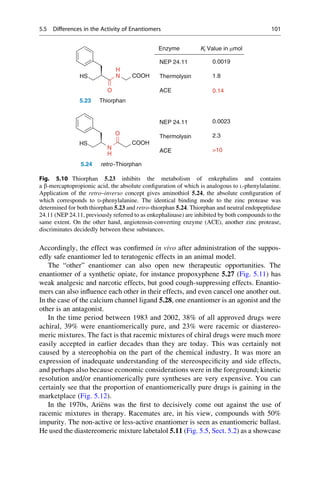
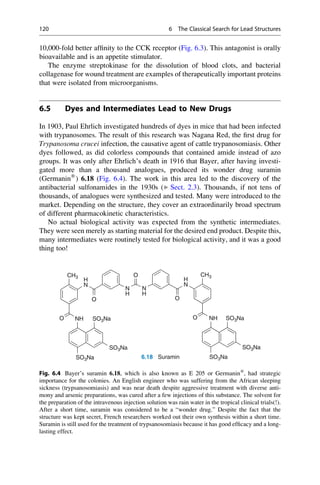
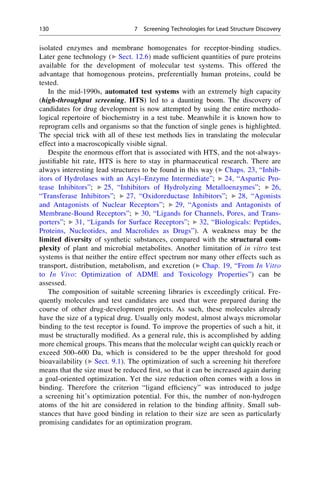
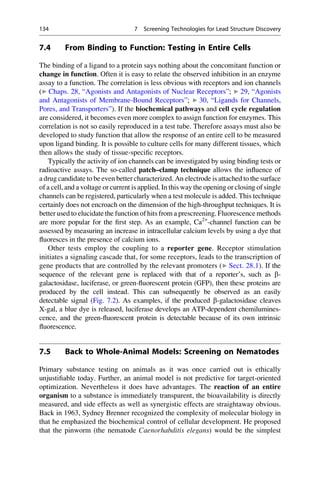
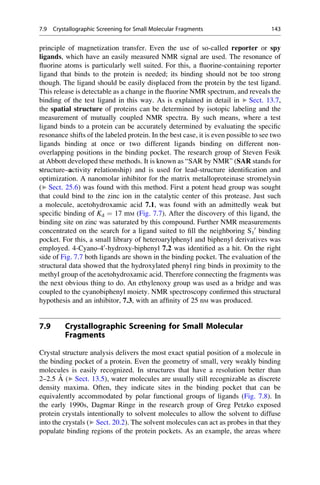
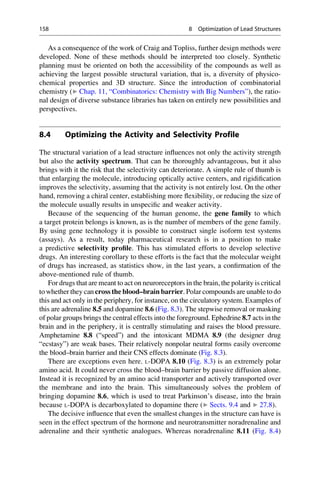
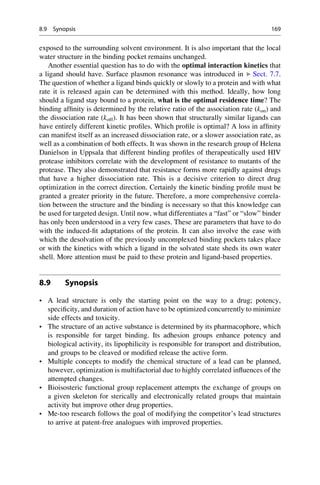
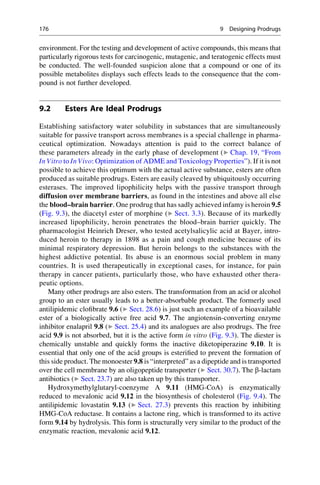
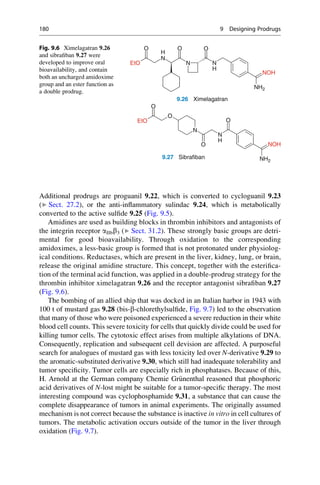
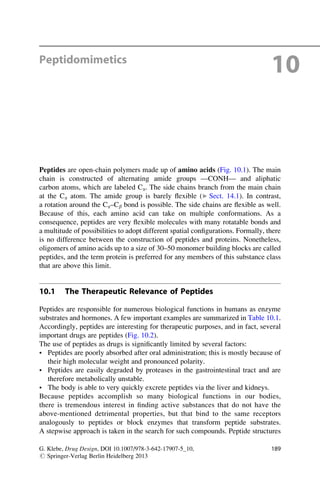
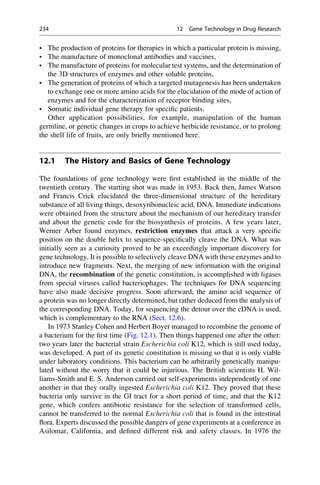
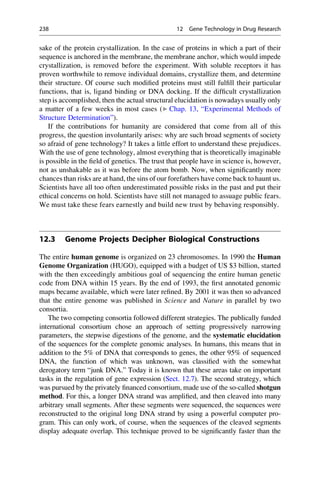
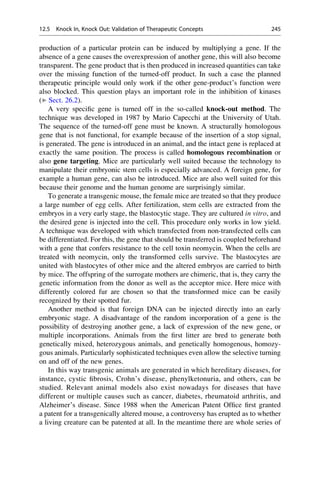
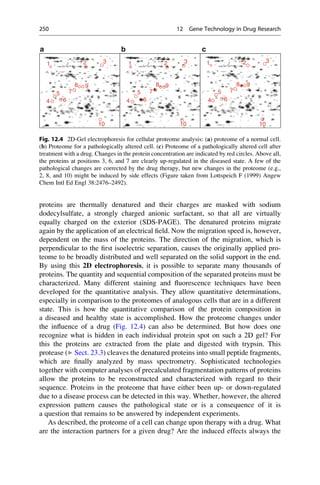
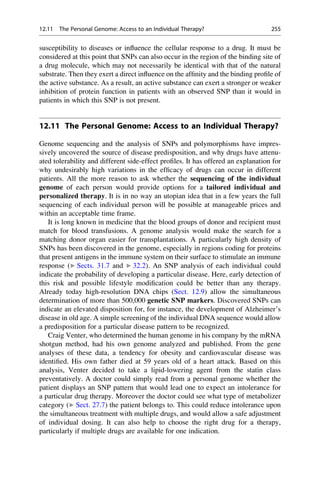
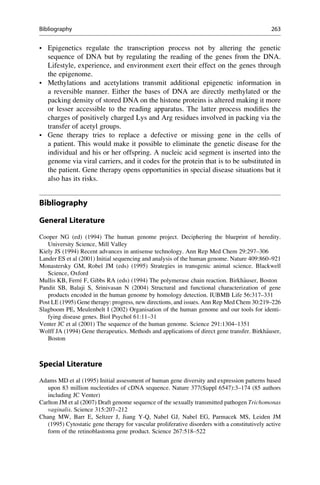
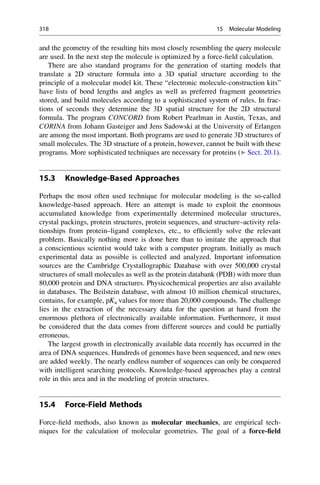
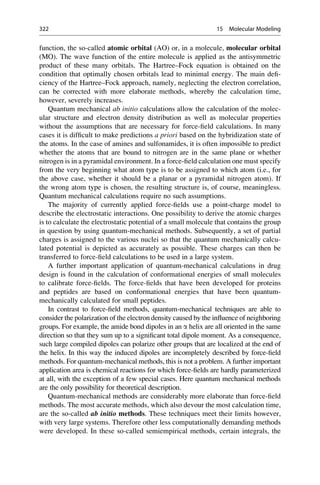
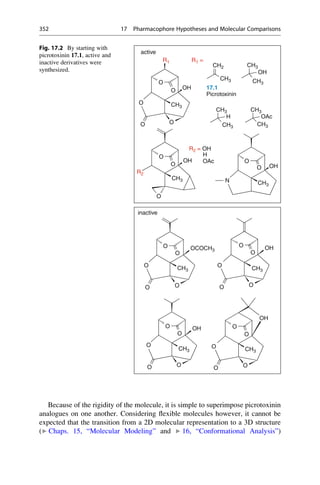
Fig. 5.4 The R/S nomenclature that was proposed by R. S. Cahn, C. K. Ingold, and V. Prelog is
unambiguous. Priority rules for each of the four different substituents on the tetrahedral
stereogenic center were established. The substituent with the lowest priority is placed in the
back, and the direction of remaining substituents determine the direction of rotation by decreasing
priority.
5.2 Structural Basis of Optical Activity 93](https://image.slidesharecdn.com/drugdesignbook-230205115813-ec25395b/85/Drug-design-book-pdf-110-320.jpg)


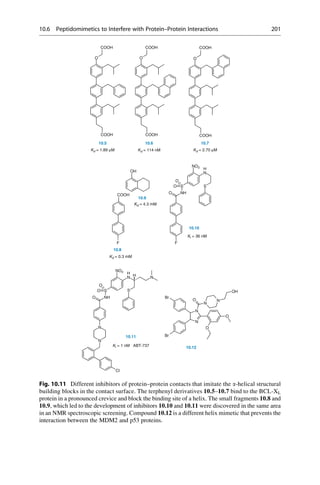


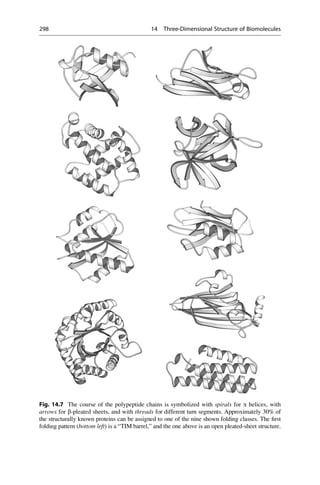
![Linus Pauling was the first to propose the a helix as a secondary structure in
proteins.
The key to Linus’s success was his reliance on the simple laws of structural chemistry. The
a-helix had not been found by only staring at X-ray pictures. The essential trick, instead,
was to ask which atoms like to sit next to each another. In place of pencil and paper, the
main working tools for this work were a set of molecular models superficially resembling
the toys of pre-school children.
With these sentences the Nobel prize winner James Watson described the
approach of Pauling in his book The Double Helix. Pauling’s success was also
based upon well-founded proficiency in theoretical chemistry. That is how Pauling
knew that an amide bond is stiff and flat, whereas his rivals, William Bragg, Max
Perutz, and John Kendrew, were of the misconception that they would be flexible.
James Watson and Francis Crick went the same way as Pauling in the search for the
DNA structure:
We could thus see no reason why we should not solve the DNA problem in the same way [as
Pauling]. All we had to do was build a set of molecular models and begin to play—with luck
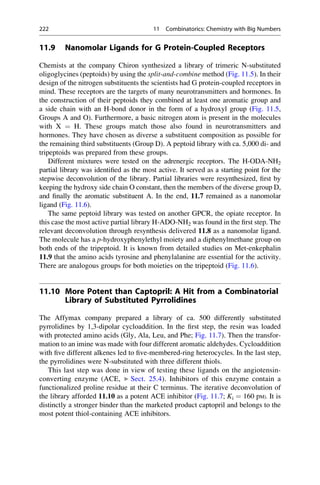
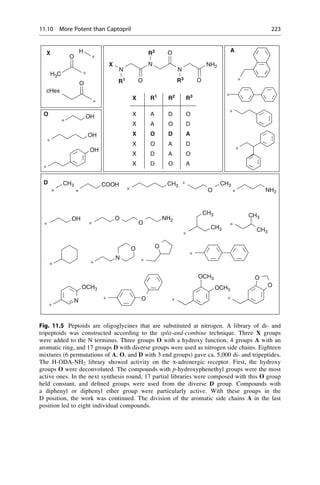
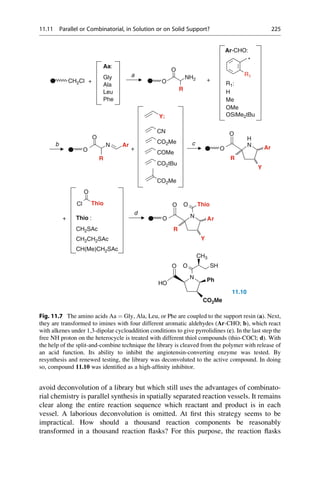
the structure would be a helix.
Working with molecular models must not have been pure pleasure back then.
In one place in the book, for example, he writes:
Our first minutes with the models, though, were not joyous. Even though only about fifteen
atoms were involved, they kept falling out of the awkward pincers set up to hold them the
correct distance apart.
Later other problems were talked about:
No serious models were built, however, for several days. Not only did we lack the purine
and pyrimidine components, but we had never had the shop put together any phosphorus
atoms. Our machinist needed at least three days merely to turn out the simplest phosphorus
atoms. . .
Based on this background the achievement of Watson and Crick seems even
more impressive. They were awarded the Nobel Prize in 1962 for the elucidation of
the double-helix structure of DNA. This example should underscore the importance
of models in science. To end with a word from Francis Crick: “A good model is
worth its weight in gold.”
15.2 Strategies in Molecular Modeling
In contrast to the 1950s and 1960s, computers are available today with impressive
graphical performance and high computing speed. Accordingly, programs are
available for working with molecular models. The new field of molecular model-
ing has been established. This term encompasses the display and manipulation of
realistic three-dimensional molecular structures along with the calculation of their
physicochemical properties. The most important methods that are employed in the
context of molecular modeling are summarized in Table 15.1.
316 15 Molecular Modeling](https://image.slidesharecdn.com/drugdesignbook-230205115813-ec25395b/85/Drug-design-book-pdf-333-320.jpg)

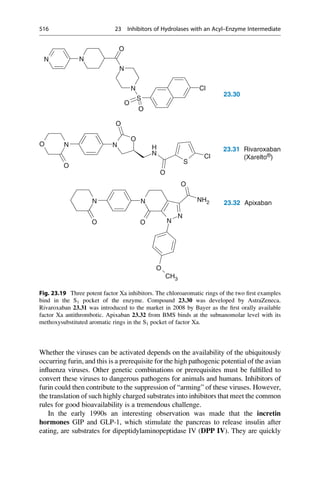
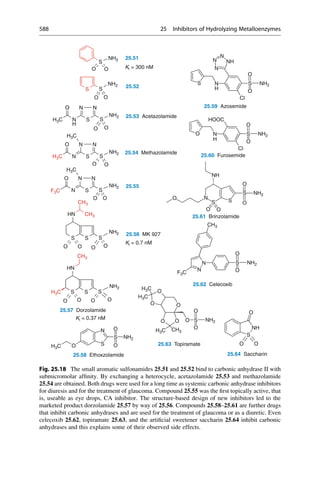
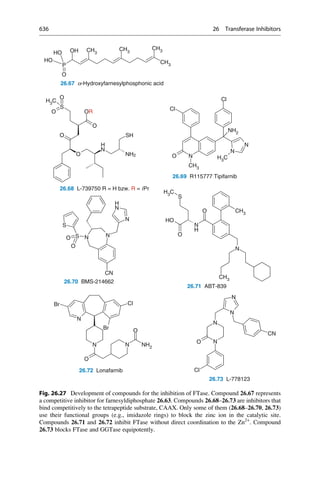
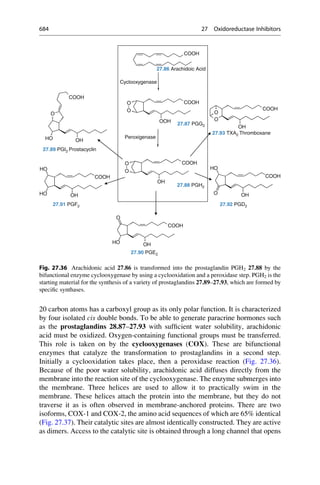
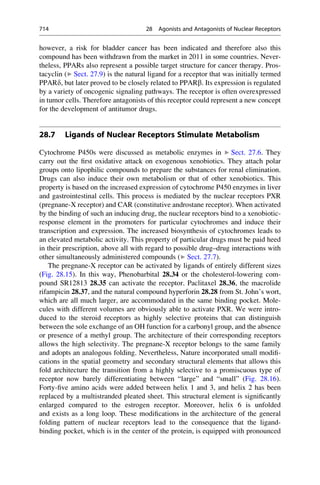
![▶ 25, “Inhibitors of Hydrolyzing Metalloenzymes”; ▶ 26, “Transferase Inhibitors”;
▶ 27, “Oxidoreductase Inhibitors”; ▶ 28, “Agonists and Antagonists of Nuclear
Receptors”; ▶ 29, “Agonists and Antagonists of Membrane-Bound Receptors”;
▶ 30, “Ligands for Channels, Pores, and Transporters”; ▶ 31, “Ligands for Surface
Receptors”; and ▶ 32, “Biologicals: Peptides, Proteins, Nucleotides, and
Macrolides as Drugs” how models, built on the basis of crystal structures of
protein–ligand complexes, afford important contributions to drug design, especially
in the preselection of possible molecular candidates for synthesis.
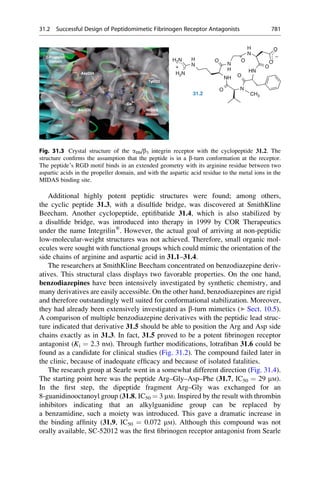
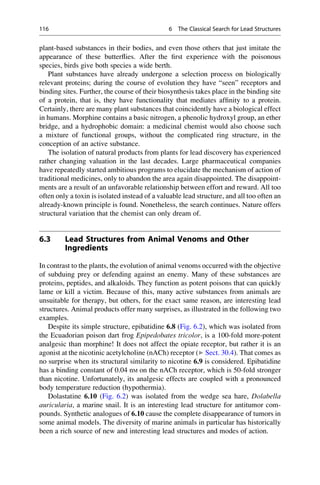
The term “simulation” describes the calculations with models. Multiple options
or variable combinations can be quickly evaluated on the computer for a given
mathematical model. Such investigations can contribute considerably to a better
understanding of the system. Next to theory and experiment, computer simulations
have been called the third pillar of exact science.
Number of Snapshots
Number
of
Snapshots
2D RMS Diagram
rmsd
[Å]
600
500
400
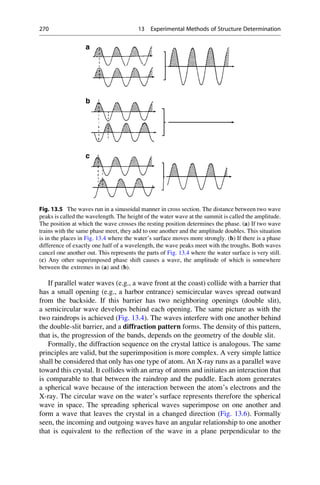
300
300 400 500 600
200
200
100
100
0
0
0
0.3
0.6
0.9
1.2
1.5
1.8
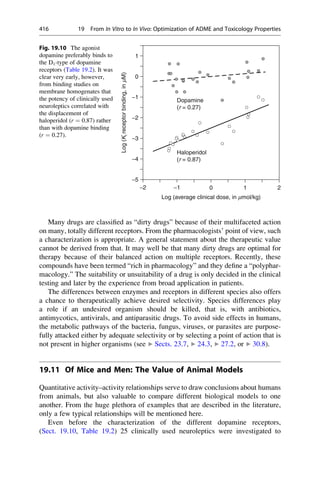
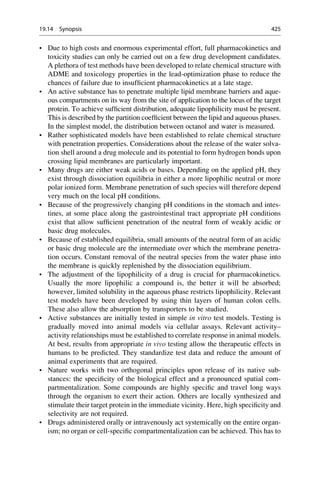
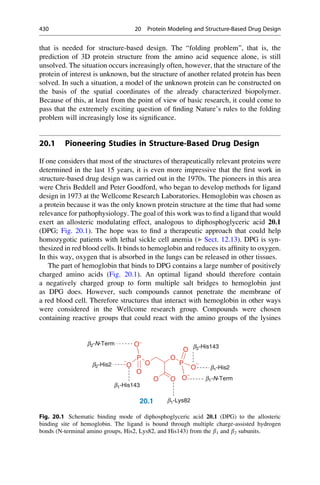
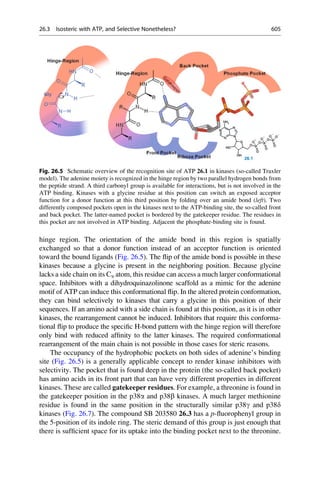
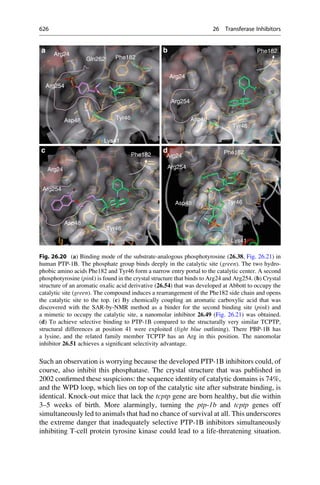
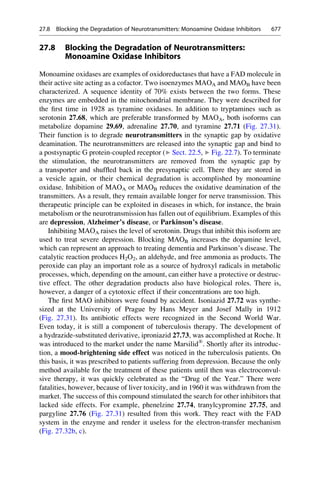
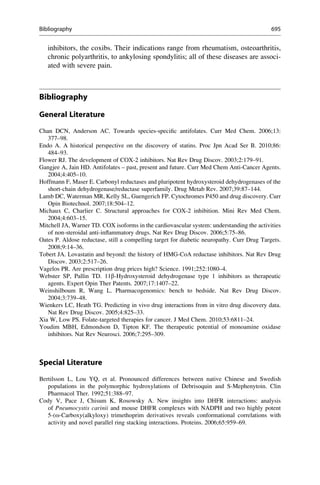
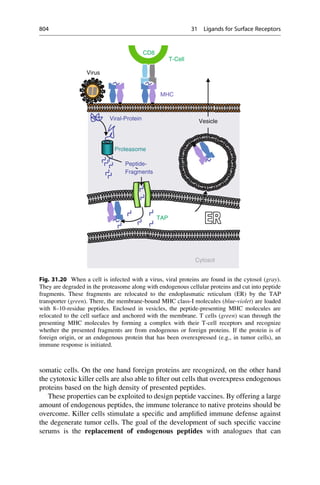
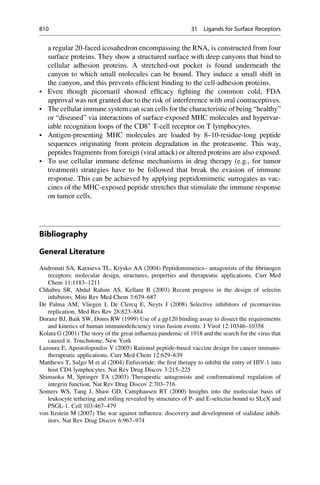
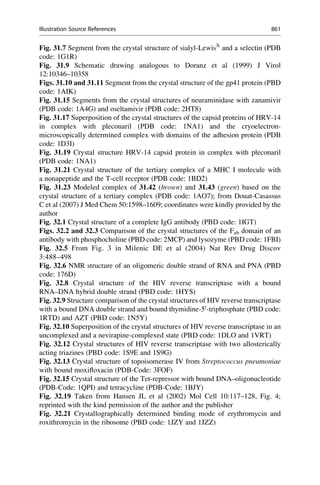
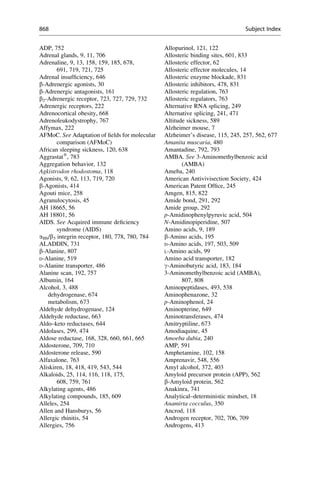
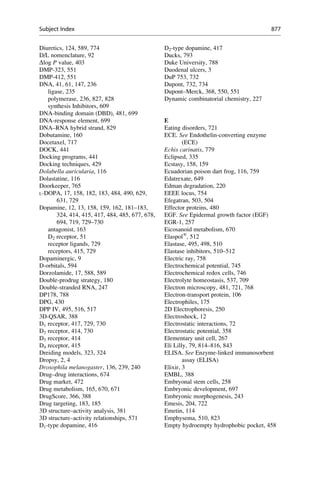
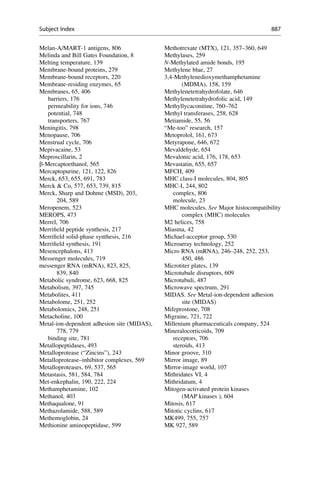
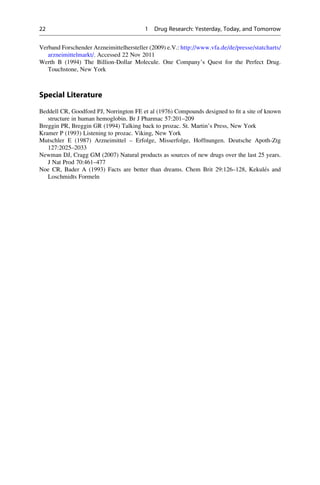
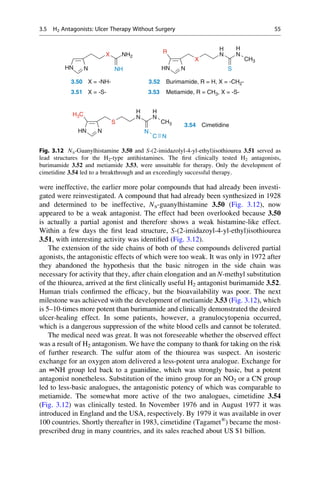
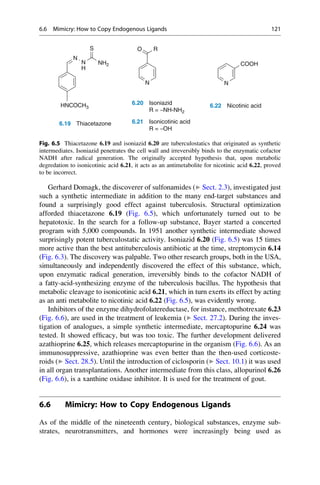
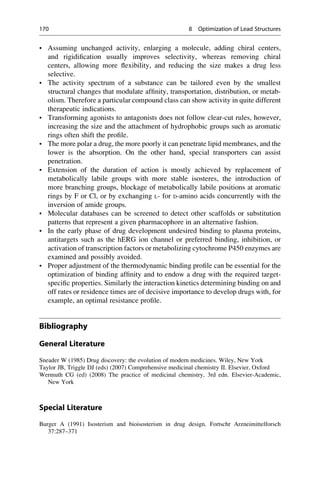
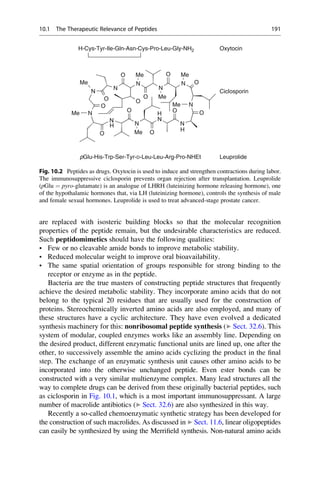
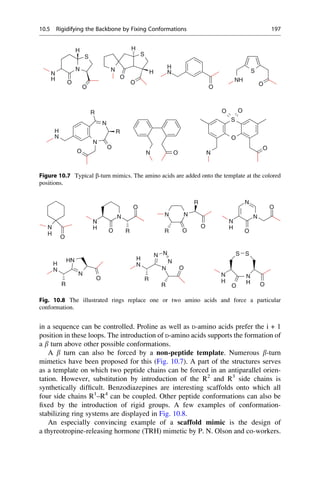
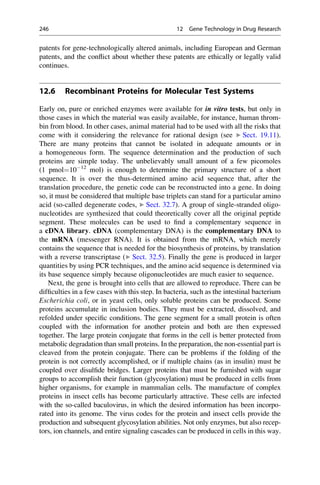
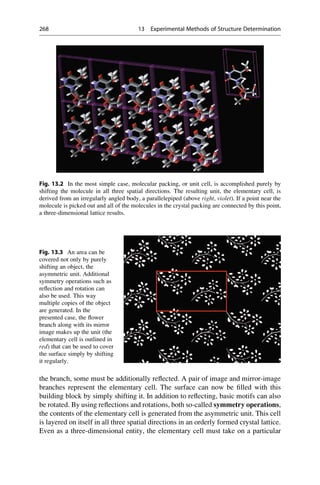
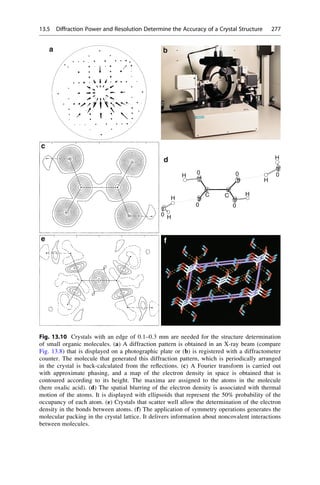
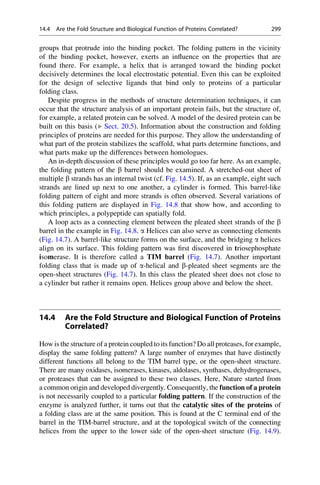
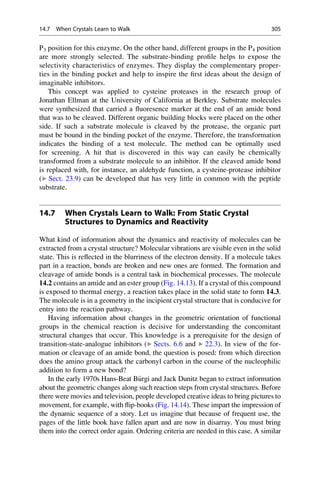
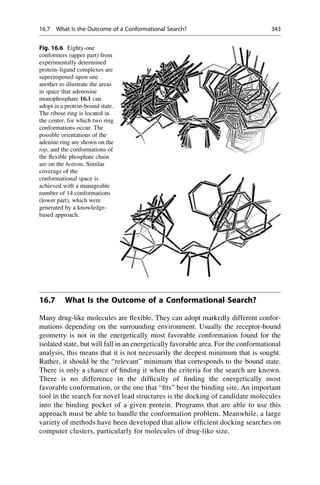
Fig. 15.5 The development with time of the spatial deviations of various snapshots along the
simulation trajectory are visualized on this map. Large deviations are color-coded with red, medium-
sized deviations with green, and small deviations are colored blue. Green delineated square areas are
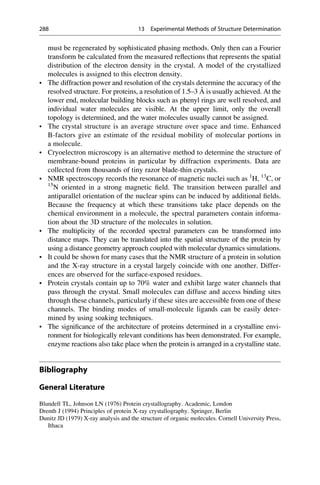
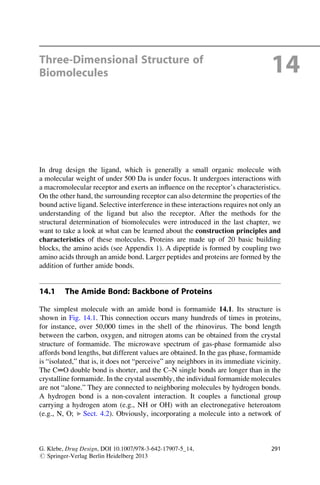
recognizable along the main diagonal. There the complex spends time near a parent conformation.
The transition to the next square represents a flip to a new geometry. If sectors outside the main
diagonal are colored increasingly red, the geometry deviates strongly from the previously adopted
conformation. If an area outside the diagonal is reached that is green, the newly adopted geometry is
not very different from a state that the system reached one time. With such a map it is possible to see
which of the many parent conformations a complex swings between.
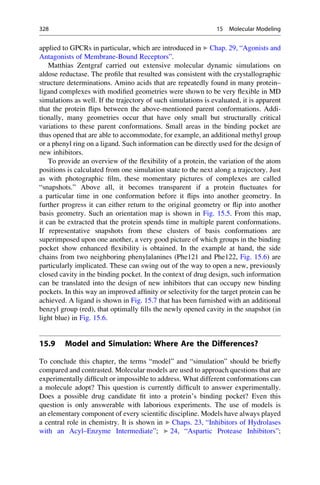
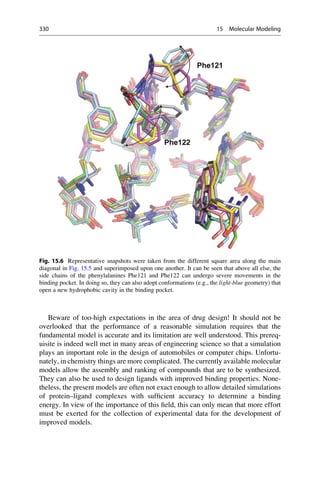
15.9 Model and Simulation: Where Are the Differences? 329](https://image.slidesharecdn.com/drugdesignbook-230205115813-ec25395b/85/Drug-design-book-pdf-346-320.jpg)


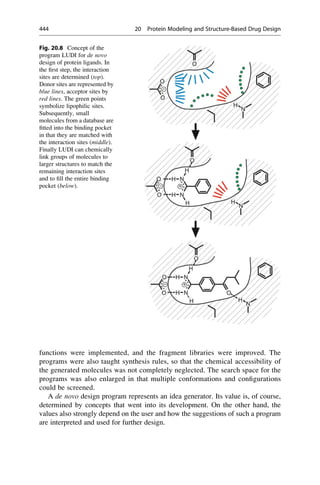
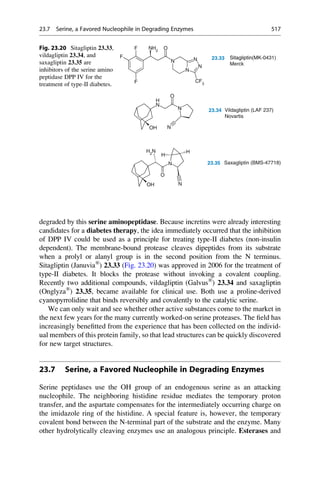
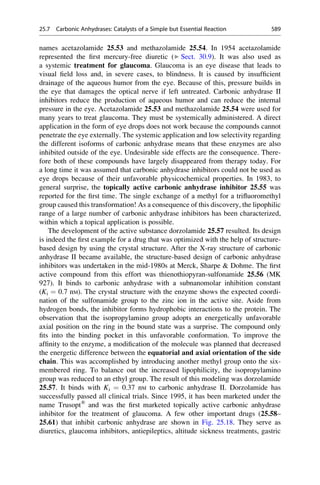
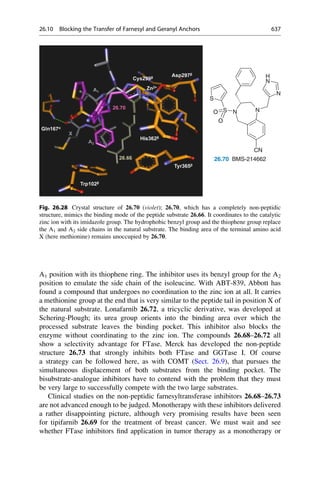
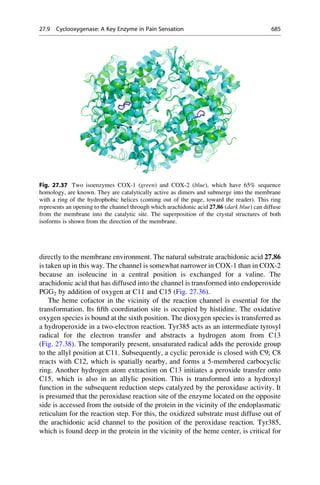
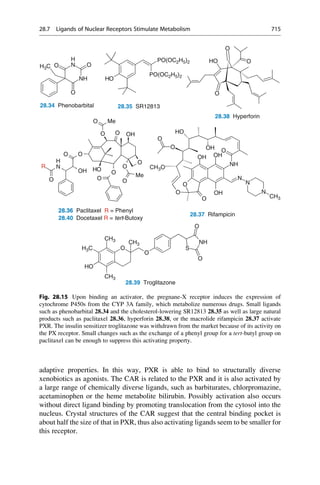
![molecule is calculated by using a force-field. All detected minima correspond to
possible conformations of the molecule.
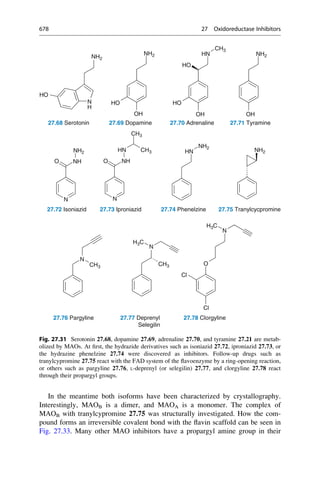
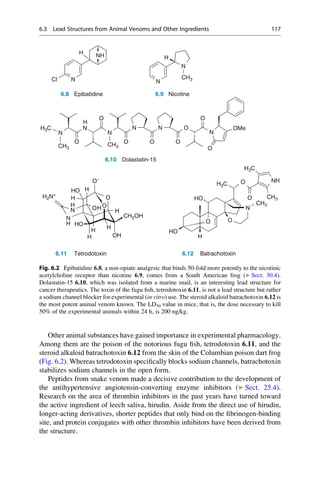
Most drug-like molecules have many single bonds and therefore exhibit more
than one rotatable bond. For these bonds, multiple values of the torsion angle can be
adopted. These values have to be combined for all rotatable bonds in the molecule.
The number of possible combinations increases multiplicatively. The molecule
n-hexane has three rotatable bonds. If, analogous to n-butane, three local minima
are assumed for each rotatable bond (60
, 80
, and 300
), we can expect 3 3
3 ¼ 27 minima. To perform a systematic search for these minima in 10
steps
however, the evaluation of 36 36 36 ¼ 46,656 positions would be necessary. In
principle, the energy must be calculated for each of these positions. Not all angle
positions will, however, lead to reasonable geometries. It can happen that parts of
the molecule fold back upon itself, and parts will mutually superimpose. Such
collisions can be recognized by computer programs, and the geometry is discarded
from consideration. It is also easily imaginable that with an increasing number of
rotatable bonds, the number of local minima and adoptable geometries can dramat-
ically increase in a systematic search.
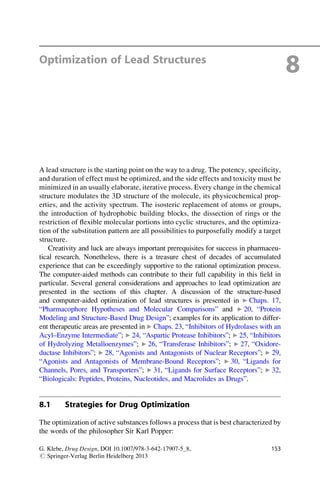
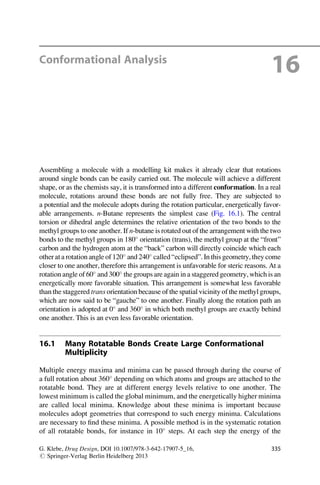
Energy
(kJ/mol)
3,8 kJ
CH3
CH3
CH3
CH3
CH3
CH3
CH3
CH3
CH3
CH3
CH3
CH3
CH3
CH3
τ
0 60 120 180 240 300 360
Torsion Angle t [°]
gauche trans gauche
14,6 kJ
25,5 kJ
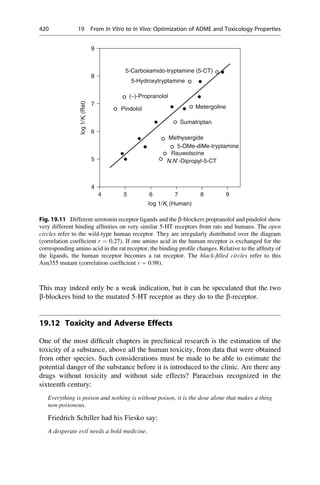
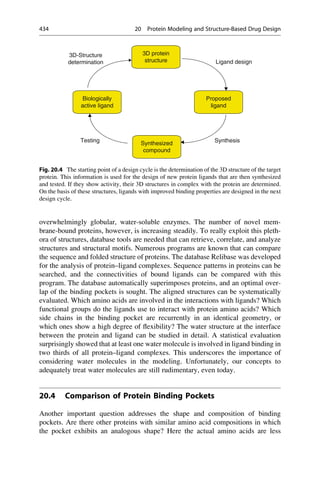
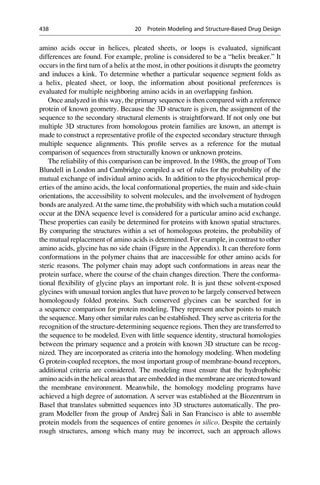
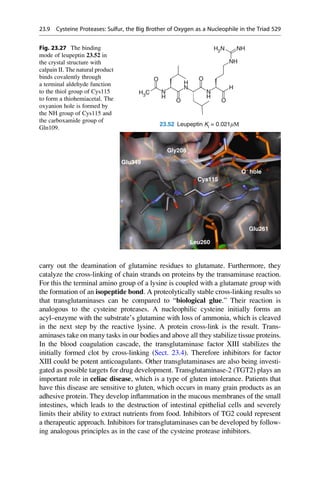
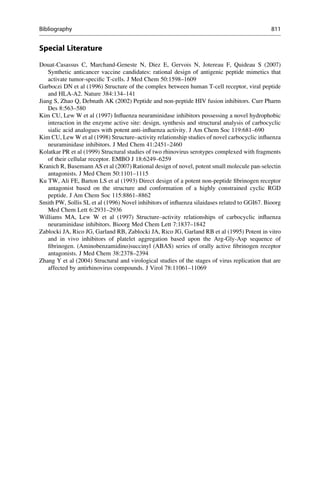
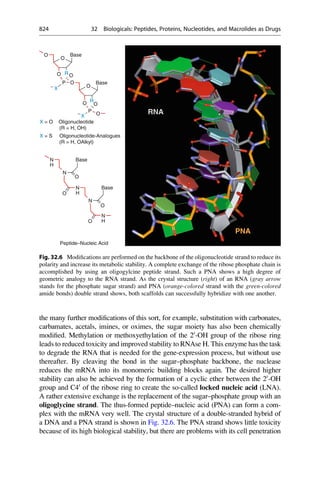
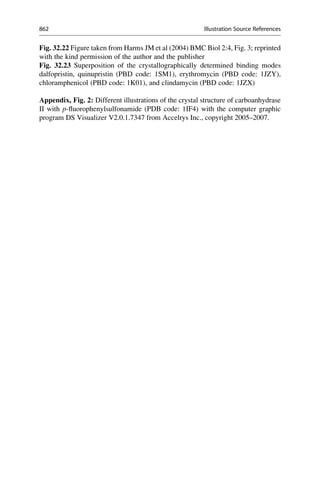
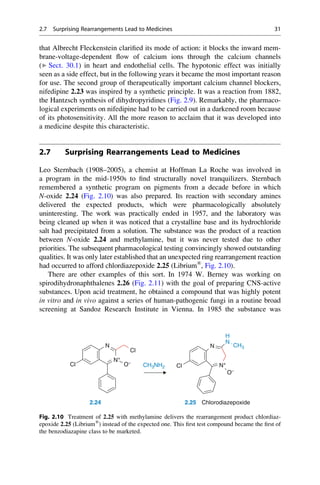
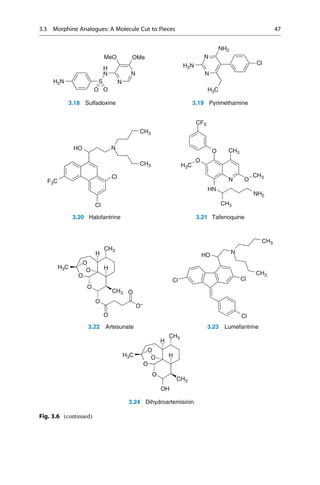
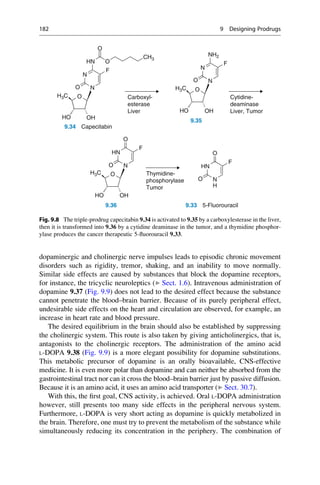
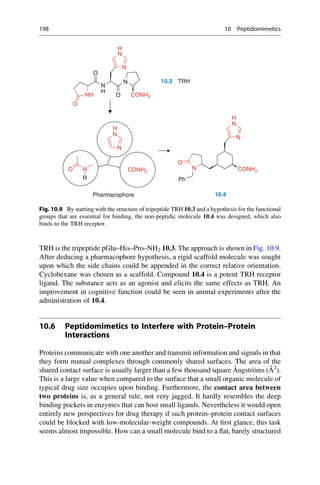
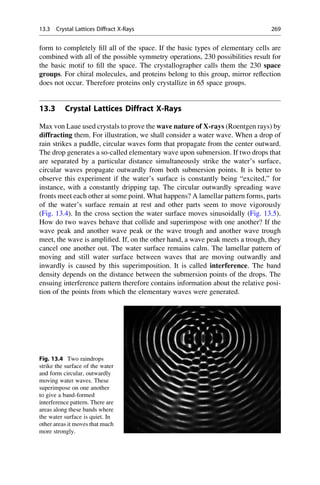
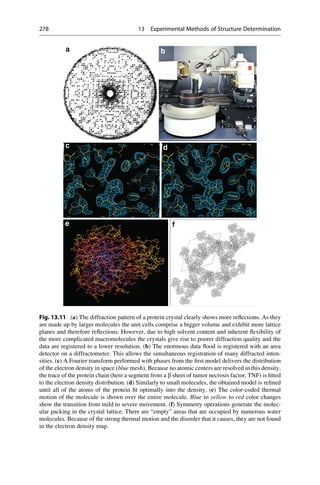
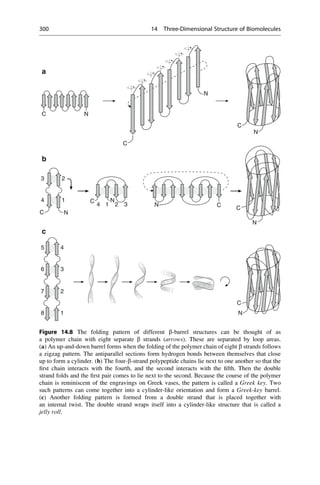
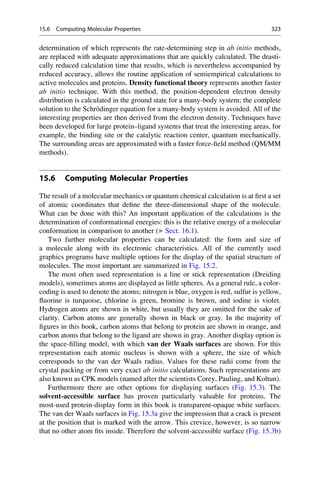
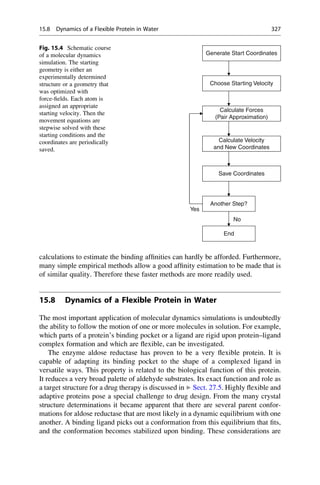
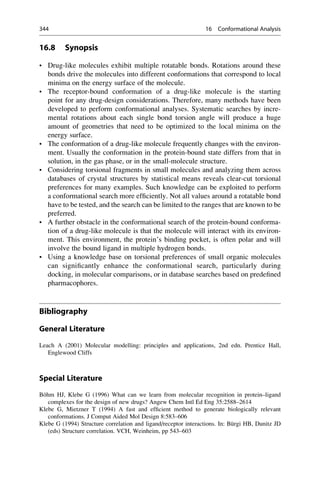
Fig. 16.1 Butane, CH3CH2CH2CH3, is made up of a linear chain of carbon atoms. If the terminal
methyl groups are covering one another after rotation around the central C—C bond, the torsion
angle about the central bond is 0
. At a 60
angle the “back” methyl group is half way between the
“front” methyl group and a hydrogen atom. This situation is called a “gauche” orientation. At 120
a methyl group and a hydrogen atom are eclipsed to one another. At 180
the terminal methyl
groups are exactly opposite one another. Here the energetically most favorable situation, the trans
orientation, is achieved. From now on, the course of the rotation is mirror symmetrical, and ends in
the starting position at 360
. The orientations at 120
and 140
are energetically less favorable than
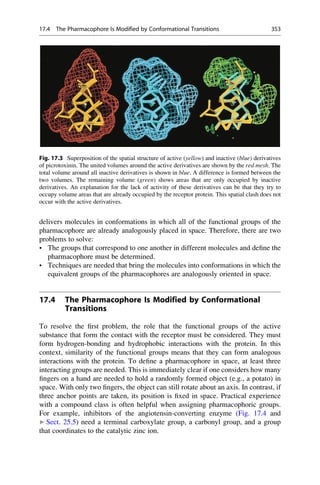
the 180
-orientation by 14.6 kJ/mol. The gauche orientations at 60
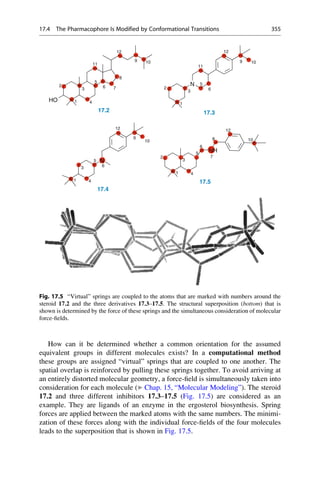
and 300
are the least
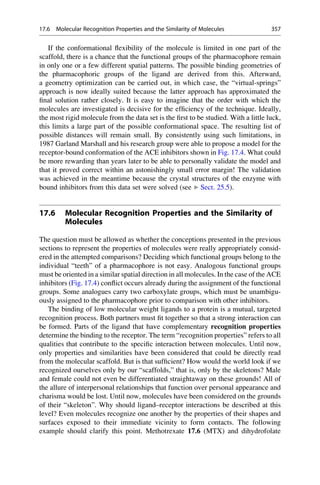
favorable ones and are 25.5 kJ/mol higher in energy. If a minimization method is applied that
can only run “downhill,” the three minima on the potential curve can be reached by starting at the
110
, 130
, and 250
points.
336 16 Conformational Analysis](https://image.slidesharecdn.com/drugdesignbook-230205115813-ec25395b/85/Drug-design-book-pdf-353-320.jpg)
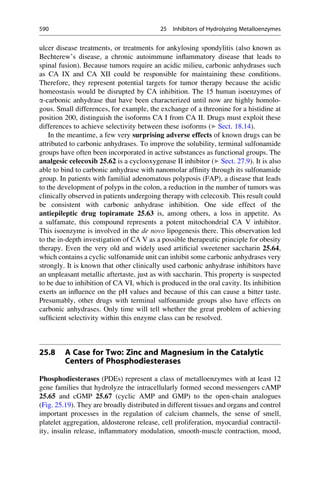
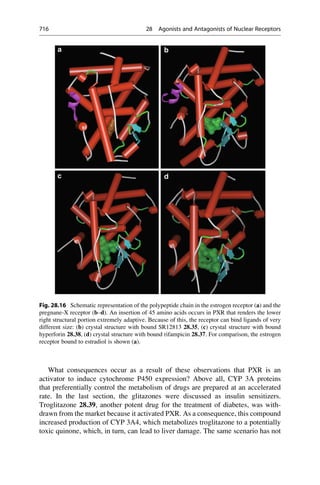
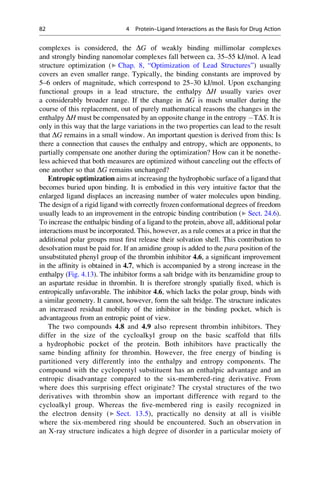
![Unfortunately, the search cannot be narrowed here. This looks better for the other
angles t1–t3. There, only specific values occur. If the systematic search is limited to
these areas, and a search in 10
steps is carried out around the average value, it would
only be necessary to generate 6,340 geometries. Almost the same distance between
phosphorus and adenine is covered with 5.9–9.3 Å as in the unrestricted search.
If a van der Waals energy calculation is carried out on these geometries, values
between 0 and 16.3 kJ/mol are obtained. In contrast to the results from Sect. 16.2, all
the geometries that correspond to the energetically unfavorable areas are discarded.
How can it be confirmed that this restricted search also covers that part of the
conformational space that includes the receptor-bound conformations? Adenosine
monophosphate 16.1 often occurs as a substructure of cofactors in protein com-
plexes so that there is enough information about receptor-bound conformations for
this particular example. They come from crystal structures of proteins with these
bound cofactors. The distance range of 5.9–9.2 Å between the adenine scaffold and
the phosphorus in the receptor-bound structures covers the same range that was
detected in the enhanced systematic search. It can therefore be assumed that enough
geometries were generated that satisfactorily populate the local minima of the
bound state of adenosine monophosphate. Reflecting back to the initial butane
example (Fig. 16.1), this means that the starting points were well distributed so
that all minima were reached.
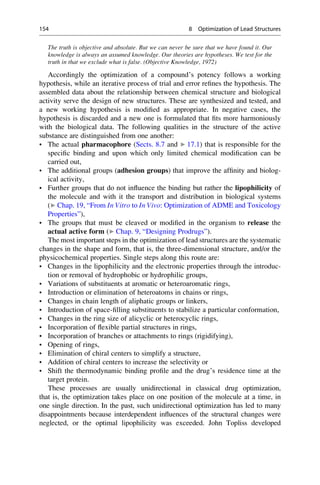
16.5 The Difficulty in Finding Local Minima Corresponding to
the Receptor-Bound State
As already described, the local minima in a systematic conformational search are
obtained by subjecting all of the generated geometries to a force-field optimization.
There can be problems with this approach. To explain this, a different molecule,
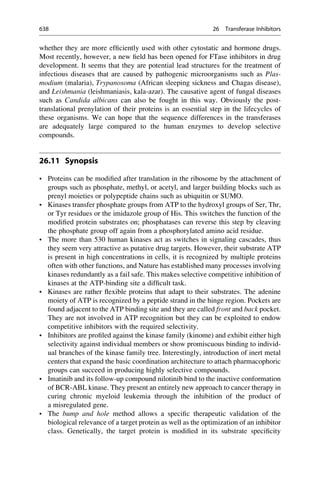
citric acid 16.2 can be considered, in the binding pocket of citrate synthase. Seven
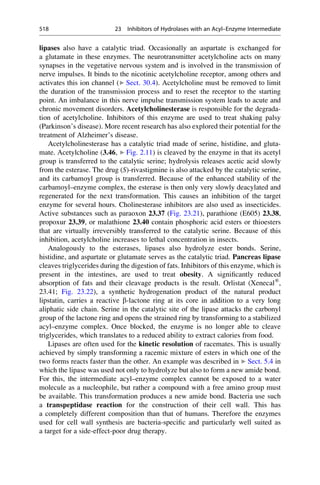
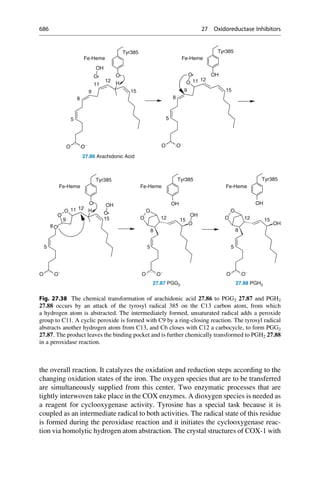
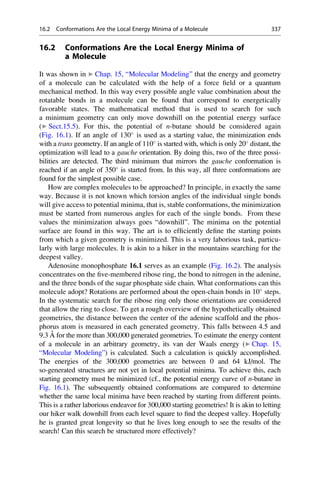
Frequency
[%]
60
80
0
20
40
0 30 60 90 120 150 180 210 240 270 300 330 360
Torsion Angle t [°]
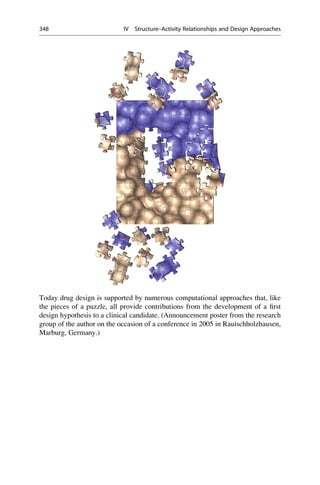
Fig. 16.3 A value distribution for the torsion angles with clusters at 60
, 180
, and 300
is derived
from a database of small-molecule crystal structures for the C—CH2—CH2—C fragment. Most
values are found at 180
. Torsion angles between 0
and 360
are entered as the relative frequency
in percent. The maxima of the distribution are at the points where the potential curve of n-butane
(Fig. 16.1) shows its energy minima.
340 16 Conformational Analysis](https://image.slidesharecdn.com/drugdesignbook-230205115813-ec25395b/85/Drug-design-book-pdf-357-320.jpg)
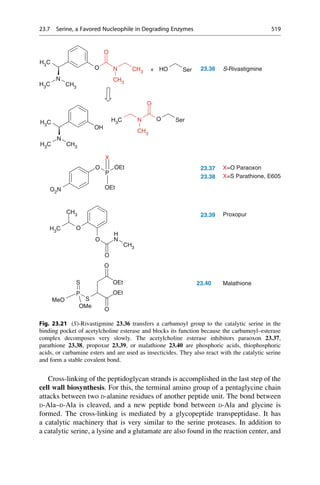
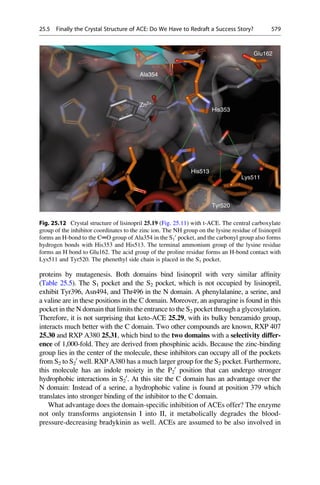
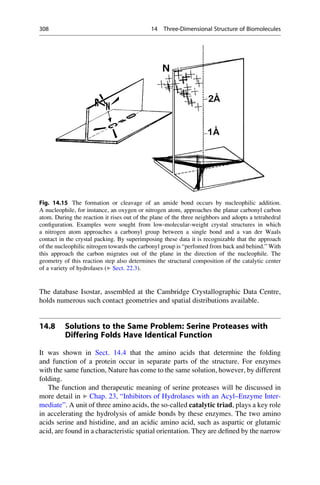
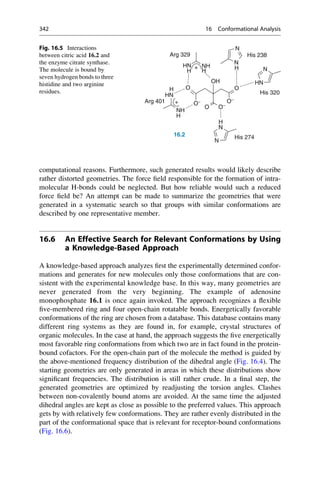
![hydrogen bonds are formed by its three carboxylate groups and the hydroxyl group
to three histidine and two arginine residues of the protein (Fig. 16.5). If the free, not
to the protein bound citrate molecule is considered and its geometry is minimized in
an isolated state, it takes on a conformation with internally saturated hydrogen
bonds (▶ Sect. 15.5). Of course, a different geometry can be started from, but in
all cases, conformations with intramolecular hydrogen bonds will result upon
minimization. Such hydrogen bonds rarely occur in the protein-bound state.
Therefore the conformation that was obtained after minimization in the isolated
state has no relevance for the conditions in the protein.
As a general rule, ligands rarely bind to proteins in a conformation exhibiting
intramolecular hydrogen bonds. The H-bond-forming groups are generally
involved in interactions with the protein.
To circumvent the problem of intramolecular H-bond formation, a minimization
of the generated starting structure can be neglected, and all geometries from the
systematic search can be used for further comparison (▶ Chap. 17, “Pharmacophore
Hypotheses and Molecular Comparisons”). Then, however, very many geometries
must be examined. This would severely limit the scope of such comparisons for
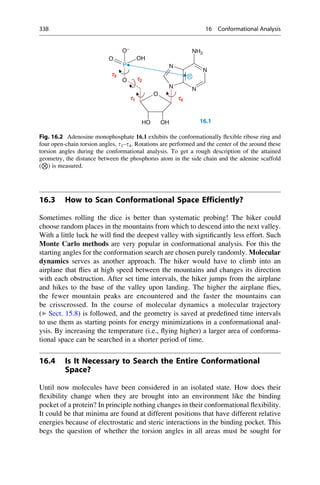
N
N
NH2
O
P
−
O
HO
N
N
O
O
16.1
OH
HO
t1 t4
t2
t3
40
60
20
30
40
0
20
0
10
Frequency
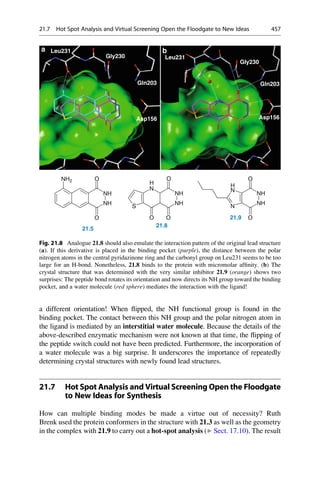
[%]
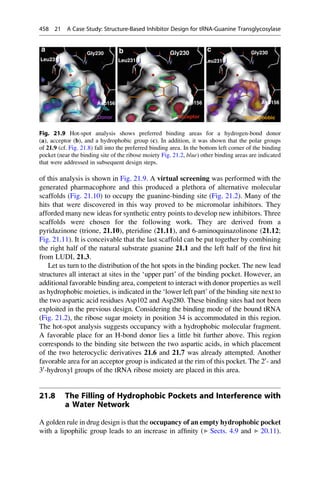
Frequency
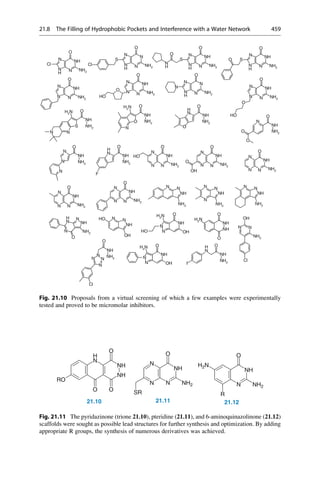
[%]
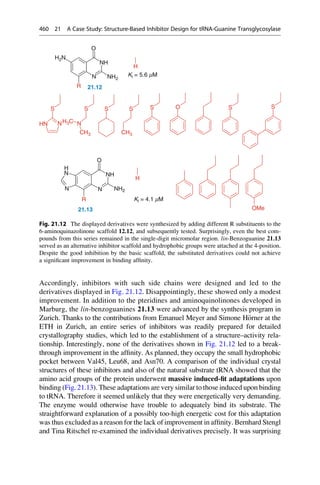
0 30 60 90 120 150 180 210 240 270 300 330 360
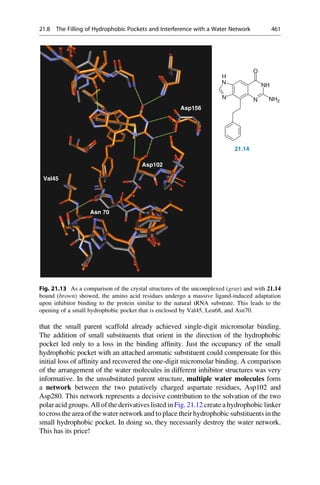
Frequency
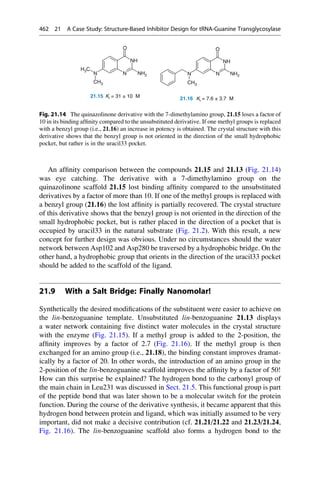
[%]
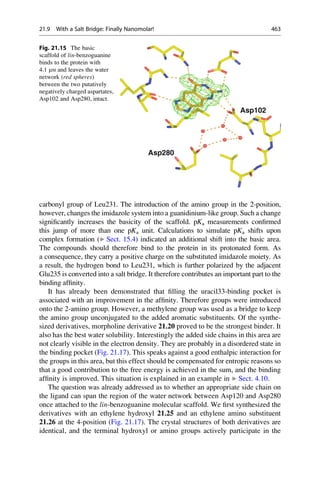
60
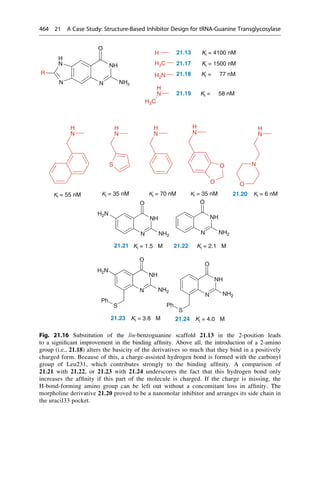
0
20
40
Torsion Angle t [°]
0 30 60 90 120 150 180 210 240 270 300 330 360
Torsion Angle t [°]
Frequency
[%] 15
0
5
10
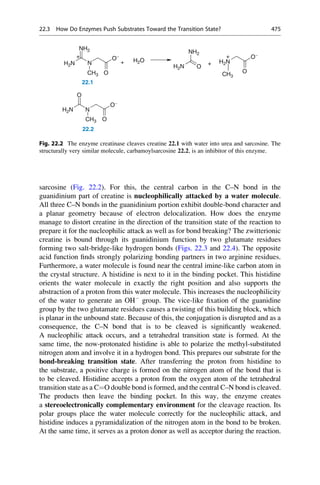
0 30 60 90 120 150 180 210 240 270 300 330 360
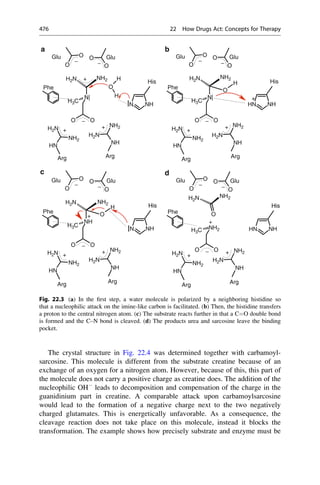
Torsion Angle t [°]
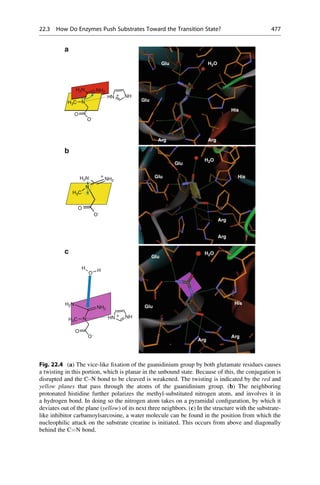
0 30 60 90 120 150 180 210 240 270 300 330 360
Torsion Angle t [°]
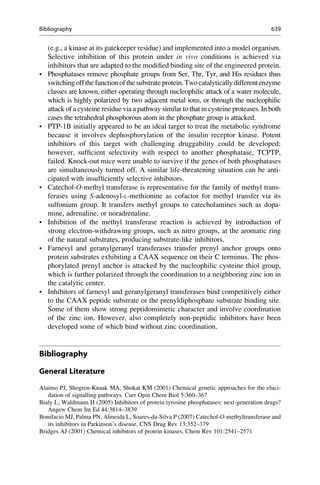
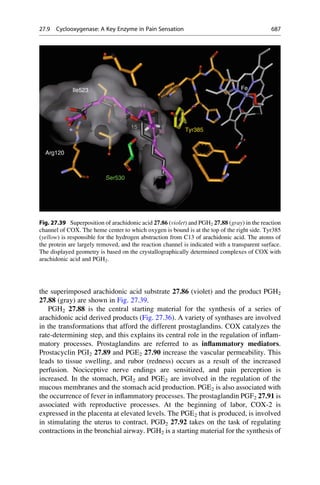
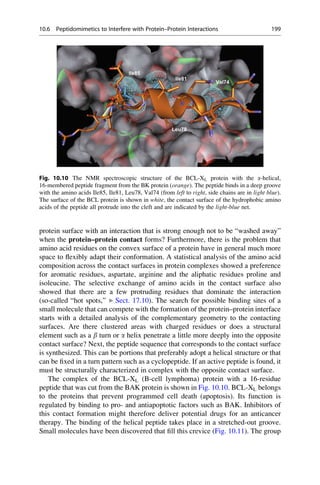
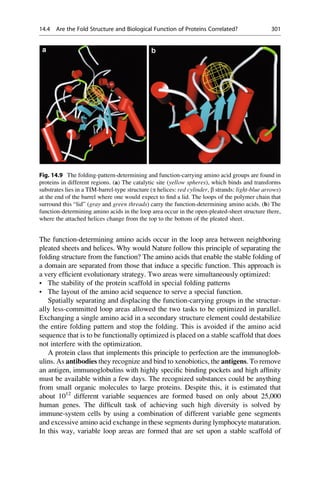
Fig. 16.4 The frequency distribution of the torsion angles of the open-chain bonds of adenosine
monophosphate as found in the crystal structures of small organic molecules. The torsion-angle
histograms are constructed for fragments that are representative for corresponding portions of the
test molecule. There are clearly preferred values for the angles t1–t3, but a broad distribution of all
possible angles is found for t4. This knowledge is used in the conformational analyses and limits
the search for t1–t3 to the preferred value ranges.
16.5 The Difficulty in Finding Local Minima 341](https://image.slidesharecdn.com/drugdesignbook-230205115813-ec25395b/85/Drug-design-book-pdf-358-320.jpg)


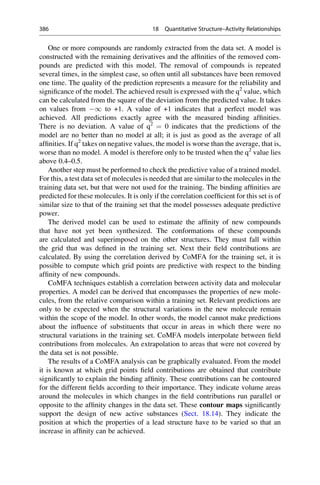
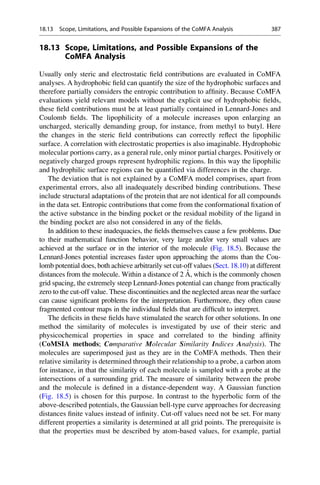
![Quantitative Structure–Activity
Relationships 18
Quantitative structure–activity relationships, QSAR (usually pronounced [0
ky€
u:
sar]), attempt to describe and quantify the correlation between chemical structure
and biological activity. The investigated substances should come from a chemically
uniform series and must interact with the same biological target. They should also
display the same mode of action. For example, structurally analogous inhibitors of
a particular protein can be compared among themselves, but not different blood
pressure lowering drugs that have diverse modes of action on different target proteins.
The correlation of biological activity with the physicochemical properties is always
related to relative potency in a test model, but not to different effect qualities.
The foundation of quantitative correlations between chemical structure and
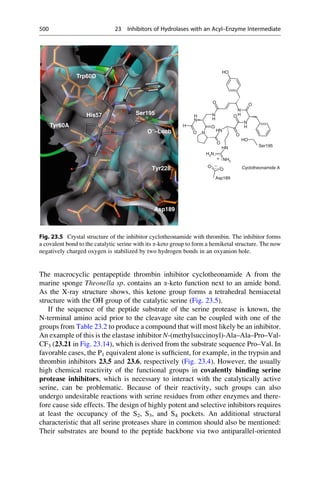
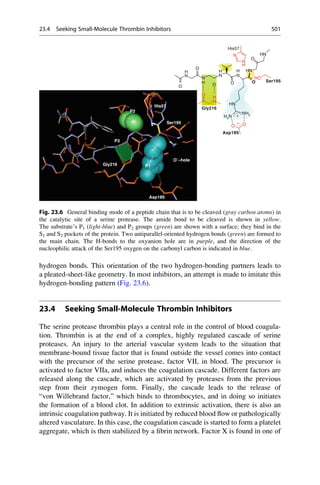
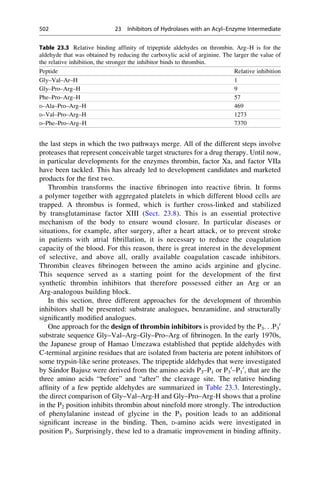
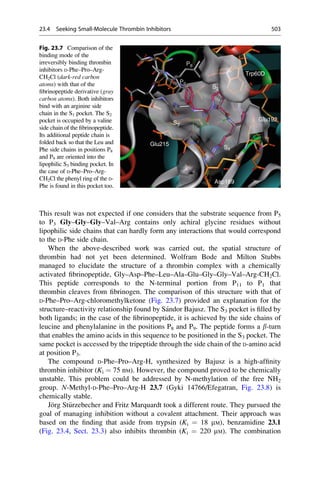
biological effect is the entirely reasonable assumption that the differences in the
physicochemical properties are responsible for the relative potency of the interac-
tions of the drug with biological macromolecules. It is assumed in the first approx-
imation that these contribute additively to the affinity of an active substance on its
receptor. The concept of describing the biological activity of substances with
mathematical models is derived from this approach.
For the system under investigation, it can be assumed that the simpler it is, the
more likely it will be that a quantitative structure–activity relationship can be
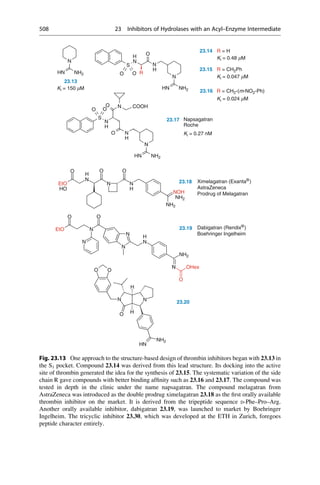
derived. To a certain extent this is valid for in vitro systems, such as the inhibition
of an enzyme or the binding to a receptor, where the assay records only the binding
of a compound to a protein. The more complex the system is, for example, central
nervous system effects on an animal after oral administration, the more different
processes must be considered. In this case the absorption, distribution, blood–brain
barrier penetration, further transport to the target tissue, metabolism, and elimina-
tion overlap with one another and with the actual effect on the receptor. In principle,
an individual structure–activity relationship is required for each of these events.
Establishing valid and relevant models for each of these steps, requires
corresponding test systems that examine the different steps separately. In favorable
cases it might be possible to characterize a complex multistep process by one single
equation. This is only feasible if one step, for instance, the penetration through the
blood–brain barrier, dominates the entire structure–activity relationship.
G. Klebe, Drug Design, DOI 10.1007/978-3-642-17907-5_18,
# Springer-Verlag Berlin Heidelberg 2013
371](https://image.slidesharecdn.com/drugdesignbook-230205115813-ec25395b/85/Drug-design-book-pdf-388-320.jpg)


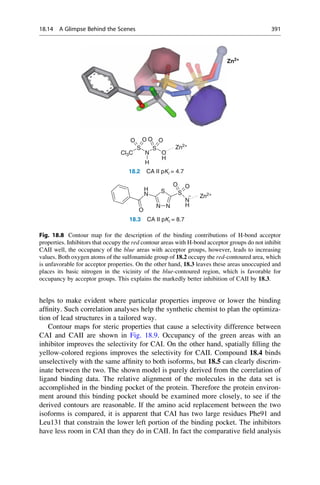
![A similar field analysis is also used for the correlation and prediction of
selectivity differences between ligands. Many enzymes occur as isoforms. They
therefore have similarities in their binding pockets. As a consequence ligands show
graduated affinities or “selectivity profiles” to these isoforms. If a ligand is to be
optimized to improve selectivity, the positions at which a change in a property
results in an improved profile must be known. A 3D-QSAR model is constructed for
each isoenzyme. Either the difference in the affinity values can be calculated and
used for the model as values to be predicted, or alternatively, two correlation
models can be constructed and at each grid point the field contributions are
subtracted from one another. The models that are obtained with both approaches
can be graphically interpreted. Contour diagrams show where and how the mole-
cules are to be changed to improve their selectivity with regard to the one or other
isoenzyme.
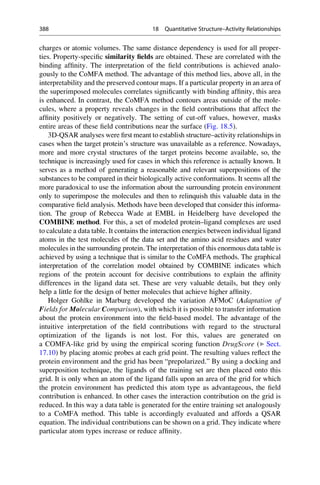
18.14 A Glimpse Behind the Scenes: Comparative Molecular
Field Analysis of Carbonic Anhydrase Inhibitors
Today comparative field analyses belong to the standard repertoire in drug research.
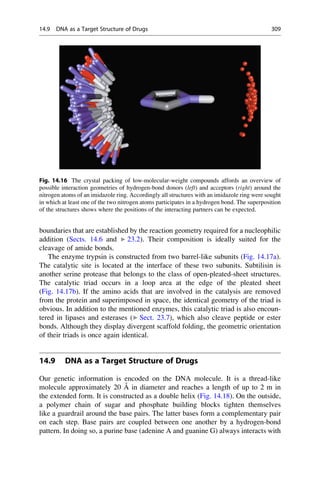
As an example, the binding of inhibitors to carbonic anhydrase I and II shall be
examined. The biological function of this enzyme is described in detail in ▶ Sect.
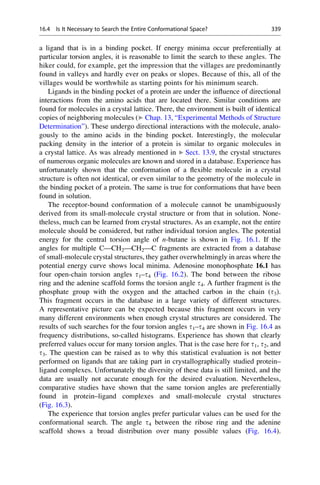
25.7. The sequence identity of the isoforms is 60%. The ligands in the training data
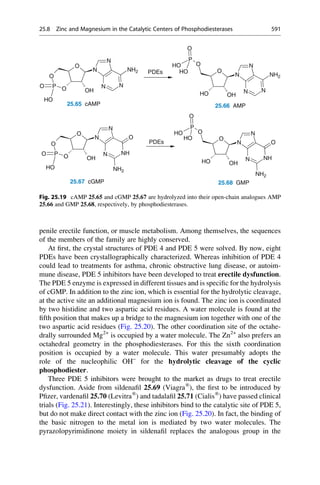
set are derived from the parent structures shown in Fig. 18.6. First, a superposition
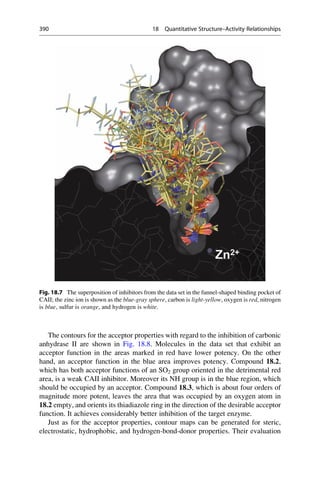
model is generated by docking the ligands into the protein (Fig. 18.7). The
enzyme’s funnel-shaped binding pocket is occupied by ligands in a large variety
of ways. A good correlation model is obtained with the three methods, CoMFA,
CoMSIA, and AFMoC. The models also achieve a convincing predictive power on
a test data set that was independent from the training set.
S
N
N
N
H
SO2
NH2
R1
SO2 S
SO2
NH2
N
R1
H3C S
N
SO2
NH2
R1
SO2
NH2
R1
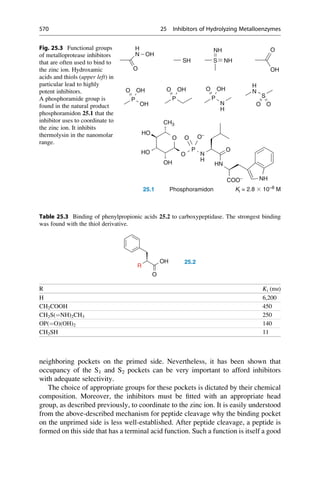
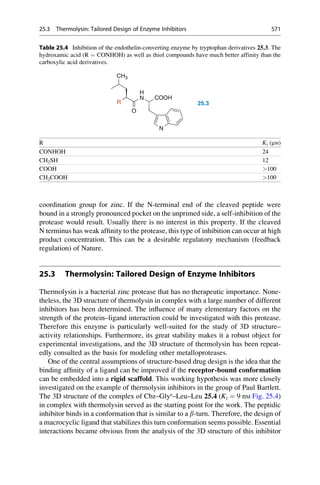
SO2
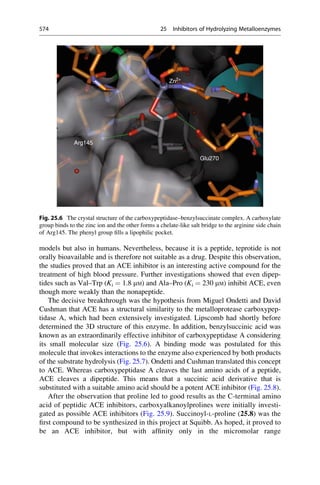
N
H
R1
R2
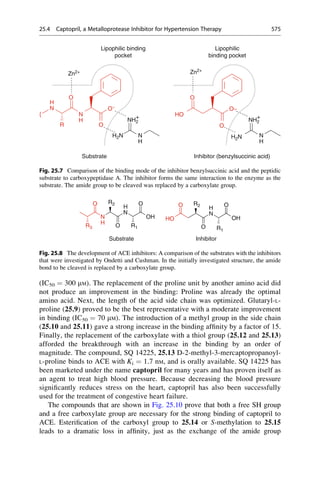
N
H
O
OH R1
SO2
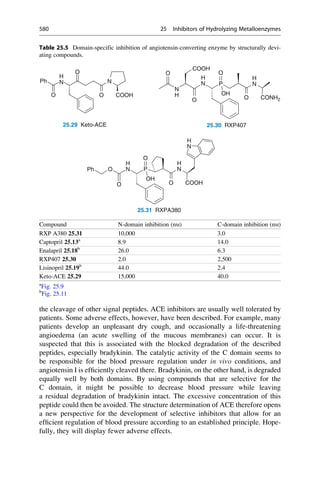
N
H
OH
Thiadiazolsulfonamide Thienothiopyransulfonamide Benzothiazolsulfonamide
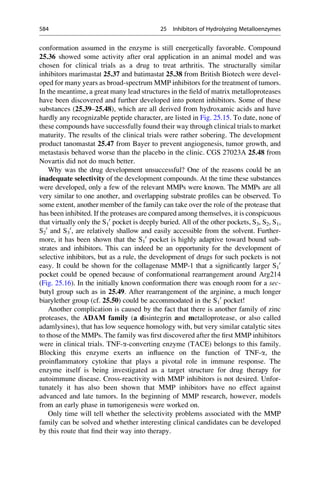
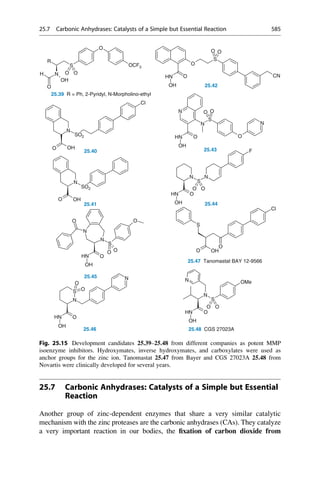
Phenylsulfonamide Hydroxamate Hydroxysulfonamide
Fig. 18.6 The scaffolds of inhibitors that were used in different field analyses to establish affinity
(pKi[CAII]) and selectivity models (pKi[CAII] – pKi[CAI] ¼ DpKi[CAII – CAI]) to describe the
inhibition of the carboanhydrases CAI and CAII. Different substituents were varied at the positions
that are marked as R1
and R2
.
18.14 A Glimpse Behind the Scenes 389](https://image.slidesharecdn.com/drugdesignbook-230205115813-ec25395b/85/Drug-design-book-pdf-406-320.jpg)