Downloaded 12 times


![15
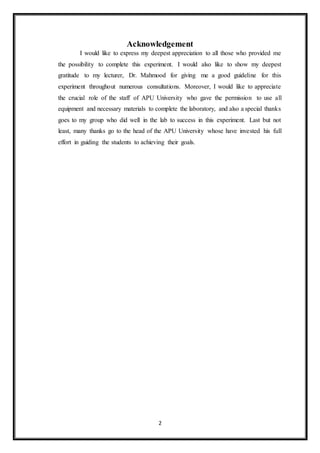
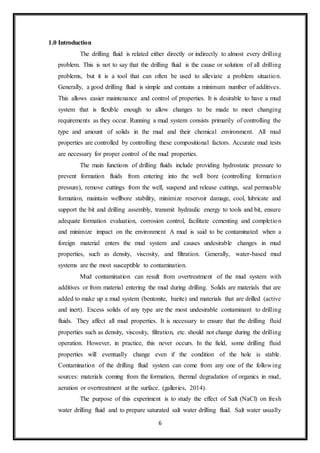
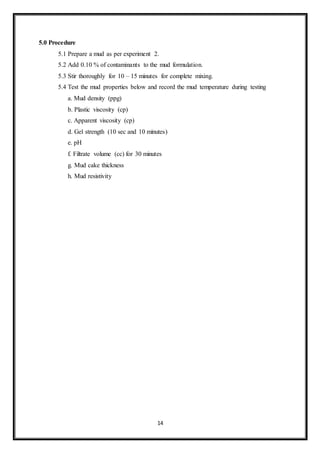
6.0 Results
“This section will be all about the results determined within this experiment in
terms of density, pH, viscosity, filter volume and mud cake thickness for a mud made
of water, soda ash and bentonite. The mud was required to be increased by 0.1% of
contaminants to the mud formulation by adding Kcl. The amount of potassium chloride
added to this experiment mud, can be calculated using the given equation:”
mass = density * volume
Table 1:parameters used
The required amount of Kcl is equal to 0.385g
“The equation needed to calculate the plastic viscosity,”
Plastic viscosity (cp)= [600 rpm reading] – [300 rpm reading]
“The equation needed to calculate the Apparent viscosity,”
Apparent viscosity (cp) = [600 rpm reading] / 2
“The equation needed to calculate the Yield Point,”
Yield Point (Ib/1002) = [300rpm reading] – Plastic viscosity](https://image.slidesharecdn.com/drillingmudcontamination-210308195100/85/Drilling-mud-contamination-15-320.jpg)
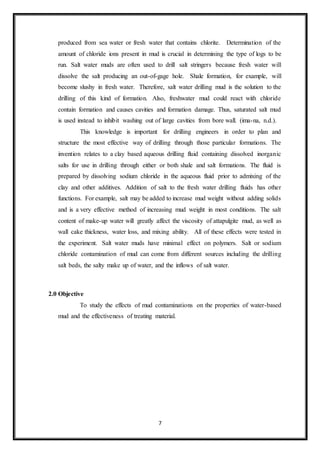
![16
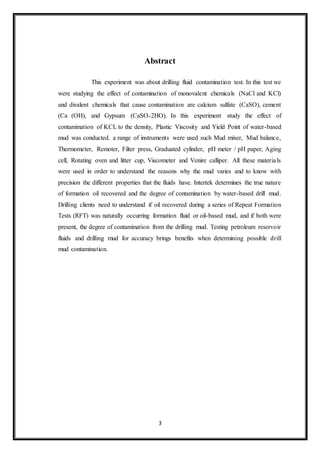
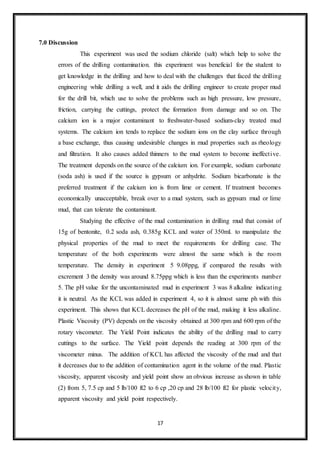
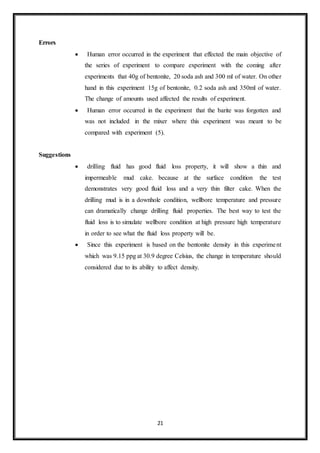
Table 2: parameters used by this experiment.
No. Apparatus Property Result
1 Thermometer Temperature (°C) 32 °C
2 Mud Balance Density (ppg) 9.08 ppg
3 pH Meter / pH Paper pH Value 8
4 Rotational Viscometer
Rheology (cP)
3 rpm 24.5 cP
6 rpm 24.5 cP
100 rpm 30 cP
200 rpm 32 cP
300 rpm 34 cP
600 rpm 40 cP
Plastic Viscosity (cP) Plastic viscosity (cp)= [600 rpm
reading] – [300 rpm reading]
40 – 34 = 6 cP
Apparent Viscosity (cP) Apparent viscosity (cp) = [600 rpm
reading] / 2
40 ÷ 2 = 20 cP
Yield Point (lb/100 ft2) Yield Point (Ib/1002) = [300rpm
reading] – Plastic viscosity
34 – 6 = 28 lb/100 ft2
Gel Strength (lb/100 ft2) 3(10 sec) 30 lb/100 ft2
3 (10 min) 31 lb/100 ft2
5
LPLT Filter Press
Filtrate Volume (cc)
5 min 9 (cc)
10 min 13 (cc)
15 min 10 (cc)
20 min 18 (cc)
25 min 20 (cc)
30 min 22 (cc)
6 Vernier Caliper Mud cake Thickness (mm) 3.42 mm](https://image.slidesharecdn.com/drillingmudcontamination-210308195100/85/Drilling-mud-contamination-16-320.jpg)
![22
9.0 References
A. galleries, 2014. galleries. [Online] Available at: http://www.galleries.com/Barite
[Accessed 25 2 2021].
B. ima-na, n.d. ima-na. [Online] Available at: https://www.ima-
na.org/page/what_is_barite [Accessed 25 2 2021].
C. Oilfield Glossary, n.d. Oilfield Glossary. [Online] Available at:
https://www.glossary.oilfield.slb.com/en/Terms/a/apparent_viscosity.aspx [Accessed
25 2 2021].
D. Philips, A., 2016. drillingformulas. [Online] Available at:
http://www.drillingformulas.com/yield-point-yp-of-drilling-fluids/ [Accessed 25 2
2021].](https://image.slidesharecdn.com/drillingmudcontamination-210308195100/85/Drilling-mud-contamination-22-320.jpg)

1. The document discusses a study on the effect of contamination on water-based drilling mud. Salt (NaCl) was added to fresh water mud at 0.1% to study its effects. 2. Testing found that adding NaCl increased the mud density to 9.08 ppg and maintained a pH of 8. Filtrate volume was measured at 22 cc after 30 minutes. Mud cake thickness was recorded as 3.42 mm. 3. The plastic viscosity was 6 cP, apparent viscosity was 20 cP, and yield point was 28 lb/100ft2. Gel strengths were 30 lb/100ft2 at 10 seconds and 31 lb/100ft2 at 10 minutes.


